University of New Hampshire
University of New Hampshire Scholars' Repository
UNH Stormwater Center Research Institutes, Centers and Programs
6-1-2013
Evaluation and Optimization of Bioretention
Design for Nitrogen and Phosphorus Removal
Robert M. RoseenGeosyntec Consultants
Robin M. Stone
University of New Hampshire
Follow this and additional works at:https://scholars.unh.edu/stormwater
This Report is brought to you for free and open access by the Research Institutes, Centers and Programs at University of New Hampshire Scholars' Repository. It has been accepted for inclusion in UNH Stormwater Center by an authorized administrator of University of New Hampshire Scholars' Repository. For more information, please [email protected].
Recommended Citation
Roseen, Robert M. and Stone, Robin M., "Evaluation and Optimization of Bioretention Design for Nitrogen and Phosphorus Removal" (2013).UNH Stormwater Center. 36.
Evaluation and Optimization of
Bioretention Design for Nitrogen and
Phosphorus Removal
Prepared and Conducted by
Robert M. Roseen, PhD, PE, D.WRE Associate, Geosyntec Consultants
Principal Investigator, Adjunct Professor, UNHSC
Robin M. Stone, M.S., EIT Gradate Research Assistant UNH Stormwater Center
Prepared with Support from U.S. Environmental Protection Agency Region 1 TMDL Program, Town of Durham, Seattle Public Utilities
June 2013
ACKNOWLEDGEMENTS
This study was conducted under funding from the USEPA Region 1 TMDL Program. We extend our sincere appreciation to the Town of Durham for their partnership. The strong municipal partnership and cost sharing was essential to the project success and site selection, and long-term ownership and maintenance.
Project Sponsor
US Environmental Protection Agency
Project Team
UNH Stormwater Center
Robert Roseen, PhD, PE, D.WRE (Project Lead) Robin Stone, MS (Project Researcher)
Alison Watts, PhD, PG (Research Committee) Robin Collins, PhD, PE (Research Committee) James Houle, CPSWQ
Timothy Puls, EIT
Thomas Ballestero, PhD, PE, PG, PH, CGWP
Town of Durham David Cedarholm Michael Lynch Todd Selig Robin Mower Diana Carroll
EPA Project Officers Steven Winnett
1
TABLE OF CONTENTS
ACKNOWLEDGEMENTS ... IV
LIST OF FIGURES ... 3
LIST OF TABLES ... 5
LIST OF EQUATIONS ... 7
TASK 1: LABORATORY AND FIELD STUDIES ... 8
EXECUTIVE SUMMARY ... 8
INTRODUCTION ... 8
BIORETENTION SOIL MIX DESIGN ... 2
BIORETENTION STRUCTURAL CONFIGURATION DESIGN ... 3
STUDY AREA ... 6
SUMMARY OF PROJECT OBJECTIVES ... 7
LITERATURE REVIEW ... 8
BIORETENTION DATABASE FIELD SYSTEM NUTRIENT PERFORMANCE ... 8
COMPOST AND LEACHING POTENTIAL ... 11
ISOTHERM MODELS FOR PSORPTION ... 12
CORRELATING ALOX AND FEOX TO PSORPTION ... 13
COMPETING IONS,ALUMINUM LEACHING POTENTIAL, AND PH ... 13
IMPACT OF WTRAGING ... 14
WTR AND NITROGEN ... 14
EXTRAPOLATING ISOTHERM DATA TO FIELD APPLICATION ... 14
METHODS AND MATERIALS ... 15
EXPERIMENTAL DESIGN ... 15
BSMMATERIALS ... 17
ANALYTICAL PROCEDURES ... 19
BATCH EQUILIBRIUM STUDIES ... 19
Kinetics Studies ... 20
Isotherm Studies ... 20
COLUMN STUDIES ... 20
Permeameter Tests ... 20
Column Setup ... 21
Column Sampling Regimens ... 21
Hydraulic and Nutrient Loading ... 22
Column Contents ... 23
DATA ANALYSIS METHODS ... 25
Isotherm Model Fitting ... 25
Statistical Analysis of Isotherm Models ... 26
Model Verification ... 27
DESIGN OF A BIORETENTION-GRAVEL WETLAND HYBRID ... 29
RESULTS AND DISCUSSION ... 32
SOIL TEST RESULTS ... 32
BATCH EQUILIBRIUM TEST RESULTS ... 35
Kinetics Studies ... 35
Adsorption Isotherm Studies ... 37
Isotherm Model Statistical Analysis ... 49
COLUMN STUDY RESULTS ... 53
Column Media Infiltration Rates and Contact Times ... 53
2
Annual Nutrient Loads ... 57
Empty Bed Contact Time effect on BSM performance ... 60
Impact of WTR Processing on Column Performance ... 62
Filter Media Lifecycle Analysis... 64
SUMMARY OF LABORATORY RESULTS ... 68
FIELD BIORETENTION MONITORING RESULTS ... 69
Internal Storage Reservoir Performance for Nitrogen Removal ... 73
Performance of Systems for Phosphorus, TSS, and Zinc ... 76
Impact of Influent Concentration on Performance ... 78
Treatment Effects on Nutrients ... 84
SUMMARY OF FIELD RESULTS ... 88
CONCLUSIONS AND FUTURE RESEARCH ... 89
CONCLUSIONS ... 89
Optimization of Phosphorus Removal ... 89
Optimization of Nitrogen Removal ... 90
BSM and ISR Design Recommendations for Optimized Nutrient Removal ... 90
FUTURE RESEARCH ... 91
REFERENCES ... 93
APPENDIX A ... 99
ANALYTICAL METHODS ... 99
SOIL REPORTS ... 99
BSMCOMPOSITION ... 99
APPENDIX B ... 108
BATCH EQUILIBRIUM STUDIES DATA ... 108
APPENDIX C ... 121
COLUMN STUDIES HYDRAULICS DATA ... 121
COLUMN STUDIES WATER QUALITY DATA ... 121
APPENDIX D: DURHAM BIORETENTION DESIGN DRAWINGS ... 130
APPENDIX E ... 144
BIO-5CELL 2MONITORING DATA ... 144
BIO-5CELL 1MONITORING DATA ... 144
3
LIST OF FIGURES
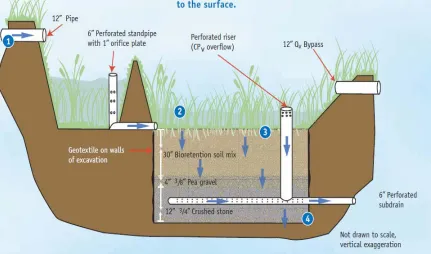
Figure 1. Bioretention Schematic ... 4
Figure 2. Gravel Wetland Schematic ... 5
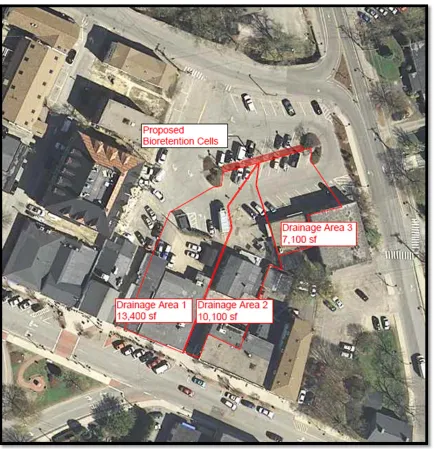
Figure 3. Aerial View of Study Area ... 6
Figure 4. Box-and-Whisker Plots for Total Phosphorus from the SPU Bioretention Database. .. 9
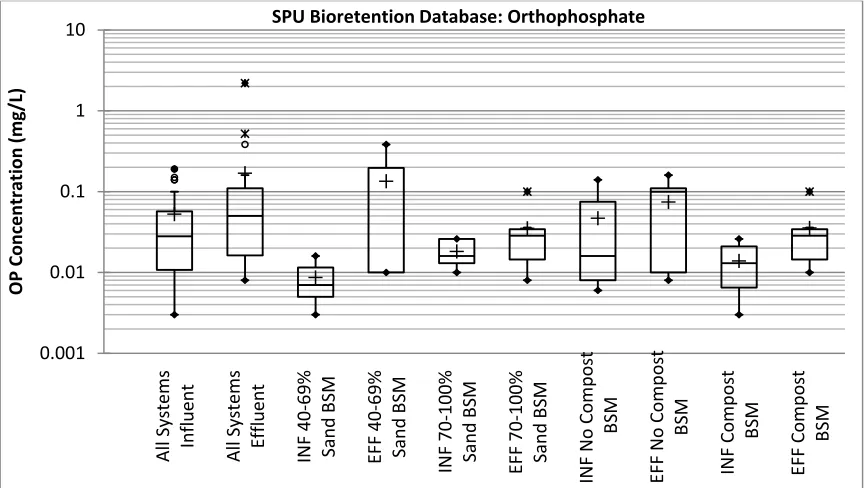
Figure 5. Box-and-Whisker Plots for Orthophosphate from the SPU Bioretention Database. ... 9
Figure 6. Cumulative Frequency Functions of Total Phosphorus and Orthophosphate Removal Efficiencies in the SPU Bioretention Database. ... 10
Figure 7. Box-and-Whisker Plots for Total Nitrogen from the Bioretention Database. ... 11
Figure 8. Box-and-Whisker Plots for Nitrate from the Bioretention Database. ... 11
Figure 9. WTR Lagoon at the Durham Drinking Water Treatment Plant. ... 18
Figure 10. Far side of WTR lagoon at Durham Drinking Water Treatment Plant. ... 18
Figure 11. Layout of Durham Bio-5 Bioretention Cells. ... 30
Figure 12. Long Section of Durham Bio-5 Bioretention Cells. ... 30
Figure 13. Cross-Section of Durham Bio-5 Bioretention Cells. ... 31
Figure 14. BSM Composition on a volume basis ... 34
Figure 15. BSM Composition on a dry mass basis ... 35
Figure 16. Kinetics Study Results. ... 36
Figure 17. Adsorption Isotherm Data for BSM Constituents. ... 37
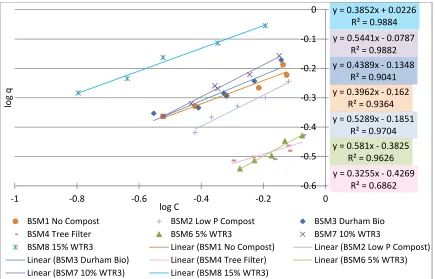
Figure 18. Adsorption Isotherm Data for BSMs ... 38
Figure 19. Langmuir Isotherm Model for Constituents ... 40
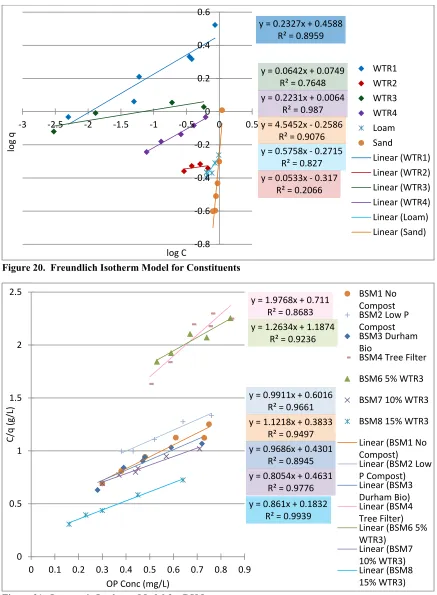
Figure 20. Freundlich Isotherm Model for Constituents ... 41
Figure 21. Langmuir Isotherm Model for BSMs ... 41
Figure 22. Freundlich Isotherm Model for BSMs ... 42
Figure 23. Isotherm Model Assessment: Linear Regression of Observed vs. Modeled q (mg/g). 52 Figure 24. Infiltration Rates of filter media (BSMs) used in each column study phase and permeameter tests. ... 55
Figure 25. Phases 1 and 2 Column Removal Efficiencies based on annual nutrient loads of 43 mg OP/ft2. ... 59
Figure 26. Phase 3 Column Removal Efficiencies based on annual nutrient loads of 43 mg OP/ft2... 60
Figure 27. Column Performance for OP Removal from all columns with 10% WTR from phases 1-3. ... 63
Figure 28. Cumulative Distribution of orthophosphate concentrations in phase 3 column study. ... 64
Figure 29. Bio-5 in Durham, NH immediately after completion (a) and during the first storm (b), Cell 2 in the foreground in each. Photos by Viktor Hlas. ... 70
Figure 30. Time Series Water Quality Data from Bio-5 Cell 2 for contaminants (a) Total Suspended Sediments, (b) Total Nitrogen, (c)Nitrate, (d) Total Phosphorus, (e) Orthophosphate, and (f) Total Zinc. ... 72
Figure 31. Box-and-Whisker Plots for 4 UNHSC vegetated systems’ performance for (a) Total Nitrogen and (b) Nitrate. ... 75
4
Figure 33. Contaminant Removals by 4 UNHSC vegetated stormwater treatment systems. ... 80
Figure 34. Influent Concentration distribution for 4 vegetated systems monitored by UNHSC. 81 Figure 35. Cumulative distribution functions for 4 UNHSC vegetated systems. ... 83
Figure 36. Treatment Effect Plot on OP for 4 UNH systems. ... 84
Figure 37. Treatment Effect Plot on TP for 4 UNH systems. ... 85
Figure 38. Treatment Effect Plot on TN for 4 UNH systems. ... 86
5
LIST OF TABLES
Table 1. Summary of Experiments. ... 16
Table 2. Harvested Stormwater Runoff used as base solution for laboratory experiments. ... 16
Table 3. Composition of Bioretention Soil Mixes for Column Studies. ... 24
Table 4. Materials Characterization. ... 33
Table 5. Mass % Composition of BSMs ... 39
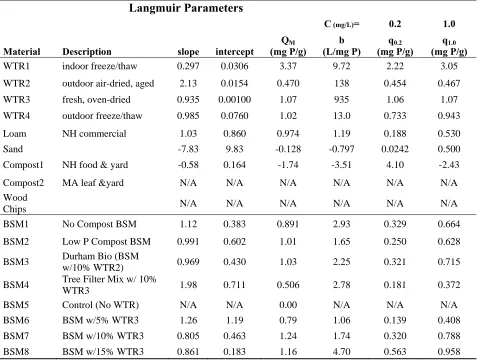
Table 6. Langmuir Isotherm Model Parameters... 44
Table 7. Freundlich Isotherm Model Parameters... 45
Table 8. Langmuir P sorption capacity, BSM ordered by the measured q1.0. ... 46
Table 9. Freundlich P sorption capacity, BSM ordered by the measured q1.0. ... 47
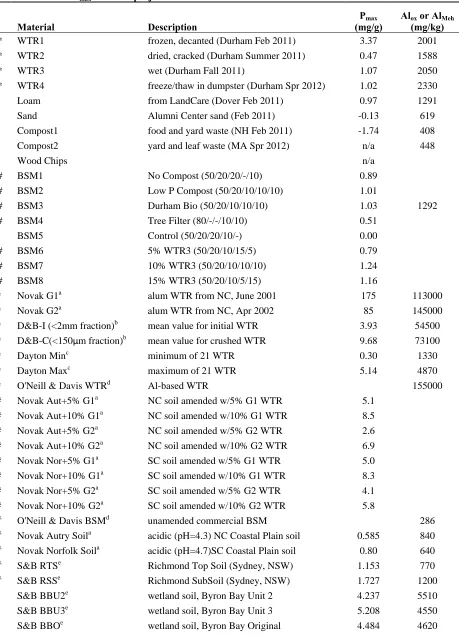
Table 10. Table of Pmax values of project materials and others from literature. ... 48
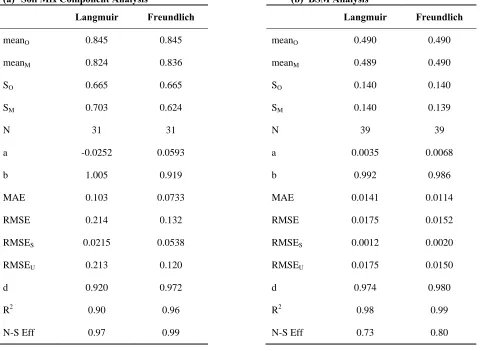
Table 11. Statistical Model Assessment Measures of observed values and values modeled by Langmuir and Freundlich isotherm models for (a) soil mix components and (b) BSMs. ... 50
Table 12. Infiltration Rates and Empty Bed Contact Times (EBCT) of all column media. ... 56
Table 13. Summary Statistics of all column study phases. ... 61
Table 14. Capacity of soil mixes based on Langmuir modeled mass adsorption capacity of columns (mp) and actual mass adsorption(ma) during column study phase 3. ... 66
Table 15. Contributions of each component to the PSC of bioretention soil mixes. ... 67
Table 16. Summary Statistics of Dissolved Oxygen concentrations in Bio-5 Cell 2 catchbasin for four summer 2012 storms. ... 74
Table 17. Summary Statistics of pH in Bio-5 Cell 2 catchbasin for four winter and four summer storms. ... 76
Table 18. Summary Statistics of UNHSC vegetated systems’ performance for removal of TSS, Zinc, TN, Nitrate, TP, and Orthophosphate... 87
Table 19. Absolute Resource Associates Laboratory analytical methods and expected detection limits for each analyte. ... 100
Table 20. Analytical Services Laboratory analytical methods and expected performance data for each analyte. ... 101
Table 21. Biosolids and Septage Spreading Soil Reports. ... 103
Table 22. Compost Soil Reports Part 1. ... 104
Table 23. Compost Soil Reports Part 2. ... 105
Table 0-6. Sum of Cation Equivalents. ... 105
Table 25. BSM Composition(volumetric) ... 107
Table 26. BSM Composition (dry mass basis) ... 107
Table 27. Kinetics Study 1 4/6-4/8/2011. ... 109
Table 28. Kinetics Study 9/20-9/23/2011 . ... 111
Table 29. Kinetics Study 1/11-1/20/12 . ... 112
Table 30. Component Isotherm Studies(Grayed out rows indicate data points removed from analyses after QC) . ... 113
Table 31. Bioretention Soil Mix (BSM) Isotherm Studies(Grayed out rows indicate data points removed from analyses after QC) . ... 117
Table 32. Infiltration Rates (in/hr) from phase 1 column studies. ... 122
Table 33. Infiltration Rates (in/hr) from phase 2 column studies. ... 122
Table 34. Infiltration Rates (in/hr) from phase 3 column studies. ... 123
Table 35. Empty Bed Contact Times (minutes) from phase 1column studies. ... 123
6
Table 37. Empty Bed Contact Times (minutes) from phase 3column studies, as determined from
total run times and total effluent volumes for each event. ... 124
Table 38. Calculations of Annual OP Load. ... 125
Table 39. Calculations of OP Loads ... 125
Table 40. Phase 1 Column Study OP Concentration Data. ... 125
Table 41. Phase 1 Column Study Removal Efficiencies. ... 126
Table 42. Phase 2 Column Study OP Concentration Data. ... 127
Table 43. Phase 2 Column Study OP Removal Efficiencies. ... 127
Table 44. Phase 3 Column Study OP Concentration Data. ... 128
Table 45. Phase 3 Column Study OP Removal Efficiencies. ... 129
Table 46. Plants in initial planting of Bio-5. ... 131
Table 47. Schedule. ... 131
Table 48. Bio-5 Cell 2 Data for all monitored storms. ... 145
7
LIST OF EQUATIONS
Equation 1. Phosphate Adsorption ... 3
Equation 2. Nitrification ... 4
Equation 3. Nitrification ... 4
Equation 4. Denitrification ... 4
Equation 5. Column Infiltration Rate Estimation ... 22
Equation 6. Empty Bed Contact Time ... 22
Equation 7. Observed Adsorbent-Phase Concentration ... 25
Equation 8. Langmuir-Modeled Adsorbent-Phase Concentration ... 25
Equation 9. Linearized Langmuir Equation ... 26
Equation 10. Freundlich-Predicted Adsorbent-Phase Concentration ... 26
Equation 11. Linearized Freundlich Equation ... 26
Equation 12. Mean Absolute Error ... 27
Equation 13. Root Mean Square Error ... 27
Equation 14. Index of Agreement ... 27
Equation 15. Nash-Sutcliffe Efficiency ... 27
Equation 16. Removal Efficiency ... 27
Equation 17. Efficiency Ratio ... 28
Equation 18. Cunnane Plotting Position ... 28
Equation 19. Oxalate Ratio ... 32
Equation 20. Calculated Adsorption Rate ... 45
Equation 21. Empty Bed Contact Time ... 54
Equation 22. Removal Efficiency ... 57
Equation 23. Annual OP Loads ... 58
Equation 24. Mass Adsorbed in Columns ... 64
8
Final Report on Evaluation and
Optimization of Bioretention Design for
Nitrogen and Phosphorus Removal
TASK 1: LABORATORY AND FIELD STUDIES
EXECUTIVE SUMMARY
Laboratory and field investigations were conducted into the performance of modified bioretention designs, optimized for reduction of nutrient loads from stormwater runoff into sensitive water bodies, such as southeast New Hamphire’s Great Bay. Bioretention design characteristics of particular interest were filter media composition and structural configuration. Dissolved phosphorus may be adsorbed to aluminum (hydr)oxide surfaces, such as those present in drinking water treatment residuals (WTR), in filter media. A series of aerobic and anaerobic zones in treatment systems allows for nitrogen transformations into nitrogen gas, removing it from water. A filter media admixture of raw WTR at low solids content (5-10% solids) effectively removed orthophosphate in laboratory tests when included at 10-15% of the bioretention soil mix by volume (90-99% median removal efficiencies). WTR processed to increase solids content to 34% demonstrated consistently higher removal efficiencies (>99%).
This study introduces an innovative bioretention design with WTR admixture filter media and internal storage reservoir to optimize both phosphorus and nitrogen removal. A bioretention system constructed in the town of Durham, NH in summer 2011 and monitored from fall 2011 to fall 2012 includes a bioretention soil mix with raw WTR admixture (~10% solids) and a
structural design modeled after the UNHSC subsurface gravel wetland design specifications, a system that has demonstrated excellent nitrogen removal through an internal anaerobic storage reservoir. Orthophosphate, the most bioavailable form of phosphorus, was generally reduced in this system, with median removal efficiency of 20% and effluent concentrations consistently below 0.02 mg/L. A median nitrate removal efficiency of 60% showed substantial improvement over the median 14% removal efficiency by systems reported in the literature based bioretention database for Seattle Public Utilities. The innovative Durham bioretention system also achieved median removal efficiencies of 55% and 36% for total phosphorus and total nitrogen,
respectively.
INTRODUCTION
Excess nutrient loading to surface waters accelerates the process of eutrophication, degrading water bodies for habitat, drinking water, recreation and other uses. Stormwater runoff is a
2
limiting nutrient in saltwater bodies (Howarth and Marino 2006), such as the sensitive New Hampshire estuaries, while phosphorus is limiting in freshwater (Schindler et al. 2008). Some argue, however, that it is important to manage both nitrogen and phosphorus loads to all water bodies to avoid accelerating the process of eutrophication (Carpenter et al. 1998; Conley et al. 2009). Plant material and excess fertilizer often contribute to the nutrient load in runoff, as well as atmospheric deposition of nitrogen from fossil fuel emissions. Conley et al. (2009) emphasize the necessity of balancing both nitrogen and phosphorus loads to avoid transporting dead zones downstream.
Optimized bioretention systems are a way to potentially reduce the nutrient loads from
stormwater runoff to surface waters in order to achieve the balance needed to slow the process of eutrophication. Bioretention systems have become popular in recent years as a small footprint, low maintenance Low Impact Development (LID) option, capable of reducing negative
hydrologic and water quality effects of land development. While bioretention systems tend to perform very well with regards to removal of suspended solids, including particulate phosphorus, through sedimentation and filtration, as well as adsorption of heavy metals, adsorption of
dissolved phosphorus is associated with the presence of amorphous aluminum and iron oxides, which are highly variable in bioretention soils (Davis et al. 2010). Ammonia is also adsorbed on filtration media, but is often subject to biotransformations, necessitating intervention with regard to microbiological processes for the sake of nitrogen removal (Davis et al. 2010). The aerobic process of nitrification, transforming the trapped ammonia (NH3) to nitrite (NO2) and nitrate (NO3), often occurs between rainfall events in bioretention systems (Davis et al. 2010). Without also designing for an anoxic zone, in which denitrification can occur, bioretention systems may export significant amounts of nitrate (Davis et al. 2010). Davis et al. (2010) call for the
exploration of supplementing phosphorus sorption capacity of bioretention soils and utilizing the potential for denitrification in the structural configuration of bioretention systems.
This study examines bioretention soil mixes (BSMs) and structural configurations to optimize the removal of nitrogen and phosphorus from runoff. Assuming that vegetation will provide important uptake of nutrients (Henderson et al. 2007), this study seeks to develop a bioretention soil mix designed to optimize phosphorus removal through filtration and adsorption while also supporting plant growth, and a bioretention structural design which includes an internal storage reservoir and increased horizontal flow path length to promote the process of denitrification.
Bioretention Soil Mix Design
The goal of this study with regards to bioretention soil mix (BSM) design is to predict
3
The sludge that settles after the coagulation/flocculation process contains amorphous aluminum and iron (hydr)oxides, which are highly reactive with dissolved phosphorus and have a large surface area for adsorption to occur (Lucas and Greenway 2011a; Makris et al. 2004).
According to Makris et al. (2004), WTRs contain internal micropores in which diffusion occurs. An elevated activation energy of desorption within the micropores immobilizes sorbed P,
increasing its stability. Alum has been used to successfully reduce phosphorus runoff from poultry litter in previous studies (Moore et al. 1999). The adsorption equation is given as:
( ) + → ( ) ∙
Equation 1. Phosphate Adsorption
The product of this equation is an amorphous aluminum phosphate compound, which is transformed over time into more stable crystalline mineral, such as variscite, AlPO4-2H2O, or wavellite, Al3(PO4)2(OH)3-5H2O (Moore et al. 1999). Studies of phosphate sorption-desorption behavior in acidic soils by Sanyal et al. (1993) demonstrated the hysteresis of P sorption.
Desorption experiments actually had higher levels of sorbed P than sorption experiments (Sanyal et al. 1993). Similar results for the immobilization of dissolved P may be expected from WTR, due to the similar chemistry of alum and PACl, which is present in WTR from Durham.
The Langmuir and Freundlich isotherm models are frequently used in linearized forms to model the adsorption process and provide information about the adsorption capacity of a material. These models were used to calculate the phosphorus adsorption capacity of WTRs, which may then be used to predict the performance of WTR in a bioretention soil mix. Studies have found the Langmuir model to be useful for modeling phosphorus adsorption by WTR (Dayton and Basta 2005; Moazed et al. 2010; Novak and Watts 2004).
Bioretention Structural Configuration Design
4
Figure 1. Bioretention Schematic
The ability of natural wetlands to remove nitrogen from the lithosphere and hydrosphere has been harnessed in constructed subsurface gravel wetland systems, which demonstrated 75% annual median DIN removal efficiency at the UNHSC West Edge Facility from 2004 to 2010 (UNH Stormwater Center et al. 2012). For the necessary transformations to occur, an aerobic zone must precede an anaerobic zone in the travel path. The schematic of the UNHSC
subsurface gravel wetland in Figure 2 illustrates each of these zones and the nitrogen
transformations that occur in each. Nitrogen mineralization converts organically bound nitrogen to ammonium (NH4+) and can occur in either aerobic or anaerobic conditions. Ammonium ions may be transformed to ammonia and released to the atmosphere or adsorbed to the soil, but they may also undergo oxidation through nitrification (Mitsch and Gosselink 2000). Nitrification is a two step process involving bacteria Nitrosomonas and Nitrobacter, which converts ammonium to nitrite then nitrate by the reactions below (Mitsch and Gosselink 2000):
2 + 3 → 2 + 2 + 4 +
Equation 2. Nitrification
2 + → 2 +
Equation 3. Nitrification
Nitrate (NO3-) is the next terminal electron acceptor after oxygen has been consumed; thus under anaerobic conditions, the denitrification process converts nitrate to nitrogen gas to be released to the atmosphere (Mitsch and Gosselink 2000):
+ 4 → 6 + 6 + 2
5
The anaerobic zone is constructed in the subsurface gravel wetland by the installation of an elevated outlet above the gravel layer, creating an internal storage reservoir. Native soil below the gravel layer is compacted to discourage infiltration so that the gravel layer remains saturated and becomes anaerobic due to bacterial activity. The several pathways for nitrogen retention are typically slower processes than those which remove other contaminants. Some of these occur between, rather than during, rain events in a system. Gravel wetland systems tend to have large footprints due to the need for an extended travel path. UNHSC design specifications recommend a minimum horizontal flow path length of 30 feet (UNH Stormwater Center et al. 2012). One study concluded that nitrogen retention is a rate-dependent process, based on a study of outlet controlled bioretention mesocosms, which retained more than double the nitrogen oxides (NOx) and total nitrogen than their free-flowing counterparts (Lucas and Greenway 2011b). By combining elements of each of these systems (filter media from the bioretention system and an internal storage reservoir from the gravel wetland), removal of both nitrogen and phosphorus should be improved over typical bioretention designs.
6
Study Area
The study area chosen for implementing this new design is in a municipal lot in downtown Durham, NH. Two side-by-side systems were constructed in summer 2011 in a heavily trafficked parking lot, leased from the University of New Hampshire by the town of Durham. Construction was a joint venture between the UNH Stormwater Center, EPA Region 1, and the Town of Durham. Figure 3 shows an aerial view of the proposed site location and the surveyed drainage areas to the two systems, named Cell 1 and Cell 2. Drainage area 1 drains to Cell 1, while drainage areas 2 and 3 drain to Cell 2. Each system receives runoff from rooftop as well as asphalt parking lot and parking spaces.
7
Summary of Project Objectives
The objective of this study was to optimize bioretention filter media and structural design for nutrient removal from stormwater runoff. The particular goals included performance
assessments of: 1) aluminum-based water treatment residuals as filter media amendments to enhance phosphorus adsorption, and 2) internal storage reservoir design to promote
denitrification in bioretention systems. Water treatment residuals (WTR) were evaluated in both raw and processed forms, alongside other filter media constituents. Internal storage reservoir design characteristics of note included the volume of the reservoir and the length of the horizontal flow path. The flow path length directly affects the time water spends in the anaerobic zone where denitrification may occur.
The experimental work for this project included laboratory and field phases, with the laboratory phase focusing on filter media design and the field phase implementing filter media and
8
LITERATURE REVIEW
During the course of this project, extensive literature review was undertaken. This included numerous papers concerning phosphorus sorption and use of Langmuir and Freundlich isotherm models, as well as considerations of other crucial bioretention soil mix (BSM) constituents, especially compost which has leaching potential. The author has also produced an extensive bioretention water quality database, based on review of over 70 studies of field and laboratory bioretention type systems (Roseen et al. 2013). The field systems from this bioretention database produced for Seattle Public Utilities (from this point forward referred to as the SPU database) provide some basis and context for the goals of the present study.
Bioretention Database Field System Nutrient Performance
The bioretention database includes site characteristics and design criteria of individual field systems; water quality data includes median influent and effluent concentrations and median removal efficiencies for each system when available. Box-and-whisker plots below present statistics on median influent and effluent concentrations for nitrogen and phosphorus data for all of the systems which reported on these constituents. Available design criteria categories of particular interest to this project are also included. For phosphorus data, BSM design is of most importance, so sand and compost content categories are included. For nitrogen data, whether or not the system includes an internal storage reservoir (ISR) is of most interest.
Total phosphorus data indicates that effluent concentrations are not necessarily reduced from influent concentrations in general (Figure 4). Medians of the systems’ orthophosphate (OP) effluent concentrations are generally higher than median influent concentrations (Figure 5). Although effluent OP and TP concentrations are generally lower for systems that contain compost, these systems also have lower influent concentrations than the other categories. Literature did not report many details about the type or quality of compost, which can vary widely. Thus, some composts may leach phosphorus, while others may not. Use of a local food and yard waste compost to support plant growth was a concern as a phosphorus source in
effluent for this study. UNHSC has considered use of compost to support vegetation and significant sand content to maintain high infiltration rates as crucial components to a successful bioretention soil mix. Excessively high sand content in UNH Stormwater Center systems,
9
Figure 4. Box-and-Whisker Plots for Total Phosphorus from the SPU Bioretention Database.
Figure 5. Box-and-Whisker Plots for Orthophosphate from the SPU Bioretention Database.
Another point that pertains to the present study is the difference made by land use. This project’s study area is a highly trafficked parking lot located near Main Street and the primary commercial section of Durham, NH. As such, it falls within the commercial parking land use category in the cumulative distribution function below, which shows generally lower removal efficiencies from systems installed in this type of location (Figure 6). Though the difference appears small, note that a number of the removal efficiencies are highly negative, indicating significant leaching from some systems. Median TP removal from the systems in commercial parking areas is
All Systems Influent All Systems Effluent INF 40-69% Sand BSM EFF 40-69% Sand BSM INF 70-100% Sand BSM
EFF 70-100% Sand BSM INF No Compost
BSM
EFF No
Compost
BSM
INF Compost
BSM
EFF Compost
BSM
0.01 0.1 1 10
TP Concentration
(mg/L)
SPU Bioretention Database: Total Phosphorus
All Systems Influent All Systems Effluent INF 40-69% Sand BSM EFF 40-69% Sand BSM INF 70-100% Sand BSM
EFF 70-100% Sand BSM INF No Compost
BSM
EFF No
Compost
BSM
INF Compost
BSM
EFF Compost
BSM
0.001 0.01 0.1 1 10
OP Concentration
(mg/L)
10
actually only 25% removal, and median orthophosphate removal is -9%. According to this data, OP leaches from at least half of the systems built in commercial parking areas.
(a) (b)
Figure 6. Cumulative Frequency Functions of Total Phosphorus and Orthophosphate Removal Efficiencies in the SPU Bioretention Database.
Though only a slight downward shift of TN and nitrate concentrations is observed from influent to effluent when all systems are considered, the statistics shift very clearly between effluent concentrations of systems with and without internal storage reservoirs (ISR). It appears that systems without ISR are likely to export TN and nitrate in particular, while systems with internal storage generally decrease concentrations (Figure 7 and Figure 8). The median removal
efficiencies of bioretention systems in the SPU database are 42% for total nitrogen and 14% for nitrate. -400% -300% -200% -100% 0% 100%
0.0 0.5 1.0
TP Removal
Efficiency
Cumulative Frequency Total Phosphorus
All TP Field Data (n=34) Commercial Parking (n=6) Residential (n=6) -400% -300% -200% -100% 0% 100%
0.0 0.5 1.0
ortho-P Removal
Efficiency
Cumulative Frequency Orthophosphate
All ortho-P Field Data (n=17) Commercial Parking (n=5) Residential (n=7)
All Systems Influent All Systems Effluent INF No ISR EFF No
ISR
INF ISR EFF ISR
0.1 1 10
TN Concentration
(mg/L)
11
Figure 7. Box-and-Whisker Plots for Total Nitrogen from the Bioretention Database.
Figure 8. Box-and-Whisker Plots for Nitrate from the Bioretention Database.
Compost and Leaching Potential
A number of studies have shown compost to leach both nitrogen and phosphorus, and several standards have been put forth to reduce leaching potential. A study of compost-amended soils by Pitt et al. (2001), using different types of compost to amend glacial till soils in Washington state, demonstrated significant leaching of nutrients from compost. While the 2:1 mixtures of soil to compost provided some benefits for biofiltration systems, such as increased infiltration rates, runoff volume capture and metals and toxicity removal, concentrations of nutrients increased on the order of 5 to 10 times over non-amended soils (Pitt et al. 2001).
A study of green roofs indicated the filter media used was a source of TN and TP (Hathaway et al. 2008). The filter media included 15% composted cow manure. The 2010 Regional
Bioretention Soil Guidance Technical Memorandum for San Francisco Bay Area recommends avoiding the use of biosolids or manure composts due to their higher leaching potential for bio-available phosphorus (Stromberg 2010). This guidance document recommends using only yard, plant, or food waste composts certified through the US Composting Council (USCC) Seal of Testing Assurance (STA) program. It also recommends use of compost with a C:N ratio between 15:1 and 25:1 for the sake of plant health and minimization of nutrient leaching. It emphasizes the importance of using a stable compost for minimizing nutrient leaching, particularly nitrogen spikes (Stromberg 2010).
Leaching of both nitrogen and phosphorus occurred in columns studied by Hatt et al. (2007). Mixes used in that study included several amendments to sand and loam, including vermiculite, perlite, compost and mulch. While the phosphorus leaching was fairly consistent during the wet and dry periods through which the columns were run, effluent nitrogen concentrations spiked following dry periods, indicating that aerobic processes between storm events can make nitrogen available for leaching (Hatt et al. 2007). Hatt et al. (2007) describe this as “partly processed”
All Systems Influent All Systems Effluent INF No ISR EFF No
ISR
INF ISR EFF ISR
0.01 0.1 1 10
NO3 Concentration
(mg/L)
12
nitrogen, meaning it has undergone aerobic transformations to leachable oxides, i.e. nitrification, which is desirable if time and anaerobic conditions are also present to complete the process of denitrification to transform these nitrogen species to nitrogen gas so that it may escape into the atmosphere.
Another study showed that higher temperatures produced the most leaching, although they warn that the vegetation in the columns of the study had minimal time for establishment and may therefore have had limited uptake effect (Blecken et al. 2007).
Some are using peat or wood chips alone as a source of organic matter. Some WTR have some of the benefits that compost provides, including organic matter and adsorptive properties. The use of compost in bioretention systems is still a topic of debate among stormwater researchers and professionals.
Isotherm Models for P Sorption
Many past studies have used the Langmuir phosphorus adsorption maximum (Pmax) to predict the capacity of WTR to adsorb phosphorus (Dayton and Basta 2005; Dayton et al. 2003; Novak and Watts 2004; Sakadevan and Bavor 1998). While much effort has been spent on fitting the Freundlich isotherm model to P sorption data and many researchers declaring it as the best fit of the data (Kinniburgh 1986; Mead 1981; Sakadevan and Bavor 1998; Sansalone and Ma 2009), inherent concerns with broader applications of this model have led to it rarely being used to predict P sorption capacity of materials. The Langmuir models single layer adsorption, while the Freundlich is an empirical model of multilayer adsorption. According to Dayton et al. (2003), the Freundlich adsorption capacity parameter (K) is useful for comparison only if the materials have similar values of n, the unitless adsorption intensity parameter. Kinniburgh (1986) cautions that the Freundlich model may overestimate P adsorption if applied to concentrations outside the observed concentration range. According to Kinniburgh (1986), nonlinear least squares (NLLS) methods are best for fitting isotherm models, including the Langmuir and Freundlich models. Analyzing P sorption data from a separate study (Bache and Williams 1971), Kinniburgh (1986) states that the Langmuir is a poor fit and Freundlich is preferable, though he emphasizes the issue of concentration range. In comparison with the Langmuir and Temkin models, Freundlich was determined to be the most suitable model for soils used in Mead’s study (1981). Mead suggests that if using the Freundlich isotherm model, native adsorbed phosphate should be estimated and included with the sorption data (1981). In analyzing isotherm data with the linear Langmuir equation, Novak and Watts (2004) subtracted the total phosphorus (TP) measured in soil tests of WTRs from the equilibrium concentrations as a correction before analyzing the data to determine a Pmax value.
13
Correlating Al
oxand Fe
oxto P Sorption
The oxalate extractable Al and Fe content describes the amorphous oxides of Al and Fe (Sakadevan and Bavor 1998). These are most reactive with phosphorus for sorption. Oxalate Extraction of Al, Fe, and P and the ratio of Al and Fe to P may be used to indicate the P sorption capacity (PSC) of materials (Dayton and Basta 2005; Dayton et al. 2003; Elliott et al. 2002; O’Neill and Davis 2012a; Sakadevan and Bavor 1998).
Dayton et al. (2003) recommended estimating P sorption for field application based on either the Langmuir Pmax value or Alox, which were found to be correlated. This would mean at minimum either running an adsorption isotherm batch test or a soil test including oxalate extraction of Al. Some soil labs will run a Mehlich 3 extraction as part of typical soils tests rather than oxalate extraction. Mehlich 3 extraction is another estimate of amorphous aluminum. Mehlich 3 extractions may be used to estimate the Phosphorus Saturation Index (PSI), which is the ratio of oxalate extractable phosphorus to oxalate extractable aluminum and iron in a material (Tom Buob, personal correspondence). Dayton et al. (2003) did not observe correlation between any of the WTR Feox content and P sorption capacity. However, it must be noted that the Feox content was at least an order of magnitude lower than the Alox content of nearly all of the 21 WTR used in this study, not unlike the Durham WTR.
Modeling P sorption data for several different adsorbents (soils, slags and zeolite), Sakadevan and Bavor found that the Freundlich isotherm equation was a better model overall, although for some materials the Langmuir equation modeled the P adsorption of the material as well or better (Sakadevan and Bavor 1998). Sakadevan and Bavor show that P adsorption (taken as the Pmax value from the Langmuir isotherm model) is well correlated to Alox and to the combined Alox and Feox. Correlation was also high between maximum P adsorption and total Al, total Fe, or total Al + Fe content (Sakadevan and Bavor 1998).
Dayton and Basta (2005) used the Langmuir Pmax value of WTR and assessed its relationship to oxalate extractable Al in WTR, proposing the oxalate extraction method as a simpler approach to predicting P sorption capacity. They tested both the oxalate extraction method and the sorption isotherm method in order to strengthen the relationship between Pmax and Alox. They recommend a solution to WTR ratio of 100:1 for the oxalate extraction method and crushing WTR to < 150 microns (No. 100 sieve) for the isotherms (Dayton and Basta 2005).
Competing Ions, Aluminum Leaching Potential, and pH
One concern about the addition of aluminum-based WTR to bioretention soil mixes is the
14
Sansalone and Ma (2009) used the Freundlich isotherm to model P sorption by aluminum oxide coated media (AOCM). They also examined the effect of competing ions on P sorption, and determined that the difference in P sorption for a solution with 5 mg/L of nitrate versus none was statistically insignificant, while addition of sulfate did reduce P sorption (Sansalone and Ma 2009). The present study used runoff collected at the UNHSC field testing site in all laboratory studies to assure the presence of typical competing ions in all experiments.
Impact of WTR Aging
McLaughlin et al. (1981) found that P sorption ability decreased with aging of Al-containing materials, while drying of Fe-containing materials at 80oC produced a similar effect. This suggests that since the WTR in my experiments were dried, the Fe content in the WTR, which is already low compared to the Al content, is likely rendered completely useless, at least in
comparison to the Al content. However, drying does not seem to have an effect on the Al
crystallinity, which impacts reactivity (McLaughlin et al. 1981). When considering Al content, it is important to consider a possible decrease in PSC in older WTR.
WTR and Nitrogen
While the focus of WTR additions to soils has been P removal, Gallimore et al. attributed the high cation exchange capacity (CEC) of their ABJ WTR with adsorption of NH4-N. Their WISTER WTR had a much lower CEC than ABJ and did not show significant N removal of any kind. WTR were air-dried prior to application (Gallimore et al. 1999). Gallimore et al. refer to Freundlich K values from Peters and Basta to explain the comparative results of the two WTR used in this land application study (Gallimore et al. 1999).
Extrapolating Isotherm Data to Field Application
15
METHODS AND MATERIALS
Experimental Design
The experimental side of this project consisted of two major phases: a laboratory phase and a field phase. The laboratory phase focused on the design of a bioretention soil mix (BSM) for phosphorus adsorption. The field phase of the project consisted of design, construction, and monitoring of a modified bioretention system with WTR-amended filter media and internal storage reservoir structural design. Table 1 summarizes the experiments undertaken for this project and the goals of each. Batch equilibrium experiments and column studies were expanded to include several phases each in order to meet the goals of this project. Adsorption kinetics studies determined the equilibration time necessary for batch equilibrium isotherm studies. Isotherm models allow for determination of a phosphorus sorption capacity (PSC) of materials, assuming that batches reach equilibrium and maintain constant temperature. The purpose of these experiments was to expand the characterization of bioretention soil mix (BSM) materials beyond that provided by soil tests. Column studies were performed to assess the filtration performance of BSMs.
16
Table 1. Summary of Experiments.
Experiment Purpose
Soil Tests Pre-characterization of filter media constituents and mixes
Batch Kinetics Studies Equilibration time for batches of nutrient spiked runoff mixed with:
Phase 1 Filter media constituents (<74 µm grain size)
Phase 2 Large (<2mm) grain size WTR
Phase 3 Other WTR samples; time steps added
Batch Equilibrium Isotherm Studies Sorption capacity for batches of nutrient spiked runoff mixed with:
Phase 1 Filter media constituents
Phase 2 Filter media mixtures (BSMs)
Column Studies Removal effectiveness of filter media
Phase 1 Columns with dewatered WTR-amended filter media; long
term nutrient loading (45 years)
Phase 2 Duplicate columns with raw WTR-amended filter media; long
term nutrient loading (45 years)
Phase 3 Short and long term nutrient loading (1-2 years up to 20 years); expanded filter media selection
Field Monitoring Removal effectiveness of modified bioretention system
A solution of stormwater runoff harvested from the distribution box at the UNH Stormwater Center was used for all laboratory water quality experiments. A summary of constituents in the runoff is provided in Table 2. Nitrate and orthophosphate (OP) concentrations were spiked to desired levels by measured additions of the ASTM/EPA standard for nitrate nitrogen and KH2PO4 solutions. Unless otherwise noted, influent for all experiments was spiked to approximately 5 mg/L nitrate as N and 1 mg/L OP as P.
Table 2. Harvested Stormwater Runoff used as base solution for laboratory experiments.
Analyte Runoff Result Detection Limit Units
Diesel Range Organics (DRO) < 270 270 ug/L
Zinc 0.02 0.01 mg/L
Ammonia as N < 0.5 0.5 mg/L
Nitrate-N 0.3 0.1 mg/L
Nitrite-N < 0.1 0.1 mg/L
ortho-phosphate as P 0.02 0.01 mg/L
Total Phosphorus as P 0.04 0.01 mg/L
Total Kjeldahl Nitrogen (TKN) 0.7 0.5 mg/L
17
Experiments were run in UNH labs in Gregg Hall and Kingsbury Hall. Chemical analyses were performed by outside labs, while the following physical analyses were performed in house to supplement other laboratory experiments: moisture content analysis, particle size determination, density measurements, and constant head permeameter tests.
BSM Materials
The University of New Hampshire Stormwater Center (UNHSC) BSM designs have historically consisted of four materials: coarse sand, commercial loam, shredded wood chips, and food and yard waste compost. UNHSC mix designs were used as the base mix for this project. All materials came from local sources; an alternative compost provided by Agresource, Inc. was used in one experimental BSM. This compost (compost2) was a leaf and yard waste compost from Melrose, MA with low phosphorus content, compared to the typical food and yard waste compost (compost1) with high P leachability used in UNHSC bioretention systems.
18
Figure 9. WTR Lagoon at the Durham Drinking Water Treatment Plant.
The foreground is the area where WTR are dumped in the lagoon, containing the freshest WTR (WTR3); In the backgroundnear the trees is the older, drier WTR (WTR2). Photo by Robin Stone.
Figure 10. Far side of WTR lagoon at Durham Drinking Water Treatment Plant.
19
Analytical Procedures
Two external labs were used for the majority of the analyses: Agricultural Analytical Services laboratory at Pennsylvania State University (PSU) and Absolute Resource Associates laboratory in Portsmouth, NH.
Soil matrix samples were taken of each of the materials considered for use as a constituent in BSMs for this study and characterized by the Penn State lab. The materials analyzed were a coarse sand, commercial loam from LandCare, wood chips, 2 batches of compost (local food and yard waste compost and low P leaf and yard waste compost), and 4 batches of WTR all harvested from the Durham drinking water plant at various times of the year. The BSM installed in the optimized Durham bioretention system was also analyzed. For each sample, two reports were requested. The Biosolids and Septage Spreading Report includes soil pH, Mehlich 3
concentrations of Ca, Mg, K, P, Al and Fe, as well as an estimated P saturation using the ratio of Al and Fe to P (see Appendix A). The Compost Report includes SME pH, % organic matter, % nitrogen, est. C/N ratio, total Phosphorus, total Potassium, NH4-N, SME concentration, total Aluminum, Ca, Mg, Na, Cu, Fe, S, and Zn concentrations (see Appendix A).
Water matrix samples from the lab and field phases of the project were analyzed by Absolute Resource Associates in Portsmouth, NH. Lab phase samples were analyzed for orthophosphate by either the 365.3, 365.1 or the 300.0A methods and for nitrate using the 300.0A method. The 365.3 or 365.1 methods were preferred for this study due to the low detection limits (0.001 or 0.020 mg/L as opposed to the 0.01 mg/L detection limit for the 300.0A method).
Field phase samples were analyzed for the suite of contaminants, including nitrogen species, phosphorus species, sediments, and metals (see Appendix A for methods and detection limits of each analyte). All water quality samples that were reported as below detection limit (BDL) from the analytical labs were used in data analysis at values half of the method detection limit (Helsel and Hirsch 2002). That is to say, when the method detection limit for orthophosphate at ARA was 0.01 mg/L, samples that returned from the lab as BDL were entered for data analysis as 0.005 mg/L.
Batch Equilibrium Studies
Batch equilibrium studies provide information on the phosphorus sorption capacity (PSC) of materials for this project. These studies were conducted at room temperature (20-25oC) in Gregg Hall and Kingsbury Hall labs on the University of New Hampshire main campus. Each batch consisted of a) 100 mL of natural stormwater collected from the Distribution Box at the UNH Stormwater Center and spiked with phosphate and nitrate standard solutions to approximately 1 mg P/L of OP and 5 mg N/L of nitrate, and b) a mass amount of dried and sieved BSM or BSM constituent (sand, loam, WTR, etc.) ranging from 10 to 160 mg. Batches were placed in 250mL Erlenmeyer flasks, covered with parafilm, and shaken on a lateral shaker table at 200 rpm for a pre-determined amount of time. Samples were then taken from each batch, filtered to remove particulates, and sent to the Absolute Resource Associates (ARA) lab for analysis of
20
spring 2012, Whatman GF/F™ glass microfiber filters (0.7 micron nominal size) were used to filter samples due to their ease of use and sufficient removal of particulates. All samples were kept at 4oC until analysis by ARA.
Kinetics Studies
To determine the time to equilibrium of batches, kinetics studies were run. The first test was run in April 2011. Samples of BSM constituents (sand, loam, compost and WTR1) were each dried in a low oven, crushed, and sieved past a No. 200 sieve (74 µm). Each of the four samples was measured out in 100 mg aliquots and mixed with 100 mL of spiked stormwater in a 250 mL flask, then shaken for varied amounts of time. A batch of each material was removed from the shaker table and sampled at set time steps of 1, 2, 4, 6, 8, 18, 24, and 48 hours. A second kinetics study was run in September of 2011 on WTR2 only. These samples were crushed and sieved past a No. 10 sieve (2 mm), thus the nominal grain size was more than an order of
magnitude larger. An additional time step at 60 hours was added for this second study. The final kinetics study was run in January 2012 with both the second and third batches of WTR (WTR2 and WTR3), following the same procedure as in April 2011, with the exception of some alteration to time steps: 2, 4, 8, 18, 24, 36, 48, 72, and 96 hours.
Isotherm Studies
Adsorption isotherms consist of batches of varied mass amounts of material mixed with spiked stormwater. The procedure for the isotherm study mimics that for the kinetics study, with the variation in mass amount of material, rather than variation in time step. Having established 48 hours as a conservative estimate of time to equilibrium from the kinetics study, all batches in the isotherm study were shaken for 48 hours, again at 200 rpm. For each BSM or BSM constituent, a batch was made for each of the following mass amounts of material: 10, 40, 70, 100, 130, and 160 mg. Each of these were mixed with 100 mL of spiked stormwater in a 250 mL Erlenmyer flask and shaken. The first set of isotherms ran in April 2011 on BSM constituents: sand, loam, compost, WTR1. The second set ran in January 2012 on WTR2 and WTR3. The final isotherm study in May 2012 ran on BSMs themselves. The BSMs were mixed in the highbay on a % volume basis with materials in raw form (i.e., no processing, such as freeze/thaw processing, drying or sieving). Post-mixing, a sample was taken of each and dried and sieved, just as were the constituents for previous studies.
Column Studies
Permeameter Tests
21
Column Setup
Columns consisted of 3 foot long clear PVC pipe sections, with inner diameter (ID) of 1.75 inches for the phase 1 column tests, and ID of 1.5 inches for phases 2 and 3. Each column was capped with a rubber plumbing cap, with a hole drilled into it for influent/effluent tubing to fit into it. Influent was delivered to the columns by way of a multichannel peristaltic pump (phases 2 and 3), capable of delivering influent to 5 different columns at the same rate at the same time. Overflow drains were drilled into the side of each column approximately 6 inches above the top of the filter media. This allowed the influent to pond without overflowing the column and maintained a mostly constant head throughout each simulated event. During column phase 1, influent was delivered by way of adjustable gravity feed tanks and somewhat consistent ponding was maintained by manual adjustments to each feed tank. No overflow drains were used in phase 1, and consistency of ponding proved difficult to maintain.
All columns were packed with 2-3 inches of pea gravel at the bottom, followed by 24 inches of BSM. With each 6 inches of BSM loaded into the column, it was compacted, with either a drop of a PVC pipe with rubber stopper on the end from a 12 inch height or by knocking the bottom of the column against the stabilizing board several times to cause settling. For Column Phase 1, rubber rings were inserted at approximate depths of 4 and 14 inches below the top of BSM in the columns to keep water from routing along the sidewalls of the columns. For Column phase 2 and 3, no rings were used, and columns were fitted with an overflow drain at approximately 6 inches above the top of the BSM, in order to keep a more consistent head on the system during simulated rainfall events. Simulated rainfall events consisted of loading columns with spiked stormwater runoff as the influent.
Stormwater runoff from the West Edge parking lot at UNH was collected at the distribution box of the UNH stormwater center. Additions of phosphate and nitrate standard solutions raised the OP and NO3 levels to the desired concentrations for each set of experiments.
Column Sampling Regimens
Influent samples were taken and analyzed for OP and NO3 prior to each column run. Effluent sampling for phase 1 and 2 column tests consisted of collecting all of the effluent for a single simulated event, mixing it and sampling from 3.5-5.5 L of effluent. Each sample was analyzed for OP and nitrate. One sample was taken from the effluent of each column after each simulated event. During phases 2 and 3, occasional samples were taken for aluminum analysis in order to test if aluminum was leaching out due to the presence of aluminum-based WTR.
During the phase 3 column test, samples were taken directly from the effluent draining out of the columns once a predetermined volume of effluent had accumulated.
22 =
Equation 5. Column Infiltration Rate Estimation
where Q = infiltration rate (mL/min), VEFF = volume of effluent (mL), and t = time step for collection of given volume of effluent (min).
Given an empty bed volume of 811 mL in phase 1 (due to larger cross-sectional area of columns in this phase) and 695 mL in phases 2 and 3, empty bed contact time was calculated using the infiltration rate data for each sample:
=
Equation 6. Empty Bed Contact Time
where EBCT = empty bed contact time (min) and BV = bed volume (mL).
Hydraulic and Nutrient Loading
The total hydraulic load to each column during phases 1 and 2 was approximately equivalent to the mean annual rainfall over the course of a year in seacoast New Hampshire (46 inches), assuming a ratio of 20:1 for the drainage area to filter area; this is a typical ratio for bioretention design. The filter area in the case of the columns is the cross-sectional area of the columns. Multiplying that by a factor of 20 and by the 46 inches of rain provides the volume to be delivered to each column for a year of hydraulic load. The actual influent delivered was less than intended due to a failure of the system to deliver the entire prepared influent amount. Losses during phase 1 were large, amounting to a loss of about 8 inches of total simulated rainfall; whereas, losses during phase 2 amounted to only about 1 inch.
The load was delivered in five events for Phase 1 and in seven events for Phase 2, with 24 hours between the start times of each event. Stormwater harvested from the UNHSC West Edge facility distribution box was spiked to 1 mg P/L of OP and 5 mg N/L of nitrate. Therefore, the nutrient load to the columns is much higher than a one year load. Based on influent data from the Durham bioretention system monitoring, expected orthophosphate (OP) concentration is considered to be 0.02 mg/L for this project. Based on this expected average value for 46 inches of annual rainfall, each event amounted to about 9 years of OP loading in phase 1 and 6.5 years of loading in Phase 2. All columns in phases 1 and 2 were loaded with a total of about 45 years of OP load each.
23
The secondary goal of phase 3 was to verify isotherm models by running the columns to
breakthrough, at which time the adsorptive properties of the BSM may be considered exhausted. Therefore, future runs in Phase 3 used stormwater spiked to 1 mg/L of OP and 5 mg/L of nitrate as in the previous column study phases, higher concentrations allowing breakthrough to be achieved more quickly. The columns were allowed to sit for 5 days before longterm loading began. Samples were taken after the equivalent of 2 years of nutrient loading up to the 20 year nutrient load level. Although all column influent was spiked for both orthophosphate and nitrate, phase 3 column samples were only analyzed for orthophosphate, because media composition is believed to have little effect on nitrate removal, as was confirmed by phase 1 and 2 nitrate results.
Column Contents
When designing a bioretention soil mix (BSM), it is necessary to consider several factors related to its infiltration rate and ability to serve as a filter. The water quality volume is the volume of runoff that the system is expected to treat, and a system must be large enough and/or infiltrate quickly enough to capture and treat that volume. Bioretention systems are typically expected to drain down within 24 hours of a storm, meaning that the infiltration rate is high enough that no water is left ponding after 24 hours. These considerations must be weighed against the
components and contact time necessary to effectively remove contaminants. The UNHSC typically uses a 50% sand mix to provide a high infiltration rate without negatively impacting the vegetation in the system. Native plants commonly used in bioretention systems cannot thrive in a soil that is too sandy. A tree filter is essentially a small bioretention system with a single tree as its only vegetation. Due to its smaller size and not needing to keep many bushy plants alive, these systems typically have a much higher percentage of sand in an effort to infiltrate runoff more quickly, while still effectively filtering out contaminants.
The composition of mixes used in each of the column studies is provided in Table 3, with percentages on a volume/volume (v/v) basis. A typical tree filter mix of 80% sand and 20% compost was altered to replace a quarter of the compost portion with WTR (TF.05), giving this mix an overall 5% v/v ratio of WTR in phase 1 of column studies. Tree filter mixes in phases 2 and 3 increased the WTR volume ratio to 10% of the mix. The typical UNH Stormwater Center BSM is 50% sand as stated above, 20% compost, 20% wood chips, and 10% loam. The BSMs used in the columns contained varied amounts of WTR and compost. Still working with the 20% compost, 5-15% of the overall mix were replaced with WTR. Different batches of WTR were used in the BSMs for phases 1, 2, and 3. The mixes are identified by the type of mix and percentage of WTR in the mix (see Table 3). The tree filter mix is considered a BSM but is identified by the initials TF to distinguish it from other mixes with the same percentage of WTR. Phase 2 columns were run in duplicate.
24
Table 3. Composition of Bioretention Soil Mixes for Column Studies.
Phase 2 mixes were run in duplicate, with the designation of “-1” or “-2” after each mix name. Compost1 is the local compost generally used. Compost2 is a certified compost from Melrose, MA with lower Mehlich 3 P content than standard compost. WTR1 was frozen and decanted. WTR2 was air and sun-dried in the lagoon over the summer. WTR3 was fresh sludge.
Name Description Sand Wood Chips Loam Compost1 Compost2 WTR1 WTR2 WTR3
Phase 1
TF.05 Tree Filter Mix w/5% WTR 80% 15% 5% BSM.05 BSM w/5% WTR 50% 20% 10% 15% 5% BSM.10 BSM w/10% WTR 50% 20% 10% 10% 10% BSM.15 BSM w/15% WTR 50% 20% 10% 5% 15% RG.05 Rain Garden Mix w/5% WTR 43% 43% 9% 5%
Phase 2
TF.10-1/2 Tree Filter Mix w/10% WTR 80% 10% 10% BSM.05-1/2 BSM w/5% WTR 50% 20% 10% 15% 5% BSM.10-1/2 BSM w/10% WTR 50% 20% 10% 10% 10% BSM.15-1/2 BSM w/15% WTR 50% 20% 10% 5% 15%
Phase 3
BSM 1 No Compost BSM 50% 20% 20% 10%
BSM 2 Low P Compost BSM 50% 20% 10% 10% 10% BSM 3 Durham Bio (BSM w/10% WTR) 50% 20% 10% 10% 10%
BSM 4 Tree Filter Mix w/10% WTR 80% 10% 10% BSM 5 Control (No WTR) 50% 20% 10% 20%
BSM 6 BSM w/5% WTR 50% 20% 10% 15% 5%
BSM 7 BSM w/10% WTR 50% 20% 10% 10% 10%
25
Data Analysis Methods
Isotherm Model Fitting
For each BSM or BSM component sample (adsorbents), six isotherm batches were equilibrated, one with each sediment mass amount (M= 10, 40, 70, 100, 130, or 160 mg). Data points were calculated for q, the equilibrium adsorbent phase concentration of OP in mg P/g adsorbent, given the known volume (V= 100mL) of spiked stormwater, mass of sediment (M), starting adsorbate phase concentration (C0~1mg/L) of OP in solution and the measured equilibrium concentration of OP in solution (C, mg/L). The observed values (qO) were calculated as in Crittenden et al. (2005):
q = V
M(C − C)
Equation 7. Observed Adsorbent-Phase Concentration
The Langmuir isotherm models a single layer adsorption process with the equation:
q = Q bC 1 + bC
Equation 8. Langmuir-Modeled Adsorbent-Phase Concentration
26 C
q = 1 bQ +
C Q
Equation 9. Linearized Langmuir Equation
where 1/(bQM) is the intercept and 1/QM is the slope of a line plotting C against C/q. Linear regressions were performed on the data for each sediment sample, and the parameters b and QM were calculated. These parameters were then used to calculate equilibrium adsorbent-phase concentration of OP (q, mg P/g adsorbent) using Equation 7 for each equilibrium concentration of OP in solution (C, mg P/L). These are the Langmuir predicted values (qL) for the statistical analysis.
The Freundlich isotherm model is an empirical equation used to describe multi-layer adsorption:
q = KC /
Equation 10. Freundlich-Predicted Adsorbent-Phase Concentration
where qF= equilibrium adsorbent-phase concentration of OP modeled by Freundlich, mg P/g adsorbent, K= Freundlich adsorption capacity parameter, (mg/g)(L/mg)1/n ; 1/n= Freundlich adsorption intensity parameter, unitless. The base 10 logs of equilibrium concentration of OP in solution (C, mg P/L) and equilibrium adsorbent-phase concentration (qO, mg P/g sediment) are plotted against one another, and a linear regression performed, yielding the transformed
equation:
log(q ) = log(K) + 1
n log(C)
Equation 11. Linearized Freundlich Equation
From the linear regression, the Freundlich parameters are determined, using K=10^intercept and 1/n=slope. These parameters are used to calculate the equilibrium adsorbent-phase concentration of OP (qF, mg P/g adsorbent) using Equation 10 to provide the predicted values for the
Freundlich model.
Statistical Analysis of Isotherm Models
Several measures are used to assess the fit of the two isotherm models to the data. First, the R-square values of each of the best fit lines to the isotherm data for each model was assessed. Next, a series of model assessment measures, comparing observed and modeled values, proposed by Willmott (1982) were used to further assess the models.
27
Difference measures reported include the mean absolute error (MAE) and the root mean square error (RMSE), which summarize the mean differences between observed values and modeled values of each of the models. They were calculated for this study as in Willmott (1982):
MAE =1
N |M − O |
Equation 12. Mean Absolute Error
RMSE = 1
N ( M − O )
Equation 13. Root Mean Square Error
where N is the number of data points, Mi is the ith modeled value, and Oi is the ith observed value. The index of agreement (d) is also reported, taking the form from Willmott (Willmott 1982):
d = 1 − ( M − O ) / (| M ′| − |O ′|) 0 ≤ d ≤ 1
Equation 14. Index of Agreement
where Mi’= Mi-O and Oi’= Oi-O. The unsystematic RMSE (RMSEu) is reported and is expected to be near 0 for a good model. The systematic RMSE (RMSEs) should be near the RMSE.
Finally the Nash-Sutcliffe efficiency (N-S Eff) is reported to measure the fit of the modeled values with the observed values (Nash and Sutcliffe 1970). The efficiency is calculated as follows (Jacobs et al. 2009):
N − S Eff = 1 − ∑ (O − M ) ∑ ( O − O)
Equation 15. Nash-Sutcliffe Efficiency
where O is the mean of the observed values.
Model Verification
Removal efficiencies (RE) were calculated for each of the columns and may be compared to field data removal efficiencies to determine the ability of the column tests to predict field performance. Removal efficiency is calculated as
%RE = (1 −C
C ) × 100
28
where CINF = influent concentration (mg/L) and CEFF = effluent concentration (mg/L).
Efficiency ratios (ER) were also calculated for both column and field system data, as follows:
= −
Equation 17. Efficiency Ratio
where EMC = event mean concentration of influent, averaged over all monitored storms or simulated storms and EMC = event mean concentration of effluent, averaged over all
monitored storms or simulated storms. The ER is often more resistant to extreme values than the removal efficiency.
Summary statistics for column and field system data included approximate 95% confidence intervals. Because the data was generally nonnormal, a nonparametric method of confidence intervals about the median was used (Helsel and Hirsch 2002). The method uses the ranked data to determine the interval. Since the interval must include an actual ranked data point, the actual confidence in the interval varies (generally between 94% and 98%, depending on the size of the dataset, N). Mean, standard deviation, and coefficient of variation are also reported.
Cunnane plotting positions were used for all cumulative distribution function figures, as presented in Helsel and Hirsch (2002):
= − 0.4 + 0.2
Equation 18. Cunnane Plotting Position
29
Design of a Bioretention-Gravel Wetland Hybrid
An innovative bioretention system was designed and constructed based on the concepts of using the functional mechanisms of a gravel wetland, and replicating them in the footprint of a
standard bioretention system (Roseen et al 2011). From the surface, the system does not look any different than a standard bioretention system. However, in the subsurface it incorporates an anaerobic internal storage reservoir (ISR) in the same sense that is accomplished in a gravel wetland. Of primary significance in this design is the ISR, the long circuitous flow path, and the volume contained in the ISR. A traditional bioretention system has approximately 2 feet of vertical filter path length as it moves through the bioretention soil media prior to exiting by underdrain or exfiltration. A gravel wetland typically has at least a 30’ horizontal flowpath through the anaerobic ISR. A gravel wetland typically contains about 25% of the WQV in the ISR. This innovative system replicates this to a lesser degree. The ratio of the ISR/WQV is believed to be a crucial element of the design in that it is based on the phenomena that nitrate is heavily first flush weighted, and should wash off in the beginning of a storm event, or a small fraction of the WQV. The nitrate first flush was observed for storms of multiple sizes by Roseen et al (2006).
Two side-by-side systems were installed in a commercial parking lot on Pettee Brook Lane in Durham, NH, in summer 2011. Partners in this installation were the Town of Durham NH, US EPA Region 1, and the UNHSC.
These two systems contain the same BSM: 50% sand, 10% compost, 20% wood chips, 10% loam, and 10% WTR2 (identical to BSM.10 from column phase 2 and BSM3 in column phase 3). These two systems are known as Bio 5 with Cell 1 and Cell 2. Bio 5, and other systems, including a subsurface gravel wetland system (GW) and two standard bioretention systems (Bio-3 and Bio-4), were monitored for nitrogen and phosphorus removal.
The design of the parallel systems in Durham is nearly identical, except for the difference in the sizing of the internal storage reservoir. Cell 1 was designed to capture a drainage area of 13,400 ft2 and hold 20% of the water quality volume in the ISR. Cell 2 was designed to capture a drainage area of 17,200 ft2 and 10% of the WQV in the ISR (Figure 3). The layout and long section detail of the cells are shown in Figure 11 and Figure 12. A walkway divides the cells, which are each about 32 feet in length and 6 feet wide. UNHSC specifies a minimum 30 foot horizontal flow path in the designs for subsurface gravel wetlands to allow space and time for the denitrification process to occur in the subsurface storage reservoir. The Bio-5 cells were
designed with a minimum horizontal flow path of 22 feet in the internal storage reservoir (Figure 12). Depth of BSM in these systems is 2 feet. A 6 inch pea gravel (3/8” diameter) layer lies below the BSM to prevent migration of the BSM into the crushed stone (3/4” diameter) layer. The crushed stone layer varies between 3.32 and 3.75 feet deep in Cell 1 and only 2.08 and 2.50 feet deep in Cell 2. This layer provides the internal storage reservoir; since the outlet from the system is at the top of this layer, this layer is permanently saturated. The greater depth of the stone layer in Cell 1 provides more storage space than in Cell 2 (see also Figure 13 for the cross section).