AVAILABILITY OPTIMIZATION FOR
SCREW PLANT
BASED ON GENETIC ALGORITHM
DEEPIKA GARG*, KULDEEP KUMAR**, MEENU***
*RESEARCH SCHOLAR,DEPT. OF MATHEMATICS,N.I.T.,KURUKSHETRA ** CHAIRMAN AND PROFESSOR , DEPT. OF MATHEMATICS ,N.I.T., KURUKSHETRA ***ASST PROFESSOR , DEPT. OF MECHANICAL ENGINEERING, N.I.T., KURUKSHETRA
ABSTRACT
This paper deals with availability optimization for screw plant using genetic algorithm. Screw plant has four main subsystems, out of theses four subsystems, two subsystems are provided with cold stand by alternativeConsidering the exponential distribution for the probable failures and repairs, Mathematical formulation of the problem is done using probabilistic approach and differential equations are developed using Markov birth – death Process. These equations are then solved using normalizing conditions so as to determine the steady state availability of the concern plant.Then further genetic algorithm is applied to find optimal value for availability of concern plant and corresponding to this optimum value of availability, value of failure/repair rates of all subsystems of concern plant are calculated.
Key Words: Availability, Differential Equations, Markov Process, Genetic Algorithms. 1. INTRODUCTION
2. LITRATURE SURVEY
A lot of research has been carried out to find reliability/availability and to study the effect of failure and repair rates of different subsystems on the availability. Panagiotis 30 had Classified and calculated primary failure modes in bread production line. Panagiotis et.al.31discussed reliability and maintainability analysis of cheese (feta) production line in a Greek medium-size. Michelson 32 discussed the use of reliability technology in process industry. Garg and Kumar 33 applied matrix method to evaluate reliability for given values of failures and repair rates .But now due to increase in automation and complexity of the system, researchers are focusing to obtain the optimization of the availability of system. A lot of research has been carried out on optimization of availability of manufacturing plants subjected to some constraints by using various optimization techniques including GAs. Savic And Walter 35 reduced the cost of designing the water distribution networks by using Genetic algorithm .Coit and Smith 36developed a problem specific genetic algorithm and determine the optimal design configuration Painton And Campbell 37 showed how the GA can be applied to optimize the system reliability. Bielli And Carami 38 uses GAs for optimizing the bus networking. Summanwar et.al.39 solved the constrained optimization problem by using GAs. Tavakkoli-Moghaddam, Safari,and Sassani 40 discussedthe optimization of reliability of series parallel system with a choice of redundancy strategies.Azaron et.al.41 described Multi-objective reliability optimization for dissimilar-unit cold-standby systems using a genetic algorithm. In this paper optimum value of availability is calculated by using the genetic algorithm.
3. MATERIALS AND METHODS 3.1 MATHEMATICAL MODELLING 3.1.1. System description
The screw plant 42 mainly consists of four subsystems namely Heading Machine, Slotting Machine, Threading Machine and Polishing Machine. Initially heading machine cuts the wires into small pieces and makes the head of the screw. Then, slotting machine makes the slots on the head of the screw and put these pieces into the threading machine to make threads on the pieces. Finally the pieces are placed in the polishing machine in order to polish the screws which results the final product .
Screw plant consists of the following four main subsystems:
I. Heading machine (A) consists of two units, one working and the other is in cold standby. The cold standby unit is of lower capacity. The system works on standby unit in reduced capacity. Complete failure occurs when both units fail.
II. Slotting machine (B) consists of one unit. The system fails when this subsystem fails.
III. Threading machine (C) consists of two units, one working and the other is in cold standby. The cold standby unit is of lower capacity. The system works on standby unit in reduced capacity. Complete failure occurs when both units fail.
IV. Polishing machine (D) consists of one unit. It is subjected to major failure only. 3.1.2 ASSUMPTIONS AND NOTATIONS
I. Repair rates and failure rates are negative exponential and independent of each other. II. Not more than one failure occurs at a time.
III. A repaired unit is, performance wise, as good as new. IV. The subsystems A and C fail through reduced states.
V. Switch-over devices are perfect.
A, B, C, D : Capital letters are used for good states. A , C : Denotes the reduced capacity states. a, b, c, d : Denotes the respective failed states.
αi : Indicates the respective mean failure rates of Heading machine, Slotting machine, Threading machine & Polishing machine, i = 1,2,3,4,5,6. i = 2 and 5 stand for failure rates of reduced states of A and C respectively. βi : Indicates the respective repair rates of Heading machine, Slotting
machine, Threading machine & Polishing machine, , i = 1,2,3,4,5,6. i = 2 and 5 stand for repair rates of reduced states of A and C respectively. pi(t) : Probability that the system is in ith state at time t.
Based upon above assumption and notation, transition diagram (figure 1) is prepared which represents the transition form one state to another state.
Mathematical equations,[1] to [8] , are developed by applying markov-birth death process to each state one by one out of 16 sates of transition diagram as explained by garg et.al.[42]
1
'( ) (
1 3 4 6) ( )
1 1 2( )
3 5( )
4 3( )
6 6( )
p t
p t
p t
p t
p t
p t
2
'( ) (
2 3 4 6 1) ( )
2 2 7( )
3 8( )
4 4( )
6 9( )
1 1( )
p t
p t
p t
p t
p t
p t
p t
3
'( ) (
1 3 5 6 4) ( )
3 1 4( )
3 10( )
5 11( )
6 12( )
4 1( )
p t
p t
p t
p t
p t
p t
p t
4 2 3 5 6 1 4 4 2 13 3 14 5 15
6 16 1 3 4 2
'( ) (
) ( )
( )
( )
( )
( )
( )
( )
p t
p t
p t
p t
p t
p t
p t
p t
1'( )
( )
( )
5,6;
3, 6
i j i j
p t
p t
p t
i
j
[4] [2] [3] [5] Figure 1: Transition diagram of Screw PlantWorking at reduced capacity Working at full capacity
Failed State
ABCD 1
ABCD 3 ĀBCD 2
ABCd 12 AbCD 5 ĀBCd 9 β3 α6 β3 β4
β1 β3
α3 β2 α2 β6 ĀbCD 8 aBCD 7
β 6
α 6
ABCd 6 β6 α5 β5 α6 β4
α1 β α4
1 β6
ĀBCD 4
α6 α3
β3 α5 α2 β2 β5 α3 α 3
α4 α1
ABcd
11 AbCD
2
'( )
( )
( )
7,8,9;
2,3,6
i j i j
p t
p t
p t
i
j
3'( )
( )
( )
10,11,12;
3,5, 6
i j i j
p t
p t
p t
i
j
4'( )
( )
( )
13,14,15,16;
2,3,5, 6
i m i m
p t
p t
p t
i
m
The screw plant is required to be available for long duration of time. So, the long run or steady state probability of the system is obtained by putting
d
dt
0
andp t
i
( )
p
i
ast
in equations [1] to [8]. The values of steady state probabilities are obtained by solving [1] to [8] recursively,in terms of p1 as follows: 42.2 1 1
p
k p
p
3
k p
2 1p
4
k p
3 1p
5
k p
4 16 5 1
p
k p
p
7
k k p
6 1 1p
8
k k p
4 1 1p
9
k k p
5 1 110 4 2 1
p
k k p
p
11
k k p
7 2 1p
12
k k p
5 2 1p
13
k k p
6 3 114 4 3 1
p
k k p
p
15
k k p
7 3 1p
16
k k p
5 3 1Where 2 1
1
x
k
x
2
1 1 1 4 4 1 1 4 4 1 4 4
x
2
2 4 1 1 1 1 4 1
x
1 4 1
2
4
(
k
)
k
1 4 2 4
3
1
((
)
k
)
k
3 6 2 5
4 5 6 7
3 6 2 5
,
,
,
k
k
k
k
The probability
p
1 is determined by using normalizing condition i.e. 16 11
i ip
1
(1
1 2 3 4 5 4 1 5 1 6 1 4 2 7 2 5 2 6 3 4 3 7 3 5 3) 1
p
k
k
k
k
k
k k
k k
k k
k k
k k
k k
k k
k k
k k
k k
1 1
*
1
1
p N
p
N
Where1 2 3 4 5 4 1 5 1 6 1 4 2 7 2 5 2 6 3 4 3 7 3 5 3
1/ (1
)
N
k
k
k
k
k
k k
k k
k k
k k
k k
k k
k k
k k
k k
k k
Now, the steady state availability (Av)of the screw plant is given by
1 2 3 4
V
A
p
p
p
p
1 1 1 2 1 3 1
V
A
p
k p
k p
k p
1
(1
1
2
3)
V
A
p
k
k
k
1 *(1 1
2
3)
V
A
N
k
k
k
Where
[7] [6]
1 2 3 4 5 4 1 5 1 6 1 4 2 7 2 5 2 6 3 4 3 7 3 5 3
(1
)
N
k
k
k
k
k
k k
k k
k k
k k
k k
k k
k k
k k
k k
k k
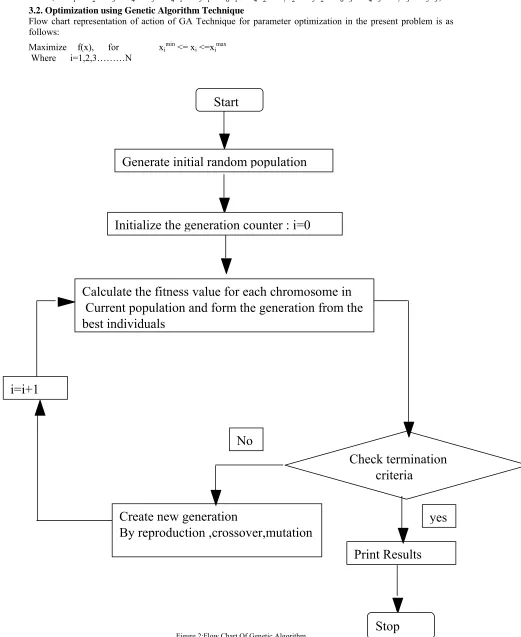
3.2. Optimization using Genetic Algorithm Technique
Flow chart representation of action of GA Technique for parameter optimization in the present problem is as follows:
Maximize f(x), for ximin <= xi <=ximax Where i=1,2,3………N
Figure 2:Flow Chart Of Genetic Algorithm
Check termination
criteria
Generate initial random population
Initialize the generation counter : i=0
Calculate the fitness value for each chromosome in
Current population and form the generation from the
best individuals
yes
No
Print Results
Create new generation
By reproduction ,crossover,mutation
i=i+1
3.3. Availability optimization using genetic algorithm
Problem definition Find maximum value of availability
A
V
1 *(1 1 2
N
k
k
k
3)
Where1 2 3 4 5 4 1 5 1 6 1 4 2 7 2 5 2 6 3 4 3 7 3 5 3
(1
)
N
k
k
k
k
k
k k
k k
k k
k k
k k
k k
k k
k k
k k
k k
and Where
2
4 1 1 1 1 4 1
2 1
1 1 4 4 1 1 4 4 1 4 4
k
1 4 1
2
4
(
k
)
k
1 4 2 4
3
1
((
)
k
)
k
3 6 2 5
4 5 6 7
3 6 2 5
,
,
,
k
k
k
k
Bounds of variables are
1. 0.001≤
1≤0.09 2. 0.0001≤
2≤0.09 3. 0.004≤
3≤0.05 4. 0.0004≤
4≤0.01 5. 0.002≤
5≤0.05 6. 0.005≤
6≤0.03 7 0.01≤
1≤1 8 0.002≤
2≤0.5 9 0.04≤
3≤0.5 10 0.002≤
4≤0.09 11 0.05≤
5≤0.9 12 0.07≤
6≤1 Element of a input vectors are
1, , , , , , , , , , ,
2 3 4 5 6 1 2 3 4 5 6
The performance optimization of the screw plant is highly influenced by the failure and repair parameter of each subsystem. These parameter ensure high performance of the screw plant. Genetic algorithm is here by proposed to coordinate the failure and repair parameters of each subsystem for stable system performance i.e. high availability .Here number of parameter are twelve(six failure parameter ,six repair parameter) .The design procedure is described as follows.
Availability is considered as fitness function .The roulette wheel selection procedure was used for the reproduction for selecting the members of next generation. The cross-over probability was randomly varied from 0.30 to 0.90..The mutation probability in each of cycle of generation was fixed at 0.01
specify the computed simulation more precisely ,trial set are also chosen for genetic algorithm and system parameter.
4.Results and discussions
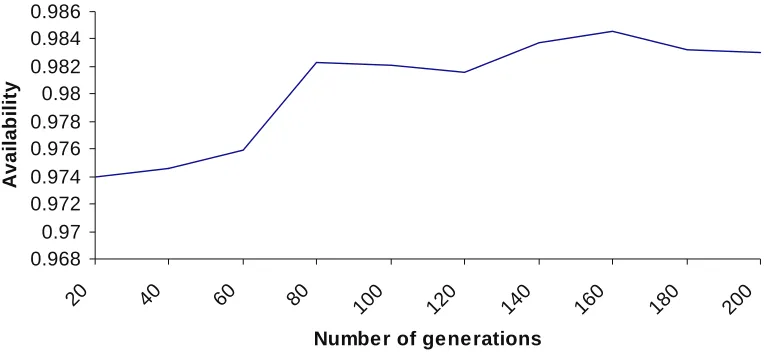
The simulation is done to the maximum number of generation, which is varying from 20 -200.Effect of number of generation is shown in Table 1 and figure 1.1 .The optimum value of system’s performance is 98.46% for which best possible combination of failure repair rate is
1 2 3 4 5 6
1 2 3 4 5 6
0.0011,
0.9965,
0.0009,
0.4990,
0.0041,
0.4977
0.0012,
0.0023,
0.0021,
0.0023,
0.0051,
0.9996
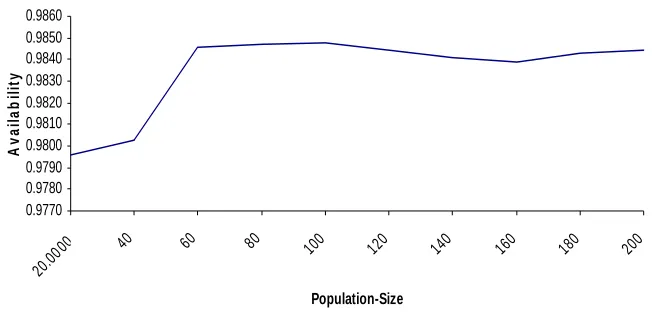
The simulation is done up to the maximum number of population ,which is varying from 20 -200.Effect of number of generation is shown in Table 2 and figure 2.1.The optimum value of system’s performance is 98.48% for which best possible combination of failure repair rate is
1 2 3 4 5 6
1 2 3 4 5 6
0.0027,
0.001,
0.0058,
0.0004
0.0025,
0.0050,
0.9922,
0.4993,
0.4963,
0.0037,
0.8984,
0.9968
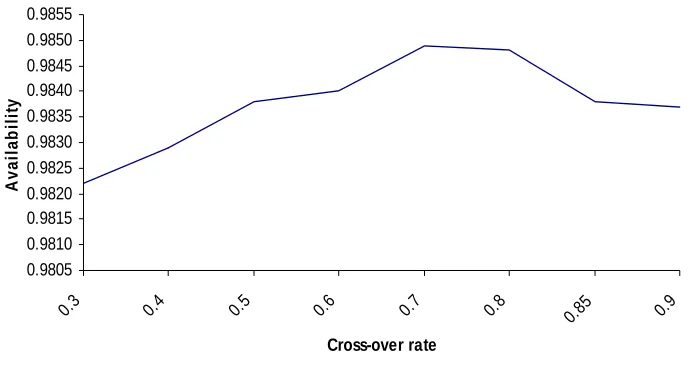
The simulation is done upto the maximum rate.of cross-over ,which is varying from 0.30 to 0.90.effect of number of generation is shown in table 3,figure 3.1.The optimum value of system’s performance is 98.49% for which best possible combination of failure repair rate is
1 2 3 4 5 6
1 2 3 4 5 6
0.0017,
0.0014,
0.0048,
0.0010
0.0021,
0.0054,
0.9973,
0.4947,
0.4973,
0.0092,
0.8684,
0.9953
Table1:Effect of Number of Generation on Availability of Screw Plant (mutation probability=0.01,population size=60,cross-over probability=0.4)
S.NO α4 µ4 α5 µ5 α6 µ6
1 0.0036 0.0065 0.0055 0.0065 0.0051 0.9359 2 0.0016 0.0206 0.0036 0.0206 0.0076 0.9310
3 0.0030 0.0130 0.0076 0.0130 0.0050 0.9396
4 0.0010 0.0054 0.0039 0.0054 0.0052 0.9656
5 0.0007 0.0026 0.0025 0.0026 0.0053 0.9482 6 0.0006 0.0055 0.0028 0.0055 0.0064 0.9811 7 0.0010 0.0052 0.0025 0.0052 0.0051 0.9987 8 0.0012 0.0023 0.0021 0.0023 0.0051 0.9996
9 0.0013 0.0032 0.0023 0.0032 0.0052 0.9852
10 0.0010 0.0027 0.0025 0.0027 0.0059 0.9793
S.NO No.of Generation
Avalability α1 µ1 α2 µ2 α3 µ3
1 20 0.9740 0.0147 0.9998 0.0101 0.3392 0.0040 0.4781
2 40 0.9746 0.0029 0.9683 0.0341 0.4922 0.0065 0.4852
3 60 0.9759 0.0209 0.9927 0.0007 0.4733 0.0059 0.4928
4 80 0.9823 0.0015 0.9660 0.0041 0.4846 0.0041 0.4987
5 100 0.9821 0.0013 0.9289 0.0011 0.4892 0.0044 0.4975
6 120 0.9816 0.0034 0.9375 0.0056 0.4943 0.0044 0.4973
7 140 0.9837 0.0127 0.9981 0.0031 0.4944 0.0043 0.4989
8 160 0.9846 0.0011 0.9965 0.0009 0.4990 0.0041 0.4977
9 180 0.9832 0.0028 0.9909 0.0006 0.4989 0.0046 0.4996
0.968 0.97 0.972 0.974 0.976 0.978 0.98 0.982 0.984 0.986
20 40 60 80 100 120 140 160 180 200
Number of generations
A
v
a
ila
b
ili
ty
Figure 1.1: Effect of Number of Generation on Availability of Screw Plant
Table2 :Effect of Population Size on Availability of Screw Plant (mutation probability=0.01,Generation 160=,cross-over probability=0.4) S.NO Population
size Availability
α1 µ1 α2 µ2 α3
1 20 0.9796 0.0109 0.0012 0.0050 0.0021 0.0025 2 40 0.9803 0.0019 0.0046 0.0040 0.0009 0.0039 3 60 0.9846 0.0011 0.0009 0.0041 0.0012 0.0021 4 80 0.9847 0.0012 0.0005 0.0050 0.0005 0.0022 5 100 0.9848 0.0027 0.0010 0.0058 0.0004 0.0025 6 120 0.9844 0.0015 0.0003 0.0040 0.0008 0.0023 7 140 0.9841 0.0011 0.0005 0.0041 0.0006 0.0021 8 160 0.9839 0.0011 0.0005 0.0041 0.0007 0.0027 9 180 0.9843 0.0011 0.0006 0.0041 0.0007 0.0024 10 200 0.9844 0.0011 0.0006 0.0040 0.0007 0.0020
S.NO µ3 α4 µ4 α5 µ5 α6 µ6
0.9770 0.9780 0.9790 0.9800 0.9810 0.9820 0.9830 0.9840 0.9850 0.9860
20.00
00 40 60 80 100 120 140 160 180 200
Population-Size
A
v
a
ila
b
il
it
y
Figure 2.1: Effect of population size on availability of screw plant Table3:Effect of Cross-over rate on Availability of Screw plant (mutation probability=0.01,Generation 200=,population size= 160)
α3 µ3 α4 µ4 α5 µ5 α6 µ6
0.0020 0.0050 0.9974 0.4995 0.4994 0.0032 0.8963 0.9982 0.0024 0.0052 0.9903 0.4990 0.4930 0.0027 0.8830 0.9974 0.0023 0.0050 0.9789 0.4968 0.4950 0.0023 0.8840 0.9507 0.0021 0.0050 0.9985 0.4926 0.4996 0.0029 0.8852 0.9848 0.0021 0.0054 0.9973 0.4947 0.4973 0.0092 0.8684 0.9953 0.0026 0.0050 0.9956 0.4926 0.4985 0.0021 0.8843 0.9815 0.0047 0.0052 0.9809 0.4872 0.4686 0.0047 0.8998 0.9903 0.0037 0.0053 0.9917 0.4982 0.4884 0.0025 0.8661 0.9964 S.NO Cross
-Over rate Availability α1 µ1 α2 µ2 α3 µ3
1 0.30 0.9822 0.0017 0.0011 0.0040 0.0004 0.0020 0.0050
2 0.40 0.9829 0.0018 0.0003 0.0043 0.0005 0.0024 0.0052
3 0.50 0.9838 0.0022 0.0012 0.0044 0.0005 0.0023 0.0050
4 0.60 0.9840 0.0015 0.0003 0.0040 0.0005 0.0021 0.0050
5 0.70 0.9849 0.0017 0.0014 0.0048 0.0010 0.0021 0.0054
6 0.80 0.9848 0.0028 0.0003 0.0044 0.0009 0.0026 0.0050
7 0.85 0.9838 0.0080 0.0009 0.0043 0.0007 0.0047 0.0052
0.9805 0.9810 0.9815 0.9820 0.9825 0.9830 0.9835 0.9840 0.9845 0.9850 0.9855
0.3 0.4 0.5 0.6 0.7 0.8 0.85 0.9
Cross-over rate
Av
a
il
a
b
ili
ty
Figure 3.1: Effect of Cross-over rate on Availability of Screw plant 5.Conclusion
This paper illustrate the application of Genetic Algorithm to availability optimization problem of screw plant. Availability of screw plant is considered as Fitness fuction.Garg et.al. [42] discussed the effect of variation of failure and repair rates on the availability of screw plant and by variation of these parameter they try to get maximum value of availability that was 77.29% .By using genetic algorithm ,optimum value of availability is found to be 98.49%.Value of availability is improved by 20% by application of genetic algorithm.
Genetic algorithm is successfully applied to coordinate simultaneously failure and repair rate parameters for an optimal level of system availability .Effect of various parameters of GA such as number of generation, population size, and cross over rate on the availability has also been analyze and plotted on the graphs..
6.Acknowledgement
Authors are very thankful to Plant management of M.S.M. Engg. Works. , Chandigarh , for providing us sufficient information and also for informative discussions essential for conducting availability optimization of concern plant. Results of the same have also been discussed with Plant management .Results are found to be highly beneficial for the system designing, maintenance and planning.
REFRENCES:
[1] M. Sakawa. Multi-objective optimization by the surrogate worth trade-off method,IEEE Transactions on Reliability R-27, 311– 314(1978).
[2] K.S. Park.Fuzzy apportionment of system reliability,IEEE Transactions on Reliability R-36:129– 132(1987).
[3] H.Z. Huang.Fuzzy multi-objective optimization decision-making of reliability of series system, Microelectronics Reliability 37 (3): 447–449(1997).
[4] G.S. Mahapatra and T.K. Roy.Fuzzy multi-objective mathematical programming on reliability optimization model,Applied Mathematics and Computation 174: 643–659(2006).
[5] W. Kuo .Recent Advances in Optimal Reliability Allocation”, IEEE Transactions on Systems, Man and Cybernetics—Part A: Systems and Humans 37( 2): 143-156(2007).
[6] W. Kuo, V.R. Prasad, F.A. Tillman, C. Hwang. Optimal Reliability Design—Fundamentals and Applications,Cambridge University Press, Cambridge, UK, 2001.ch. 2-4.
[7] F.A. Tillman, C.L. Hwang, W. Kuo.Optimization of System Reliability”, Marcel Dekker, Inc., New York and Basel, 1980. [8] J. H. Holland.Adaptation in Natural and Artificial System,Ann Arbor,MI: University of Michigan Press, 1975.
[9] D. E. Goldberg.Genetic Algorithms in Search, Optimization, and Machine Learning, Addison-Wesley Publishing Company, 1989. [10] D. Beasly, D.R. Bull, and R.R. Martin.An Overview on Genetic Algorithms:Part 1. Fundamentals, University Computing 15:1993,58–
69(1993)
[11] D. Beasly, D.R. Bull, and R.R. Martin. An Overview on Genetic Algorithms: Part 2. Research Topics , University Computing 15: 170– 181 (1993).
[12] D. Fogel .An introduction to simulated evolutionary optimization, IEEE Trans. Neural Networks 15(1):3–14(1994). [13] F. Herrera and J. L. Vergeday.Genetic Algorithm and Soft Computing”,Ohysica-Verlag, Heidelberg 1996.
[14] P. A. Joyce, T. A.Withers and P. J. Hickling, Application of genetic algorithms to optimum offshore plant design, in Proc. ESREL 98, Trondheim, Norway, June 16–19:. 665–671(1998)
[15] D. W. Coit and A. E. Smith.Use of genetic algorithm to optimize a combinatorial reliability design problem, in Proc. Third IIE Research Conf.: 467–472(1994).
[17] E. Zitzler and L. Thiele.Multiobjective evolutionary algorithms: a comparative case study and the strength pareto approach, IEEE Transactions on Evolutionary Computation 3( 4):257– 271(1999).
[18] C. M. Fonseca and P. J. Fleming, An overview of evolutionary algorithms in multiobjective optimization. Evolutionary Computation, 3( 1): 1–16(1995).
[19] C. M. Fonseca and P. J. Fleming ,Genetic algorithms for multiobjective optimization: formulation, discussion, and generalization ,Proceedings of the Fifth International Conference on Genetic Algorithms, Morgan Kaufmann, San Francisco, CA: 416– 23(1993).
[20] N. Srinivas and K. Deb.Multiobjective function optimization using nondominated sorting genetic algorithms, Evolutionary Computation, 2(3), 221–248(1995).
[21] K. Krishna kumar and D. E. Goldberg.Control System Optimization Using Genetic Algorithms, Journal of Guidance, Control and Dynamics 15( 3): 735-740(1992).
[22] M. F. Bramlette and R. Cusin .A Comparative Evaluation of Search Methods Applied to Parametric Design of Aircraft, Proc. ICGA3:213-218(1989).
[23] B. Porter and S. S. Mohamed.Genetic Design of Multivariable Flight- Control Systems Using Eigen structure Assignment, Proc. IEEE Conf. Aerospace Control Systems:435 – 439(1993).
[24] A. Varsek, T. Urbacic and B. Filipic,Genetic Algorithms in Controller Design and Tuning. IEEE Trans. Sys.Man and Cyber. 23( 5):1330-1339(1993).
[25] L. Davis .Genetic algorithms and simulated annealing , Morgan Kaufman Publishers, Inc.,Los Altos, CA 1987. [26] K. A. De Jong.An analysis of the behavior of a class of genetic adaptive systems,PhD Thesis, Univ. of Michigan, 1975. [27] D. E. Goldberg:Genetic Algorithms in Search, Optimization and Machine Learning, Addison- Wesley, 1989.
[28] J. H. Holland.Genetic algorithm and the optimal allocation of trials, SIAM Journal on Computing 2( 2): 88–105(1973). [29] G. E. Liepins and M. R. Hilliard. Genetic algorithms: foundations and Applications, Annals of Operations Research
21:31-58(1989).
[30] H.Tsarouhas Panagiotis. Classification and calculation of primary failure modes in bread production line, Reliability Engineering & System Safety :551-557 (2009).
[31] H. Tsarouhas Panagiotis, S. Arvanitoyannis Ioannis, H. Varzakas Theodoros. Reliability and maintainability analysis of cheese (feta) production line in a Greek medium- size company: A case study , Journal of Food Engineering 94:233- 240 (2009).
[32] Q. Michelson .Use of Reliability Technology in The Process Industry, Reliability Engineering and system safety 60: 179-181(1998).
[33] D.Garg , K.Kumar .Matrix Based System Relaibility Method And its application to rice plant, ICFAI Journal of Computational Mathematics. II (4):17-30(2009).
[34] S.N. Sivanandam,S.N. Deepa .Introduction to Genetic Algorithms,Springer Verlag, Heidelberg, 2008.
[35] D.A.Savic, and G.A. Walters .Genetic algorithms for least-cost design of water distribution networks. Journal of Water Resources Planning and Management- Asce.123(2):67-77(1997).
[36] W.Coit David and E Smith Alice.Reliability optimization of series parallel systems using a genetic algorithm, IEEE Transactions on Reliability 45(2): 254-260(1996).
[37] L.Painton and J.Campbell.Genetic algorithm in optimization of system reliability ,IEEE Transaction on reliability 44:172- 178 (1995)
[38] M.Bielli, M.Carami and P.Carotenuto .Genetic algorithm in bus network optimization ,Transport research ,Part C 10,:19-34(2002). [39] V.S. Summanwar,V.K.Jayaraman ,B.D.Kulkarni,H.S.Gupta,and J.Rajesh . Solution of constrained optimization of
problems by multi- objective genetic algorithm , Computers & Chemical Engineering,26:1481-1492(2002).
[40] R. Tavakkoli-Moghaddam, J. Safari, F. Sassani. Reliability optimization of series-parallel systems witha choice of edundancy strategiesusingagenetic algorithm, ReliabilityEngineering &SystemSafety 93 ( 4) : 550-556(2008) [41] A. Azaron, C. Perkgoz, H. Katagir, K. Kato and . Sakawa, Multi-objective reliability optimization for dissimilar-unit
cold-standby systems using a genetic algorithm ,Computers&Operations Research 36(5),: 1562-1571(2009)