Executive Function in Adolescents Born
,
1000 g or
,
28 Weeks: A Prospective
Cohort Study
Alice C. Burnett, PhDa,b, Shannon E. Scratch, PhDb, Katherine J. Lee, PhDb,c, Jeanie Cheong, MDb,d,e, Karissa Searle, BScf, Esther Hutchinson, DPsycha,g, Cinzia De Luca, PhDa, Mary-Ann Davey, DPHh, Gehan Roberts, PhDc, i, j, Lex W. Doyle, MDa,b,c,e, Peter J. Anderson, PhDb,c, on behalf of the Victorian Infant Collaborative Study Group
abstract
BACKGROUND AND OBJECTIVES:Extremely preterm (EP;,28 weeks) birth and extremely low birthweight (ELBW;,1000 g) are risk factors for poor cognitive outcomes, including in executive function (EF; higher-order cognitive skills necessary for goal-directed, adaptive functioning and important for academic and behavioral-emotional outcomes). We aimed to (1) extend the limited data on EF in EP/ELBW survivors in adolescence compared with normal birth weight controls, and (2) determine changes in EF between ages 8 and 17 years in both groups.
METHODS:Two hundred twenty-eight EP/ELBW and 166 control adolescents (mean age, 17
years) from a prospective geographical cohort were assessed with multiple EF tasks, and parent- and self-ratings of behavioral EF. The Rey Complex Figure and Behavior Rating Inventory of Executive Function parent report were also administered at age 8 years, enabling examination of change in scores between childhood and adolescence.
RESULTS:EP/ELBW adolescents performed more poorly than controls in verbal processing speed, attentional control, cognitiveflexibility, and goal-setting (effect sizes,20.7 to20.2 SD), but not psychomotor reaction time. Group differences were of similar magnitude across tasks. From childhood to late adolescence, EP/ELBW children improved their accuracy of the Rey Complex Figure copy more than controls. According to parents, executive behaviors were largely stable over time in both groups.
CONCLUSIONS:Adolescents born EP/ELBW have poorer EF skills across multiple domains than controls. From childhood to late adolescence, different aspects of EF improved, but others did not, underscoring the need for multidomain, longitudinal assessments in this high-risk population.
WHAT’S KNOWN ON THIS SUBJECT:Preterm
children often experience poor executive function (EF; skills underpinning adaptive, goal-directed behavior, and essential for positive academic, occupational, and social outcomes). EF matures across
adolescence, but the nature and course of EF deficits for preterm adolescents is not well-described.
WHAT THIS STUDY ADDS:Extremely preterm/
extremely low birthweight adolescents demonstrated small-to-medium deficits across multiple EF domains compared with normal birthweight controls. Preterm children improved on some EF aspects from age 8 to late
adolescence relative to controls, but not on parent-rated behavioral EF.
aPremature Infant Follow-Up Programme anddNeonatal Services, Royal Women’s Hospital, Parkville, Victoria, Australia;bVictorian Infant Brain Studies andjPopulation Health, Murdoch Childrens Research Institute, Parkville, Victoria, Australia;cDepartments of Paediatrics,eObstetrics and Gynaecology, andfPsychiatry, University of Melbourne, Parkville, Victoria, Australia;gNeonatal Medicine andiCentre for Community Child Health, Royal Children’s Hospital, Victoria, Australia; andhJudith Lumley Centre, LaTrobe University, Melbourne, Victoria, Australia
Dr Burnett conceptualized and designed the study, contributed to data collection, design, and conduct of data analysis, and drafted the initial manuscript; Drs Scratch and Lee contributed to design, conduct, and interpretation of data analysis, and reviewed and revised the manuscript; Ms Searle, and Drs Hutchinson, De Luca, Roberts, and Davey contributed to interpretation of data analysis, and reviewed and revised the manuscript; Drs Cheong, Doyle, and Anderson contributed to study conception and design, and reviewed and revised the manuscript; and all authors approved thefinal manuscript as submitted.
www.pediatrics.org/cgi/doi/10.1542/peds.2014-3188
DOI:10.1542/peds.2014-3188 Accepted for publication Jan 20, 2015
Children born extremely preterm (EP;,28 weeks’gestation) or extremely low birth weight (ELBW; ,1000 g) are at elevated risk of cognitive difficulties, including in executive function (EF), even in the absence of major intellectual disability.1,2EF is an umbrella term encompassing various interrelated, higher-order cognitive skills necessary for complex reasoning, goal-directed activity, and adaptive behavior.3,4 Evidence is growing that preterm children (,37 weeks’gestation) have poorer EF than their term-born peers5 and that such difficulties may be evident into adolescence and adulthood.6–8However, past research has largely focused on selective aspects of EF and has drawn from cohorts born many years ago. Furthermore, longitudinal reports of EF in EP/ELBW samples into
adolescence are scarce.9,10Catch-up to age-expected levels by adolescence has been reported for some cognitive skills (receptive vocabulary) but not others (general intellectual
functioning).11In a cross-sectional study, EF deficits appeared more pronounced in younger preterm children than in older preterm children, relative to controls.10Of clinical importance, however, this has not been well-explored in longitudinal data sets. Adolescence is an important period of development for EF skills,12 and hence it is crucial to assess EF skills comprehensively and longitudinally in contemporary adolescent cohorts.
We have previously reported poorer EF in a large geographic EP/ELBW cohort at age 8 years compared with normal birth weight (NBW;.2499 g) controls.13In late adolescence, this group also performed more poorly than controls on attention domains such as focusing, sustaining, switching, and dividing attention.14 The current study aimedfirstly to characterize EF in this cohort in late adolescence compared with NBW controls across a range of EF tasks (some less demanding and some
more demanding). It was hypothesized that the EP/ELBW group would have poorer EF in adolescence compared with the control group. Secondly, we aimed to examine change over time in EF from childhood to late adolescence in EP/ ELBW and NBW controls. It was hypothesized that improvement would be greater in the EP/ELBW group than controls.
METHODS
Participants were drawn from the Victorian Infant Collaborative Study (VICS) 1991–1992 birth cohort, originally comprising 298 consecutive survivors born EP/ELBW in the state of Victoria, Australia, from 1991 to 1992, and a control group of 262 NBW (.2499 g) infants. Controls were matched to EP/ELBW children for gender, expected due date, maternal country of origin (English-speaking/not), and maternal health insurance status. Participants were recruited at birth and assessed at ages 2, 5, and 8 years.15–17This article reveals the latest follow-up at ∼17 years, corrected for
prematurity,18when participants were invited to complete
a comprehensive cognitive, medical, and psychological assessment. The Human Research Ethics Committees of the participating sites (Royal Women’s Hospital, Mercy Hospital for Women, Monash Medical Centre, and
Royal Children’s Hospital, Melbourne) approved the original and follow-up studies. All participants provided informed consent for the adolescent follow-up, as did parents of those younger than 18 years.
Measures
To design a comprehensive assessment of EF, we used a conceptual framework called the Executive Control System.4This framework proposes 4 integrative EF domains: cognitiveflexibility, goal setting, attentional control, and information processing (Fig 1). Although these domains interact, attentional control and information processing may be considered less demanding processes than cognitive
flexibility and goal setting. Indeed, information processing and attention control may act as foundations for cognitiveflexibility and goal setting, with more efficient processing and attention allocation facilitating better
flexibility and problem solving. In adolescence, measures were selected to assess each of these theoretical domains of EF, as well as everyday behavioral EF (Supplemental Information).
Information Processing
Reaction times from the detection and identification subtests of the computer-based assessment CogState,19and part 1 time of the Hayling Sentence Completion Test
FIGURE 1
(HSCT) were used.20Because CogState identification requires an additional decision-making process than CogState detection, identification was considered more demanding.
Attentional Control
HSCT part 2 time and errors, and the efficiency scores for trials 1 and 2 of the Contingency Naming Test (CNT) were used.21,22We also used the Digit Recall maximum span score from the Working Memory Test Battery for Children (WMTB-C).23
Cognitive Flexibility
Backward Digit Recall maximum span scores of the WMTB-C were used. We also used efficiency scores for CNT trials 3 and 4. We have previously reported poorer trials 3 and 4 efficiency in the EP/ELBW adolescents compared with
controls,14but we include these data here because they are relevant to our EF framework. Because CNT trial 4 requires the application of an additional rule than trial 3, trial 4 was considered more demanding.
Goal Setting
We used the Rey Complex Figure (RCF), scored for accuracy (reflecting complex spatial perception and construction; maximum 36 points) and for conceptual organization (reflecting spatial planning and organization; on a scale from 1 =“unrecognizable”to 7 =“excellent organization”).24–26The RCF was administered at both 8 and 17 years. We also used the Tower of London (TOL),27,28 recording the number of trials successfully completed within 60 seconds, number offirst-trial successes (“perfect solutions”), number of failed attempts, and overall summary score.
Behavioral EF
We used the Behavioral Regulation Index (BRI) and Metacognition Index (MCI) of the Behavior Rating Inventory of Executive Function (BRIEF) questionnaire.29Parent
(BRIEF-PR) and self (BRIEF-SR) reports were acquired. The BRIEF-PR was administered at both 8 and 17 years.
Background Variables
The sample was characterized in terms of background characteristics and perinatal and neonatal variables previously associated with
outcome.11,16Relevant variables include gestational age, birth weight, gender, maternal age at birth, major brain injury on cranial ultrasound (grade 3/4 intraventricular
hemorrhage or cystic periventricular leukomalacia), postnatal
corticosteroid treatment, and major neonatal surgery. The primary income earner’s occupation (dichotomized into lower/higher groups, as a proxy for socioeconomic status [SES]), measured at age 8 years, was also explored as a potential confounder.30 We also recorded the presence of major disability at age 8 years (defined as any of a full scale intelligence quotient [FSIQ],22 SD relative to controls [FSIQ,77], moderate or severe cerebral palsy, blindness, or deafness), whether children received developmental/ behavioral interventions at age 8 years, and estimated FSIQ in adolescence by using the Wechsler Abbreviated Scale of Intelligence.31
Data Analysis
Baseline characteristics were compared between participants who did and did not attend the adolescent assessments and between the EP/ELBW and control participants by using numbers and proportions (categorical data) and means and SDs (continuous data).
Group differences (EP/ELBW versus control) in adolescent EF
performance were assessed by using linear regression. With the exception of the BRIEF, the EF measures were not age-standardized, and age at assessment was therefore included as a covariate. Because our sample included a number of multiple births,
models werefitted by using generalized estimating equations with an exchangeable correlation structure and are reported with robust SEs to allow for
nonindependence of siblings.32As a sensitivity analysis, comparisons were repeated adjusting for parental occupation at age 8 years. Models were also repeated excluding 13 adolescents with FSIQ,70 to determine whether group differences were attributable to those with intellectual impairment. Finally, group comparisons were repeated on a standardized scale (standardized with respect to the control group mean and SD), adjusted for age and SES, to represent the magnitude of group differences across tasks and domains on the same scale. These effect sizes were interpreted by using Cohen’s conventions (small: d= 0.2, medium: d= 0.5, large: d= 0.8).33
To examine change over time (age) in RCF and BRIEF scores, continuous data (RCF accuracy, BRIEF indices) were analyzed by using mixed effects linear regression models applied to the 8- and 17-year time points concurrently. Models includedfixed effects of group (EP/ELBW versus control), age, and the group-by-age interaction, and a random slope and intercept to account for the repeated observations on an individualfitted with an unstructured covariance matrix. Analyses were repeated adjusting for parental occupation and excluding 13 participants with FSIQs ,70 at age 17 years. For the RCF organization score, we considered the odds of improving by at least 1 category from age 8 years to adolescence by using a logistic regression model. Predictors included birth group, age at adolescent assessment, and age 8 score, to control for group differences during childhood. Analyses were conducted by using SPSS version 20 (IBM SPSS Statistics, IBM Corporation)
RESULTS
Sample Description
EF data were acquired for 228 EP/ELBW (77% of the original group) and 166 (63%) control group adolescents. Participants’mean age at assessment was 17.0 years (SD 1.5) in the EP/ELBW group, and 17.3 (SD 1.6) in the control group
(Table 1). Among the EP/ELBW group, those lost to follow-up were similar to those assessed in their perinatal/ neonatal characteristics and their EF scores, FSIQ, and parental occupation at age 8 years. Major disability was, however, less common in those assessed as adolescents compared with those not assessed (15% vs 31%). Among controls, those assessed were more likely to be girls, singleton, and have older mothers, higher childhood FSIQ, and lower mean BRIEF scores at 8 years than those not assessed. Controls assessed in adolescence were less likely to have a major disability than those not assessed (2% vs 8%).
The EP/ELBW and control groups assessed in late adolescence differed on expected perinatal and neonatal variables (birth weight, gestational age, plurality, medical treatments, brain injury) but had similar proportions of girls and mean maternal age (Table 1). EP/ELBW participants were more likely to have a major disability in childhood, have poorer EF scores and lower SES at age 8 years, and have lower mean FSIQ36than controls in adolescence.
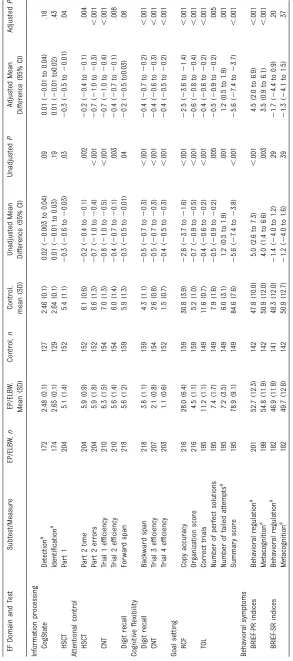
Group Differences in EF in Adolescence
The EP/ELBW group performed more poorly than controls on many, though not all, EF measures in late
adolescence (Table 2). Regarding information processing, the groups had similar reaction times for the CogState tasks, although the
EP/ELBW group had slower response times for HSCT part 1. The EP/ELBW group performed more poorly than controls on all measures of
attentional control, cognitive
flexibility, and goal setting.
Accounting for parental occupation did not alter the pattern offindings on EF tasks, except for slight attenuation in the group difference for Digit Recall (forward) span scores. Excluding participants with FSIQ,70 also gave a similar pattern of results (results not shown). Again the exception to this was Digit Recall (forward), where evidence for the group difference became weaker (adjusted mean difference,20.2 [95% confidence interval (CI):20.4 to 0.1],P= .18).
Regarding behavioral reflections of EF (ie, BRIEF), the results varied according to the informant. Parents reported that the EP/ELBW group displayed more behavioral EF difficulties than controls. In contrast, the adolescents’self-reports were similar across the groups. Again, this pattern remained after adjustment (Table 2) and excluding those with FSIQ,70 (results not shown).
TABLE 1 Characteristics of EP/ELBW and Control Participants and Nonparticipants
Perinatal EP/ELBW Controls Seen
Seen,n= 228 Not Seen, n= 70
Seen Versus NotP
Seen, n= 166
Not Seen, n= 96
Seen Versus NotP
EP/ELBW Versus ControlsP Gestational age, mean (SD), wk 26.6 (2.0) 27.0 (1.7) .10 39.2 (1.4) 39.2 (1.4) .76 ,.001 Birth weight, mean (SD), g 884 (161) 899 (161) .51 3401 (453) 3347 (419) .34 ,.001
Girl 57 (129) 44 (31) .07 60 (99) 39 (37) .001 .54
Singleton 67 (153) 77 (54) .11 99 (164) 94 (90) .02 ,.001
Major neonatal brain injury 10 (22) 14 (10) .27 0 (0) 0 (0) NA NA Small for gestational age 15 (35) 16 (11) .94 0.6 (1) 0 (0) .45 ,.001 Postnatal corticosteroids 32 (73) 36 (25) .57 0 (0) 0 (0) NA NA
Neonatal surgery 25 (58) 27 (19) .78 0 (0) 0 (0) NA NA
Maternal age, mean (SD), y 28.9 (5.9) 27.4 (5.2) .06 29.9 (4.8) 28.0 (5.7) .004 .07 Age 8 y
BRIEF PR BRI, mean (SD) 51.3 (11.0) 54.0 (10.1) .14 48.5 (9.7) 53.8 (11.7) .001 .01 BRIEF PR MCI, mean (SD) 53.0 (9.9) 56.0 (8.7) .07 48.9 (9.6) 52.5 (10.3) .02 ,.001 RCF accuracy, mean (SD) 22.1 (7.8) 24.1 (6.1) .14 26.7 (6.0) 26.4 (5.4) .78 ,.001 RCF organization score, median (IQR) 3 (2–4) 3 (3–4) .89 4 (3 5) 4 (3–4) .55 ,.001 Major disability 15 (33) 31 (20) .003 2 (4) 8 (6) .05 ,.001 FSIQ, mean (SD) 96 (17) 94 (12) .51 106 (13) 100 (16) .005 ,.001 Higher SES, % (n/N) 58 (128/220) 49 (24/49) .24 72 (118/163) 64 (39/61) .22 .004 Developmental/behavioral
interventions, % (n/N)
4 (8/221) 2 (1/49) .58 1 (1/163) 3 (2/61) .12 .054
Adolescence
Age at assessment, mean (SD), y 17.0 (1.5) NA NA 17.3 (1.6) NA NA .29
FSIQ 95 (16) NA NA 106 (14) NA NA ,.001
Pattern of Group Differences Across EF Tasks
Figure 2 reveals the mean differences between groups on the standardized scale across different tasks and domains (adjusted for age and parental occupation). Across the domains, group differences on objective EF measures were generally in the small to medium range (point estimates20.7 to20.2 SD). Although there was some variability across measures, the magnitude of differences did not vary greatly across the 4 domains or parental perceptions of behavioral symptoms, with substantial overlap in the CIs. Within the domains, the EP/ELBW and control groups performed similarly on the lower and higher demand tasks within information processing (CogState detection versus identification) and cognitiveflexibility (CNT trials 3 vs 4).
Longitudinal Patterns of EF in EP/ELBW and Control Groups
There was evidence of a greater increase in RCF copy accuracy with age in the EP/ELBW group than the control group (Table 3). In terms of RCF organization, similar proportions revealed improvement between 8 and 17 in both groups (EP/ELBW: 67% [137 of 203] and controls: 72% [113 of 156]; unadjusted odds ratio [OR] = 0.78, 95% CI: 0.49 to 1.24,P= .29). However, after adjusting for organization score and parental occupation at age 8 years, there was evidence that EP/ELBW adolescents had lower odds of improving their score than controls (adjusted OR = 0.47, 95% CI: 0.27 to 0.82,P= .008).
Table 3 also summarizes change over time (age) in the BRIEF-PR. BRI scores increased with age in the EP/ELBW group but decreased with age in controls. However, the magnitude of the age effect was minimal in both groups. Finally, there was little evidence for an age effect in MCI scores. Excluding those with FSIQ,70 at the adolescent follow-up
did not alter the pattern of results for any longitudinal comparisons (data not shown).
DISCUSSION
The EP/ELBW adolescents in this large, contemporary, geographical cohort displayed deficits across multiple EF domains, except psychomotor reaction time, relative to NBW controls. Effect sizes were generally in the small to medium range across the domains tested, except for self-ratings of EF. From childhood to adolescence, parent-rated behavioral EF remained reasonably stable in both EP/ELBW
and control groups. Interestingly, EP/ELBW adolescents demonstrated some catch-up on the RCF accuracy score, but did not demonstrate the same gains in RCF organization.
Thesefindings are mostly consistent with previous reports of EF deficits in preterm adolescent samples,8,9,37,38 and highlight that difficulties exist even for those without major disability.8In contrast to some reports,40there was little evidence that psychomotor reaction time differed between EP/ELBW and control adolescents, although differences were found for verbal speed and efficiency. This may reflect
underlying language difficulties in the EP/ELBW group, as demonstrated elsewhere,40,41or differences in the level of output required between the tests. The magnitude of group differences was similar across the 4 domains assessed (information processing, attentional control, cognitiveflexibility, and goal setting). When task difficulty extended beyond psychomotor reaction time, there was little evidence for greater group differences in more demanding tasks and domains. Thisfinding contrasts with a previous report of decreasing performance with increasing cognitive demand among preterm FIGURE 2
Adjusted mean differences (on a standardized scale) and 95% CIs in EP/ELBW compared with control adolescents across EF domains. Cohen’s conventions: small difference =20.2; medium =20.5; large =20.8.
TABLE 3 Change Over Time in Scores for Goal Setting and BRIEF-PR
Outcome Model EP/ELBW Group, Coefficient of Age (95% CI)
P Control Group, Coefficient of Age (95% CI)
P Group by Age InteractionP RCF accuracy score Unadjusted 0.69 (0.60 to 0.78) ,.001 0.50 (0.40 to 0.60) ,.001 .007
Adjusted 0.69 (0.60 to 0.78) ,.001 0.50 (0.40 to 0.60) ,.001 .008 BRIEF-PR BRI Unadjusted 0.12 (20.06 to 0.29) .19 20.17 (20.38 to 0.03) .10 .03
Adjusted 0.15 (20.03 to 0.32) .10 20.17 (20.38 to 0.03) .10 .02 BRIEF-PR MCI Unadjusted 0.15 (20.04 to 0.34) .12 0.16 (20.05 to 0.38) .14 .91 Adjusted 0.17 (20.01 to 0.36) .07 0.15 (20.07 to 0.37) .17 .89
children,42although we applied a different conceptual framework and focused on EF rather than general cognition. Given this, the effects of task demand merit further examination, perhaps by using experimental paradigms to manipulate cognitive demand.
Perceptions of EF differed among different informants in the current study. We found that parents of EP/ELBW adolescents reported more difficulties in their child than parents of controls, the magnitude of which was concordant with group differences on objective EF
assessments. However, the EP/ELBW adolescents reported their EF similarly to control adolescents. Speculatively, this may reflect the nature of EF deficits and their impact on the capacity for self-reflection and insight. Although adolescent EF data are limited, a sample of adults born ,1500 g reported less or similar difficulty with behavioral EF than term-born peers, at odds with their parents’report and objective test performance.7The current study supports thisfinding in
a contemporary cohort of high-risk preterm survivors.
Regarding longitudinal analysis of EF, the EP/ELBW group displayed a variable pattern of progress from childhood to adolescence. Despite demonstrating improving accuracy on the RCF copy (visuospatial
construction/integration) more than the control group, EP/ELBW participants were less likely to improve their conceptual organization score (visuospatial planning), after adjusting for baseline group differences. Altered
maturational trajectories have been identified in other cognitive domains in preterm adolescents,11and in EF from early to middle childhood.10,43 However, longitudinal reports of EF into older adolescence are limited. Although ceiling effects of tests are an important consideration in
longitudinal studies of cognitive
development, the RCF is used widely in children and adults, and we saw improved accuracy toward normative young adult levels44in both groups over the follow-up period. In addition, no participants were at ceiling for the RCF organization score in childhood. Speculatively, these RCFfindings may reflect compensatory cognitive processes in the EP/ELBW group, and future follow-up is needed to determine whether EF deficits identified here reduce into early adulthood. In contrast, parent-rated EF and behavior remained stable over time in both groups, suggesting that everyday behavioral EF difficulties continue to be perceived by parents of EP/ELBW survivors into
adolescence.
The current study has a number of strengths, including comprehensive and conceptually driven assessments and multi-informant reports of EF skills in everyday life. The sample was large and prospectively recruited. We also acknowledge some limitations. Some of the original cohort was lost to follow-up, and attrition among controls may have been biased toward less advantaged children. However, accounting for parental occupation did not alter our pattern offindings. We also recognize that EF develops dramatically with age, and although we were able to use some measures in both childhood and adolescence, it is a challenge to identify measures that are developmentally appropriate across these ages. Nonetheless, we were able to examine some aspects of EF longitudinally by using the same measures.
The present results highlight important avenues for future research. We focused upon conceptually driven direct
assessment of EF, and parent- and self-rated EF, by using a well-cited model to tap constructs that are widely recognized as“executive”in the literature.45However, we note that there are various EF models.46 Aspects of EF mature into early
adulthood, so young adult follow-up is crucial to determine whether poor EF in childhood and adolescence represents a delay in, or deviation from, typical cognitive development. Furthermore, neuroanatomical correlates of EF deficits and intervention opportunities merit further examination. Future research should also explore relationships between EF and functional outcomes (eg, social and occupational domains).
CONCLUSIONS
This study demonstrated generalized EF difficulties in a comprehensive examination of a large, contemporary cohort of EP/ELBW adolescents compared with controls. We found small to medium differences across lower- and higher-demand tasks and domains. Parents’perceptions of behavioral EF remained stable from childhood to adolescence, but visuospatial planning and construction skills may develop differently in preterm children compared with controls. These
findings suggest a need to monitor multiple aspects of EF in preterm children into young adulthood.
ACKNOWLEDGMENTS
The VICS Group members were as follows: Convener: Lex W. Doyle, MD, FRACP, Premature Infant Follow-up Program, Royal Women’s Hospital, Departments of Obstetrics and Gynaecology, and Paediatrics, University of Melbourne, and Murdoch Childrens Research Institute (Parkville, Victoria, Australia); Collaborators (in alphabetical order): Peter J. Anderson, PhD, Department of Paediatrics, University of Melbourne, and Murdoch Childrens Research Institute; Alice Burnett, PhD,
(Melbourne, Victoria, Australia); Margaret P. Charlton, MEd, Psych, Monash Medical Centre; Jeanie Cheong, MD, FRACP, Premature Infant Follow-up Program, Royal Women’s Hospital, Department of Obstetrics and Gynaecology, University of Melbourne, and Murdoch Childrens Research Institute; Mary-Ann Davey, RN/RM, MEpi, DPH, Judith Lumley Centre, LaTrobe University
(Melbourne, Victoria, Australia); Noni Davis, FRACP, Premature Infant Follow-up Program, Royal Women’s Hospital; Cinzia R. De Luca, BSc, PhD, Premature Infant Follow-up Program, Royal Women’s Hospital, Julianne Duff, FRACP, Premature Infant Follow-up Program, Royal Women’s
Hospital; Marie Hayes, RN, Monash Medical Centre; Esther Hutchinson, DPsych, Premature Infant Follow-up Program, Royal Women’s Hospital; Elaine Kelly, MA, Premature Infant Follow-up Program, Royal Women’s Hospital, Mercy Hospital for Women (Melbourne, Victoria, Australia); Marion McDonald, RN, Premature Infant Follow-up Program, Royal Women’s Hospital; Carly Molloy, PhD, Murdoch Childrens Research
Institute; Gillian Opie, FRACP, Mercy Hospital for Women; Gehan Roberts, MPH, PhD, FRACP, Department of Paediatrics, University of Melbourne, Murdoch Childrens Research Institute, and Royal Children’s Hospital; Karissa Searle BSc,
Department of Psychiatry, University of Melbourne; Andrew Watkins, FRACP, Mercy Hospital for Women; Amanda Williamson, Mercy Hospital for Women; Michelle Wilson-Ching, PhD, Premature Infant Follow-up Program, Stephen J. Wood, PhD, School of Psychology, University of Birmingham (Birmingham, United Kingdom); and Heather Woods, RN, Mercy Hospital for Women.
We gratefully acknowledge the contribution of the families who participated in this longitudinal study. This work is published on behalf of members of the VICS Group, who were involved in data collection at the various study sites.
PEDIATRICS (ISSN Numbers: Print, 0031-4005; Online, 1098-4275). Copyright © 2015 by the American Academy of Pediatrics
FINANCIAL DISCLOSURE:The authors have indicated they have nofinancial relationships relevant to this article to disclose.
FUNDING:Funded in part by a Centre of Clinical Research Excellence grant (ID 546519), a project grant (ID 491246), and fellowship support (Dr Anderson: 628371;
Dr Cheong: 1053787) from the Australian National Health and Medical Research Council; the following were successful applicants for the project grant: Drs Doyle and Anderson, Stephen Wood, Colin Robertson, Sarah Hope, Doug Hacking, and Dr Cheong. Support was also provided by the Victorian Government’s Operational Infrastructure Support Program. The funders had no role in study design, data collection and analysis, decision to publish, or preparation of the manuscript.
POTENTIAL CONFLICT OF INTEREST:The authors have indicated they have no potential conflicts of interest to disclose.
REFERENCES
1. Johnson S. Cognitive and behavioural outcomes following very preterm birth.
Semin Fetal Neonatal Med. 2007;12(5): 363–373
2. Johnson S, Wolke D, Hennessy E, Marlow N. Educational outcomes in extremely preterm children: neuropsychological correlates and predictors of attainment.
Dev Neuropsychol. 2011;36(1):74–95 3. Lezak MD, Howieson DB, Bigler ED, Tranel
D.Neuropsychological Assessment. New York, NY: Oxford University Press; 2012
4. Anderson P. Assessment and
development of executive function (EF) during childhood.Child Neuropsychol. 2002;8(2):71–82
5. Mulder H, Pitchford NJ, Hagger MS, Marlow N. Development of executive function and attention in preterm children: a systematic review.Dev Neuropsychol. 2009;34(4):393–421
6. Aarnoudse-Moens CSH, Weisglas-Kuperus N, van Goudoever JB, Oosterlaan J. Meta-analysis of neurobehavioral outcomes in very preterm and/or very low birth weight children.Pediatrics. 2009;124(2): 717–728
7. Heinonen K, Pesonen A-K, Lahti J, et al. Self- and parent-rated executive functioning in young adults with very low birth weight.Pediatrics. 2013;131(1). Available at: www.pediatrics.org/cgi/ content/full/131/1/e243
8. Luu TM, Ment L, Allan W, Schneider K, Vohr BR. Executive and memory function in adolescents born very preterm.
Pediatrics. 2011;127(3). Available at: www.pediatrics.org/cgi/content/full/127/ 3/e639
9. Burnett AC, Scratch SE, Anderson PJ. Executive function outcome in preterm adolescents.Early Hum Dev. 2013;89(4): 215–220
10. Ritter BC, Nelle M, Perrig W, Steinlin M, Everts R. Executive functions of children born very preterm—deficit or delay?Eur J Pediatr. 2013;172(4):473–483
11. Luu TM, Vohr BR, Allan W, Schneider KC, Ment LR. Evidence for catch-up in cognition and receptive vocabulary among adolescents born very preterm.
Pediatrics. 2011;128(2):313–322 12. Huizinga M, Dolan CV, van der Molen MW.
Age-related change in executive function: developmental trends and a latent variable analysis.Neuropsychologia. 2006;44(11):2017–2036
13. Anderson PJ, Doyle LW; Victorian Infant Collaborative Study Group. Executive functioning in school-aged children who were born very preterm or with extremely low birth weight in the 1990s.
Pediatrics. 2004;114(1):50–57
a contemporary geographic cohort of adolescents born extremely preterm/ extremely low birth weight.J Int Neuropsychol Soc. 2013;19(10): 1097–1108
15. Anderson P, Doyle LW; Victorian Infant Collaborative Study Group.
Neurobehavioral outcomes of school-age children born extremely low birth weight or very preterm in the 1990s.JAMA. 2003;289(24):3264–3272
16. Doyle LW; Victorian Infant Collaborative Study Group. Outcome at 5 years of age of children 23 to 27 weeks’gestation: refining the prognosis.Pediatrics. 2001; 108(1):134–141
17. The Victorian Infant Collaborative Study Group. Outcome at 2 years of children 23–27 weeks’gestation born in Victoria in 1991–92.J Paediatr Child Health. 1997; 33(2):161–165
18. Wilson-Ching M, Pascoe L, Doyle LW, Anderson PJ. Effects of correcting for prematurity on cognitive test scores in childhood.J Paediatr Child Health. 2014; 50(3):182–188
19. CogState Ltd. CogState. Melbourne, Australia
20. Burgess PW, Shallice T.The Hayling and Brixton Tests. London, United Kingdom: Pearson; 1997
21. Anderson PJ, Anderson V, Northam E, Taylor HG. Standardization of the Contingency Naming Test (CNT) for school-aged children: a measure of reactiveflexibility.Clin Neuropsychol Assess. 2000;1:247–273
22. Taylor HG, Albo VC, Phebus CK, Sachs BR, Bierl PG. Postirradiation treatment outcomes for children with acute lymphocytic leukemia: clarification of risks.J Pediatr Psychol. 1987;12(3): 395–411
23. Pickering S, Gathercole S.Working Memory Test Battery for Children (WMTB-C). London, United Kingdom: The Psychological Corporation; 2001
24. Rey A. L’examen clinique en psychologique dans les cas
d’encephalopathic traumatique.Arch Psychol. 1941;28:286–340
25. Rey A. Psychological examination of traumatic encephalopathy (translation).
Clin Neuropsychol. 1993;7:3–21 26. Anderson P, Anderson V, Garth J.
Assessment and development of organizational ability: the Rey Complex Figure Organizational Strategy Score (RCF-OSS).Clin Neuropsychol. 2001;15(1): 81–94
27. Anderson P, Anderson V, Lajoie G. The tower of London test: validation and standardization for pediatric populations.Child Neuropsychol. 1996; 10(1):54–65
28. Shallice T. Specific impairments of planning.Philos Trans R Soc Lond B Biol Sci. 1982;298(1089):199–209
29. Gioia GA, Isquith PK, Guy SC, Kenworthy L.
Behavior Rating Inventory of Executive Function: Professional Manual. Lutz, FL: Psychological Assessment Resources; 2000
30. Congalton AA.Status and Prestige in Australia. Melbourne, Australia: Cheshire; 1969
31. Wechsler D.Wechsler Abbreviated Scale of Intelligence (WASI). San Antonio, TX: Harcourt Assessment; 1999
32. Carlin JB, Gurrin LC, Sterne JAC, Morley R, Dwyer T. Regression models for twin studies: a critical review.Int J Epidemiol. 2005;34(5):1089–1099
33. Cohen J.Statistical Power Analysis for the Behavioral Sciences. 2nd ed. Hillsdale, NJ: Lawrence Erlbaum Associates; 1998
34. StataCorp.Stata Statistical Software: Release 13. College Station, TX: StataCorp LP; 2013
35. IBM Corp.IBM SPSS Statistics for Windows, Version 20.0. Armonk, NY: IBM Corp; 2011
36. Cheong JLY, Anderson PJ, Roberts G, et al. Contribution of brain size to IQ and educational underperformance in extremely preterm adolescents.PLoS ONE. 2013;8(10):e77475
37. Taylor HG, Minich N, Bangert B, Filipek PA, Hack M. Long-term
neuropsychological outcomes of very low birth weight: associations with early risks for periventricular brain insults.
J Int Neuropsychol Soc. 2004;10(7): 987–1004
38. Nosarti C, Giouroukou E, Micali N, Rifkin L, Morris RG, Murray RM. Impaired executive functioning in young adults born very preterm.J Int Neuropsychol Soc. 2007;13(4):571–581
39. Strang-Karlsson S, Andersson S, Paile-Hyvärinen M, et al. Slower reaction times and impaired learning in young adults with birth weight,1500 g.Pediatrics. 2010;125(1). Available at: www.pediatrics. org/cgi/content/full/125/1/e74
40. Barre N, Morgan A, Doyle LW, Anderson PJ. Language abilities in children who were very preterm and/or very low birth weight: a meta-analysis.J Pediatr. 2011; 158(5):766–774, e1
41. Vohr B. Speech and language outcomes of very preterm infants.Semin Fetal Neonatal Med. 2014;19(2):78–83 42. Jaekel J, Baumann N, Wolke D. Effects of
gestational age at birth on cognitive performance: a function of cognitive workload demands. PLoS ONE. 2013;8(5): e65219
43. Aarnoudse-Moens CSH, Duivenvoorden HJ, Weisglas-Kuperus N, Van Goudoever JB, Oosterlaan J. The profile of executive function in very preterm children at 4 to 12 years.Dev Med Child Neurol. 2012; 54(3):247–253
44. Gallagher C, Burke T. Age, gender and IQ effects on the Rey-Osterrieth Complex Figure Test.Br J Clin Psychol. 2007;46(pt 1): 35–45
45. Jurado MB, Rosselli M. The elusive nature of executive functions: a review of our current understanding.
Neuropsychol Rev. 2007;17(3):213–233 46. Zelazo PD, Carlson SM. Hot and cool
executive function in childhood and adolescence: development and plasticity.
DOI: 10.1542/peds.2014-3188 originally published online March 23, 2015;
2015;135;e826
Pediatrics
W. Doyle and Peter J. Anderson
Searle, Esther Hutchinson, Cinzia De Luca, Mary-Ann Davey, Gehan Roberts, Lex
Alice C. Burnett, Shannon E. Scratch, Katherine J. Lee, Jeanie Cheong, Karissa
Cohort Study
Executive Function in Adolescents Born <1000 g or <28 Weeks: A Prospective
Services
Updated Information &
http://pediatrics.aappublications.org/content/135/4/e826
including high resolution figures, can be found at:
References
http://pediatrics.aappublications.org/content/135/4/e826#BIBL
This article cites 35 articles, 7 of which you can access for free at:
Subspecialty Collections
rning_disorders_sub
http://www.aappublications.org/cgi/collection/cognition:language:lea
Cognition/Language/Learning Disorders
al_issues_sub
http://www.aappublications.org/cgi/collection/development:behavior
Developmental/Behavioral Pediatrics
following collection(s):
This article, along with others on similar topics, appears in the
Permissions & Licensing
http://www.aappublications.org/site/misc/Permissions.xhtml
in its entirety can be found online at:
Information about reproducing this article in parts (figures, tables) or
Reprints
http://www.aappublications.org/site/misc/reprints.xhtml
DOI: 10.1542/peds.2014-3188 originally published online March 23, 2015;
2015;135;e826
Pediatrics
W. Doyle and Peter J. Anderson
Searle, Esther Hutchinson, Cinzia De Luca, Mary-Ann Davey, Gehan Roberts, Lex
Alice C. Burnett, Shannon E. Scratch, Katherine J. Lee, Jeanie Cheong, Karissa
Cohort Study
Executive Function in Adolescents Born <1000 g or <28 Weeks: A Prospective
http://pediatrics.aappublications.org/content/135/4/e826
located on the World Wide Web at:
The online version of this article, along with updated information and services, is
http://pediatrics.aappublications.org/content/suppl/2015/03/17/peds.2014-3188.DCSupplemental
Data Supplement at:
by the American Academy of Pediatrics. All rights reserved. Print ISSN: 1073-0397.