Preterm Birth, Poverty, and
Cognitive Development
Jennifer L. Beauregard, MPH, PhD, a Carolyn Drews-Botsch, MPH, PhD, a Jessica M. Sales, PhD, b W. Dana Flanders, MA, MPH, MD, DSc, a Michael R. Kramer, MS, MMSc, PhDa
BACKGROUND: Preterm birth and childhood poverty each adversely impact children’s
cognitive development and academic outcomes. In this study, we investigated whether the relationships between preterm and early term birth and children’s cognitive scores at 3, 5, and 7 years old were modified by childhood poverty.
METHODS: This study was conducted by using data on singletons born at 24 to 40 weeks’
gestation enrolled in the Millennium Cohort Study in the United Kingdom. Linear regression models were used to test independent and joint associations of gestational age (early or moderate preterm, late preterm, or early term compared with term) and childhood poverty (<60% of median UK income) with children’s cognitive scores. Presence of additive interaction between gestational age and poverty was tested by using interaction terms.
RESULTS: Children born preterm (<37 weeks) or early term (37–38 weeks) tended to score
more poorly on cognitive assessments than children born at term (39–40 weeks). The estimated deficits were ∼0.2 to 0.3 SD for early or moderate preterm, 0.1 SD for late preterm, and 0.05 SD for early term compared with term. Children living in poverty scored 0.3 to 0.4 SD worse than children not living in poverty on all assessments. For most assessments, the estimated effects of the 2 factors were approximately additive, with little or no evidence of interaction between gestational age and poverty.
CONCLUSIONS: Although children born preterm who lived in poverty had the poorest cognitive
outcomes, living in poverty did not magnify the adverse effect of being preterm on cognitive development.
abstract
NIH
Departments of aEpidemiology and bBehavioral Sciences and Health Education, Rollins School of Public Health,
Emory University, Atlanta, Georgia
Dr Beauregard conceptualized and designed the study, conducted the analyses, and drafted the initial manuscript; Drs Drews-Botsch, Sales, Flanders, and Kramer conceptualized and designed the study and critically reviewed the manuscript; and all authors approved the final manuscript as submitted.
DOI: https:// doi. org/ 10. 1542/ peds. 2017- 0509 Accepted for publication Oct 18, 2017
Address correspondence to Jennifer L. Beauregard, MPH, PhD, Department of Epidemiology, Rollins School of Public Health, Emory University, 1518 Clifton Rd, Atlanta, GA 30322. E-mail: jen@ ciaobeau.com
PEDIATRICS (ISSN Numbers: Print, 0031-4005; Online, 1098-4275). Copyright © 2018 by the American Academy of Pediatrics
FINANCIAL DISCLOSURE: The authors have indicated they have no financial relationships relevant to this article to disclose.
FUNDING: Dr Beauregard received support from the Eunice Kennedy Shriver National Institute of Child Health and Human Development (NICHD) of the National Institutes of Health (NIH) T32
WhAt’S KNOWN ON thIS SUbjECt: Being born preterm and being raised in poverty are each linked with worse cognitive and academic outcomes. The authors of several recent studies suggest that children’s early socioeconomic environments may modify the impact of preterm birth on their cognitive development.
WhAt thIS StUDy ADDS: Preterm birth and low socioeconomic status were each independent predictors of poorer cognitive scores in early childhood. The 2 factors acted additively, with little or no evidence for interaction, and children exposed to both fared the worst.
Preterm and early term birth and childhood poverty each adversely impact children’s cognitive development and academic
outcomes.1, 2 Children’s development is a transactional process
influenced by both biological and socioenvironmental factors wherein children grow and respond to stimuli in their environments, which in turn fosters further learning.3 Preterm children may be born with developmentally immature brains because of interruption of fetal brain growth and development, and they are more vulnerable to central nervous system and brain injuries both because of brain immaturity at birth and processes such as infection and inflammation that contribute to preterm deliveries.4 Postnatal processes of brain growth and development are influenced by children’s experiences of sensory enrichment (eg, high quality, high quantity words and conversations) and deprivation (eg, lower-quality parental engagement and infant attachment).5 Children raised in poverty are more likely to experience environmental stressors such as material deprivation, fewer cognitively stimulating experiences, and higher levels of family stress that adversely impact their cognitive development and academic
outcomes.6
Studies of the cognitive and academic outcomes of preterm birth usually treat socioeconomic status (SES) as a confounding factor because it affects both risk of preterm birth and children’s postnatal development. Given that both preterm birth and SES may each affect children’s brain growth and development as well as their resulting cognitive and academic outcomes, it is important to understand the combined and possibly interactive impacts of experiencing both of these exposures. The authors of a few recent studies have examined the question of whether preterm birth has a more
substantial impact on cognitive development in a child living in poverty compared with if she or he had been born into a more affluent environment. These studies have produced mixed results regarding whether early social factors such as parental education, 7, 8 parenting factors, 9 and neighborhood-level deprivation10 modify the adverse impacts of preterm birth on children’s cognitive and academic outcomes.
Testing for the presence of modification of the effect of
gestational age on child development by SES is akin to asking whether the impact of being born preterm is similarly or differently harmful across SES groups. Three general patterns potentially characterize how 2 independent risk factors such as preterm birth and low SES could together impact a health outcome such as cognitive development. To illustrate, imagine that children complete a cognitive assessment with a population mean score of 100 and SD of 15. Assume that children born preterm experience a 15-point score deficit compared with children born at term, and further assume that children living in poverty score 15 points lower than those living in more affluent families. The first pattern is the case of simple additivity: we expect that, on average, a child exposed to both adverse factors (born preterm and in poverty) would experience the sum of the 2 associations for a 30-point deficit compared with a child with neither of the factors (born term and not in poverty). Alternatively, departure from additivity would occur if these doubly exposed children scored, on average, >30 points lower than term children in nonpoor families (supra-additive interaction) or if they scored, on average, <30 points lower than such children (subadditive interaction). Such departures from additivity are plausible. For instance, preterm children may be more
vulnerable to influences of their early life environments in terms of providing resources necessary for cognitive and academic success.11 This hypothesis of supra-additivity would correspond with the impacts of 1 factor (preterm birth) being exacerbated in the presence of a second factor (lower SES setting). It is also possible that childhood poverty exerts such profound effects on cognitive outcomes that being born early may not contribute additional substantial risk.12, 13 This hypothesis of subadditivity would correspond with the effect of preterm birth being attenuated in lower SES settings. In this study, we investigated such interaction between preterm birth and SES in their effects on children’s cognitive outcomes. Specifically, we examined whether household SES modified the relationship between preterm and early term birth and children’s cognitive outcomes at 3, 5, and 7 years old by testing additive interaction between the risk factors.
MEthODS
This study is based on data from the Millennium Cohort Study (MCS), a longitudinal birth cohort study of children born in the United Kingdom in 2000 to 2002 and selected through stratified, clustered sampling of national child benefit records.14, 15 We used data from Sweeps 1 (9 months), 2 (3 years), 3 (5 years), and 4 (7 years) on singletons born at 24 to 40 weeks’ gestation. Children were excluded if they were part of a multiple birth, the 9-month primary family respondent was not the natural mother, gestational age was missing, they were born outside 24 to 40 weeks, their reported birth weight was implausible for gestational age, 16 or a birth defect was reported at the 9-month sweep (Supplemental Fig 2). Gestational age at delivery was calculated on the basis of mothers’
this measure has high validity.17 Gestational age was categorized as early or moderate preterm (24–33 weeks), late preterm (34–36 weeks), early term (37–38 weeks), and term (39–40 weeks).
We measured SES at 9 months old using a poverty indicator for whether the household earned <60% median income (equivalized for household size) relative to other UK households. Given that financial income
represents only a single dimension of household SES, we repeated analyses using a composite measure of parental education, occupation, and income created by using a principal components analysis (see detail in the Supplemental Information). The outcomes of interest were children’s scores on the Bracken School Readiness Assessment-Revised (BSRA-R) and British Ability Scales II (BAS II) naming vocabulary scale at 3 years old; BAS II naming vocabulary, picture similarity, and pattern construction scales at 5 years old; and BAS II word reading and pattern construction scales and the National Foundation for Education Research (NFER) number skills assessment at 7 years old (see detail in the Supplemental Information). Age-standardized t-scores available from MCS were standardized within our study sample to a standard normal distribution (μ = 0, σ = 1) to enable interpretation of groupwise differences in terms of SDs.14, 15 Univariate frequencies and percentages of gestational age, poverty status, and covariates (child’s race and/or ethnicity, child’s sex, number of siblings in the household at 9 months, household structure at 9 months, maternal age at delivery) were computed for the analytic sample at each of the 4 sweeps. The joint distribution of gestational age and SES was described by using mean scores and SDs for the analytic samples stratified into 8 subgroups (4 gestational age
categories × 2 levels of poverty indicator).
We computed differences in cognitive scores between groups for each outcome using generalized estimating equations based on the normal distribution, accounting for clustering of subjects by MCS sample clusters. Sampling weights were not applied in the main analyses because our objective was to obtain internally valid estimates of the relationships between gestational age, poverty, and outcome scores among eligible study subjects rather than ensuring that our estimates were nationally representative. Sensitivity analyses in which sampling weights were used yielded similar results. Main effects models estimated the mutually adjusted independent associations of gestational age and poverty with each cognitive outcome. The presence of additive interaction between gestational age and poverty was tested by assessing the statistical significance of the set of interaction terms by using the generalized score test statistic. Model-predicted scores by gestational age and poverty status were plotted to graphically examine potential modification of the effect of gestational age by poverty status. Analyses were conducted by using SAS version 9.4 (SAS Institute, Inc, Cary, NC). MCS data were obtained from the UK Data Service.14 The Emory University Institutional Review Board determined that secondary analyses of MCS data did not constitute human subjects research and therefore did not require institutional review board review.
RESULtS
Of the 13267 singleton children eligible for our analyses, 10649 (80%) completed the 3-year sweep, 10494 (79%) completed the 5-year sweep, and 9521 (72%) completed the 7-year sweep (Supplemental Fig 2). Approximately 9% were preterm and 25% were early term (Table 1). The
At 7 years old, preterm and early term children scored lower on the word reading and pattern construction scales as well as the NFER number
skills assessment (Table 4). On the word reading scale, adjusted deficits ranged from 0.05 SD (95% CI: 0.01 to 0.10) for early term to 0.19 SD
(95% CI: 0.04 to 0.34) for early or moderate preterm compared with term. On the pattern construction scale, adjusted deficits ranged from 0.10 SD (95% CI: 0.05 to 0.14) for early term to 0.29 SD (95% CI: 0.14 to 0.43) for early or moderate preterm compared with term. Finally, on the NFER number skills assessment, score deficits ranged from 0.06 SD (95% CI: 0.01 to 0.11) for early term to 0.31 SD (95% CI: 0.17 to 0.44) for early or moderate preterm compared with term. Children living in poverty scored roughly 0.3 to 0.4 SD worse on all assessments compared with children who were not living in poverty. The interaction between gestational age and poverty was statistically tAbLE 1 Cohort Characteristics
All Eligible (9 mo) Completed Sweep 2 (3 y) Completed Sweep 3 (5 y) Completed Sweep 4 (7 y)
n (%) n (%) n (%) n (%)
Total 13267 (100.0) 10649 (100.0) 10494 (100.0) 9521 (100.0)
Gestational age
Early or moderate preterm 319 (2.4) 243 (2.3) 241 (2.3) 211 (2.2)
Late preterm 873 (6.6) 686 (6.4) 694 (6.6) 624 (6.6)
Early term 3368 (25.4) 2694 (25.3) 2619 (25.0) 2389 (25.1)
Term 8707 (65.6) 7026 (66.0) 6940 (66.1) 6297 (66.1)
Household poverty
Below poverty level 4964 (37.5) 3686 (34.7) 3656 (34.9) 3202 (33.7)
Above poverty level 8261 (62.5) 6939 (65.3) 6813 (65.1) 6298 (66.3)
Missing 42 24 25 21
Child’s race and/or ethnicity
White 10795 (81.5) 8823 (83.0) 8677 (82.8) 7912 (83.3)
Multiracial 419 (3.2) 318 (3.0) 316 (3.0) 277 (2.9)
Indian 368 (2.8) 292 (2.7) 280 (2.7) 250 (2.6)
Pakistani or Bangladeshi 978 (7.4) 734 (6.9) 719 (6.9) 644 (6.8)
Black or black British 480 (3.6) 323 (3.0) 338 (3.2) 299 (3.1)
Other 206 (1.6) 143 (1.3) 146 (1.4) 121 (1.3)
Missing 21 16 18 18
No. siblings in household
None 5343 (40.3) 4205 (39.5) 4201 (40.0) 3804 (40.0)
1–2 6805 (51.3) 5587 (52.5) 5441 (51.8) 4971 (52.2)
3+ 1119 (8.4) 857 (8.0) 852 (8.1) 746 (7.8)
Household structure
2-parent household 10980 (82.8) 9021 (84.7) 8861 (84.4) 8100 (85.1)
Single mother 2287 (17.2) 1628 (15.3) 1633 (15.6) 1421 (14.9)
Mother’s age at delivery, y
14–17 349 (2.6) 250 (2.3) 258 (2.5) 213 (2.2)
18–19 799 (6.0) 561 (5.3) 561 (5.3) 503 (5.3)
20–24 2549 (19.2) 1891 (17.8) 1879 (17.9) 1669 (17.5)
25–29 3663 (27.6) 2926 (27.5) 2931 (27.9) 2643 (27.8)
30–34 3790 (28.6) 3205 (30.1) 3115 (29.7) 2847 (29.9)
35–39 1829 (13.8) 1573 (14.8) 1516 (14.4) 1428 (15.0)
40+ 286 (2.2) 242 (2.3) 233 (2.2) 217 (2.3)
Missing 2 1 1 1
Child’s sex
Male 6806 (51.3) 5419 (50.9) 5355 (51.0) 4817 (50.6)
Female 6461 (48.7) 5230 (49.1) 5139 (49.0) 4704 (49.4)
tAbLE 2 Associations Between Gestational Age, Household Poverty, and 3-Year Outcomes (Main Effects Models)
BSRA-R BAS II Naming Vocabulary Scale
β (95% CI) β (95% CI)
Gestational age
Early or moderate preterm −.30 (−0.41 to −0.19) −.29 (−0.40 to −0.17) Late preterm −.14 (−0.22 to −0.06) −.07 (−0.15 to 0.00) Early term −.04 (−0.09 to 0.00) −.03 (−0.07 to 0.01)
Term .00 (reference) .00 (reference)
Household poverty
Below poverty level −.40 (−0.46 to −0.35) −.34 (−0.39 to −0.29)
Above poverty level .00 (reference) .00 (reference)
significant for the pattern
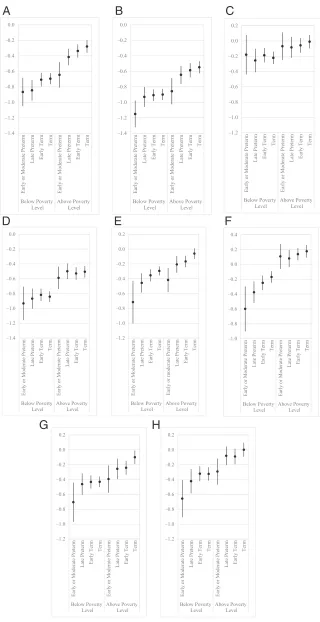
construction scale (P = .04) but not for the word reading scale or the NFER number skills assessment (Fig 1 F–H, Supplemental Tables 8). On the pattern construction scale, among children not living in poverty, those born at early term scored 0.14 SD (95% CI: 0.08 to 0.20) worse than those born at term. Among children living in poverty, on the other hand, there was no significant deficit between early term children and term children (Fig 1G, Supplemental Table 8). Although the interaction chunk test was not significant for the word reading scale, interaction between early or moderate preterm birth and household poverty was statistically significant (P = .02) (Fig 1F, Supplemental Table 8). Among children living in poverty, early or moderate preterm children scored 0.43 SD (95% CI: 0.14 to 0.72) worse than those born at term; contrastingly, there was no association among children living above the poverty line. When measuring SES by using the composite index, however, interaction between gestational age and SES composite index was not significant for any of the 7-year assessments (Supplemental Table 14).
DISCUSSION
Living in a family with low SES was associated with deficits on cognitive assessments at 3, 5, and 7 years old. Being born preterm as compared with term was also independently associated with poorer cognitive assessments. However, for most outcomes, the 2 factors acted additively, each contributing to worse outcomes but with little or no evidence of interaction. Although there was no evidence of effect modification, it is notable that children experiencing both negative exposures were at double jeopardy,
FIGURE 1
demonstrating the lowest cognitive scores. Moreover, the magnitude of estimated effect of poverty was so strong that term children who were living in poverty had lower predicted cognitive scores than preterm children who were not living in poverty.
There were some exceptions at 7 years old to our finding of no statistical interaction between gestational age and poverty, although these findings were no longer statistically significant when we measured SES using the more granular composite index. On the
word reading scale, deficits for early or moderate preterm children were larger among children living in poverty, suggesting that early childhood poverty might exacerbate the impact of early or moderate preterm birth. This finding was in keeping with earlier observations of worsened impacts of prematurity among lower SES children.7, 8, 10, 18 The opposite pattern was observed for the estimated effect of early term birth on pattern construction scale scores, in which we saw a deficit for children living above the poverty level but not for those living in poverty. A potential explanation
for this finding (which is similar to some previous studies12, 13) is that prematurity may not contribute a substantial additional risk of long-term adverse outcomes on top of the adverse impacts of being raised in a lower SES environment.12 For the majority of outcomes in our study, however, the effects of preterm birth on cognitive scores were consistent in magnitude across poverty levels, suggesting that living in poverty neither exacerbated nor attenuated the estimated effects of preterm birth.
Longitudinal studies of cognitive outcomes after preterm birth are mostly limited to follow-up of very preterm children, which have yielded mixed findings suggesting that cognitive deficits associated with very preterm birth may decrease, 19 remain stable, 20 or increase21 as children age. In this study, we or Bangladeshi, white, other), number of siblings in the household (none, 1–2, 3 or more), household
structure (2-parent household, single mother), mother’s age at delivery (14–17, 18–19, 20–24, 25–29, 30–34, 35–39, 40 or more years), and child’s sex (male or female). Predicted scores are based on sample mean covariate values. A, BSRA-R (3 years). B, BAS II Naming Vocabulary Scale (3 years). C, BAS II Picture Similarity Scale (5 years). D, BAS II Naming Vocabulary Scale (5 years). E, BAS II Pattern Construction Scale (5 years). F, BAS II Word Reading Scale (7 years). G, BAS II Pattern Construction Scale (7 years). H, NFER Number Skills Assessment (7 years).
FIGURE 1 Continued
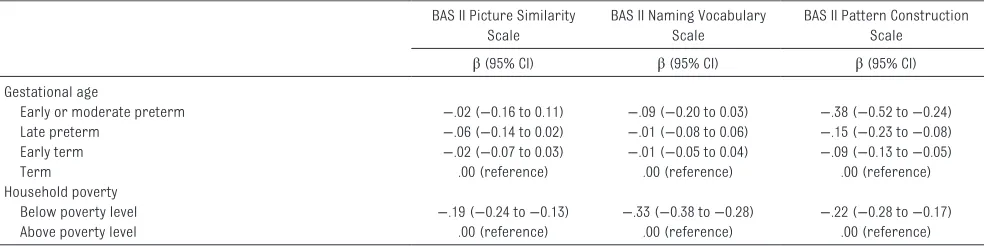
tAbLE 3 Associations Between Gestational Age, Household Poverty, and 5-Year Outcomes (Main Effects Models) BAS II Picture Similarity
Scale
BAS II Naming Vocabulary Scale
BAS II Pattern Construction Scale
β (95% CI) β (95% CI) β (95% CI)
Gestational age
Early or moderate preterm −.02 (−0.16 to 0.11) −.09 (−0.20 to 0.03) −.38 (−0.52 to −0.24)
Late preterm −.06 (−0.14 to 0.02) −.01 (−0.08 to 0.06) −.15 (−0.23 to −0.08)
Early term −.02 (−0.07 to 0.03) −.01 (−0.05 to 0.04) −.09 (−0.13 to −0.05)
Term .00 (reference) .00 (reference) .00 (reference)
Household poverty
Below poverty level −.19 (−0.24 to −0.13) −.33 (−0.38 to −0.28) −.22 (−0.28 to −0.17)
Above poverty level .00 (reference) .00 (reference) .00 (reference)
Cognitive scores are standardized to the normal distribution with a mean of 0 and SD of 1. β coefficients represent SD changes. All models are adjusted for child’s race and/or ethnicity (black, Indian, multiracial, Pakistani or Bangladeshi, white, other), number of siblings in the household (none, 1–2, 3 or more), household structure (2-parent household, single mother), mother’s age at delivery (14–17, 18–19, 20–24, 25–29, 30–34, 35–39, 40 or more years), and child’s sex (male or female).
tAbLE 4 Associations Between Gestational Age, Household Poverty, and 7-Year Outcomes (Main Effects Models)
BAS II Word Reading Scale BAS II Pattern Construction Scale
NFER Number Skills Assessment
β (95% CI) β (95% CI) β (95% CI)
Gestational age
Early or moderate preterm −.19 (−0.34 to −0.04) −.29 (−0.43 to −0.14) −.31 (−0.44 to −0.17) Late preterm −.14 (−0.22 to −0.05) −.11 (−0.19 to −0.03) −.09 (−0.16 to −0.01) Early term −.05 (−0.10 to −0.01) −.10 (−0.14 to −0.05) −.06 (−0.11 to −0.01)
Term .00 (reference) .00 (reference) .00 (reference)
Household poverty
Below poverty level −.37 (−0.43 to −0.31) −.29 (−0.34 to −0.23) −.30 (−0.36 to −0.24)
Above poverty level .00 (reference) .00 (reference) .00 (reference)
examined cognitive outcomes for the same population-based sample at 3 ages (spanning early childhood through the early years of formal schooling), but we were not able to examine cognitive trajectories because no common assessment was repeated at all time points. Children born preterm or at early term consistently scored worse than those born at term on cognitive assessments at ages 3 and 7 years old, but gestational age was a significant predictor of cognitive score for only 1 of the 5-year assessments. With these findings, we suggest that the adverse impacts of preterm or early term birth persist through middle childhood. The lack of gestational age–related deficits on some 5-year assessments may reflect characteristics of the testing instruments because impacts of gestational age on cognitive test performance vary with cognitive workload demands of specific assessments.22 Supporting this possibility is the fact that the magnitude of the effect of poverty on these assessments was also smaller than on the other assessments.
Researchers for some studies have found that relative impacts of perinatal factors and social factors on developmental outcomes change with time, with the influence of social factors becoming more pronounced as children enter and progress through school.23–25 We found, however, that with the aforementioned exceptions at 5 years old, the magnitude of effects observed for gestational age and poverty remained consistent over the 3 assessment ages at ∼0.2 to 0.3 SD for early or moderate preterm children, 0.1 SD for late preterm children, 0.05 SD for early term children, and 0.3 to 0.4 SD for children living in poverty.
A major strength of this study was our use of a large, population-based,
prospective birth cohort study with rigorous follow-up at multiple ages spanning early to middle childhood. Using data from a population-based cohort, however, comes with the caveat that preterm children who were sicker or more impaired may be underrepresented. Within the MCS, cognitive assessments were not administered if the child had a major disability or behavioral problems. In addition, data were not available on whether children accessed early intervention services for special needs. At the time when MCS children were born, the implementation of UK Sure Start programs to provide locally based services such as home visiting, parent support, and support for children with special needs was in its beginning stages. MCS parents were asked whether they had heard of the programs, but not whether they had used them.26 We also were limited to analyses of existing cognitive measures, whereas administering comparable assessments at multiple ages would enable us to analyze longitudinal trajectories in cognitive status. Although our analyses used data from a large sample with consistently high follow-up rates, stratifying by gestational age and poverty or socioeconomic index quintiles resulted in small sample sizes for examining interaction. Although the gestational age distribution remained relatively constant over the 4 sweeps, children who remained in the study at 7 years old were slightly less likely to have lived in poverty at 9 months old than those who dropped out. The 5- and 7-year assessments had high completion rates (≥97%). Children were more likely to be missing scores from the 3-year BSRA-R (11%) and naming vocabulary scale (6%) scores, and missing scores were more likely for children who had been born preterm or early term, who were nonwhite, who were boys, or who were living below the poverty level.
It is possible that our analyses suffer from residual confounding because of the correlation between poverty status and women’s risk of preterm births.27 We measured children’s early socioeconomic environment at 9 months old, but children’s cognitive outcomes may be influenced not only by their own exposure to disadvantaged environments but also by their parents’ and grandparents’
socioeconomic contexts.28
Researchers for future studies should explore potential pathways through which intergenerational processes of poverty and deprivation influence risks of having preterm births as well as potentially modify children’s cognitive trajectories.
Preterm birth and childhood poverty each adversely impacted cognitive outcomes in early childhood, at the age of school entry, and in middle childhood. In the United Kingdom, nearly 30% of births are preterm or early term29, and 30% of children live in low-income households.30 The impacts of the 2 factors acted additively, with little or no evidence for interaction, and children exposed to both fared the worst. Future work in this area should also consider noncognitive measures such as executive function and socioemotional outcomes to more holistically understand the independent and joint impacts of prematurity and poverty on children’s development.
AbbREvIAtIONS
BAS II: British Ability Scales II BSRA-R: Bracken School
Readiness
Assessment-Revised CI: confidence interval
MCS: Millennium Cohort Study NFER: National Foundation for
REFERENCES
1. Institute of Medicine (US) Committee on Understanding Premature Birth and Assuring Healthy Outcomes. In: Behrman RE, Butler AS, eds. Preterm Birth: Causes, Consequences, and Prevention. Washington, DC: National Academies Press (US); 2007. Available at: www. ncbi. nlm. nih. gov/ books/ NBK11362/ . Accessed August 18, 2014 2. Brooks-Gunn J, Duncan GJ. The effects
of poverty on children. Future Child. 1997;7(2):55–71
3. Thompson RA. Development in the first years of life. Future Child. 2001;11(1):20–33
4. Burd I, Balakrishnan B, Kannan S. Models of fetal brain injury, intrauterine inflammation, and preterm birth. Am J Reprod Immunol. 2012;67(4):287–294
5. Stiles J, Jernigan TL. The basics of brain development. Neuropsychol Rev. 2010;20(4):327–348
6. Johnson SB, Riis JL, Noble KG. State of the art review: poverty and the developing brain. Pediatrics. 2016;137(4):e20153075
7. Wang W-L, Sung Y-T, Sung F-C, Lu T-H, Kuo S-C, Li C-Y. Low birth weight, prematurity, and paternal social status: impact on the basic competence test in Taiwanese adolescents. J Pediatr. 2008;153(3):333–338
8. Ekeus C, Lindström K, Lindblad F, Rasmussen F, Hjern A. Preterm birth, social disadvantage, and cognitive competence in Swedish 18- to 19-year-old men. Pediatrics. 2010;125(1). Available at: www. pediatrics. org/ cgi/ content/ full/ 125/ 1/ e67
9. Brown HK, Speechley KN, Macnab J, Natale R, Campbell MK. Mild prematurity, proximal social processes, and development.
Pediatrics. 2014;134(3). Available at:
www. pediatrics. org/ cgi/ content/ full/ 134/ 3/ e814
10. Richards JL, Chapple-McGruder T, Williams BL, Kramer MR. Does neighborhood deprivation modify the effect of preterm birth on children’s first grade academic performance?
Soc Sci Med. 2015;132:122–131 11. Escalona SK. Babies at double hazard:
early development of infants at biologic and social risk. Pediatrics. 1982;70(5):670–676
12. Hack M, Klein NK, Taylor HG. Long-term developmental outcomes of low birth weight infants. Future Child. 1995;5(1):176–196
13. Drews-Botsch C, Schieve LA, Kable J, Coles C. Socioeconomic differences and the impact of being small for gestational age on neurodevelopment among preschool-aged children. Rev Environ Health. 2011;26(3):221–229
14. Connelly R, Platt L. Cohort profile: UK Millennium Cohort Study (MCS). Int J Epidemiol. 2014;43(6):1719–1725 15. Hansen K. Millennium Cohort Study
First, Second, Third, and Fourth Surveys: A Guide to the Datasets. 7th ed. London, United Kingdom: Centre for Longitudinal Studies, Institute of Education, University of London; 2012
16. Alexander GR, Himes JH, Kaufman RB, Mor J, Kogan M. A United States national reference for fetal growth.
Obstet Gynecol. 1996;87(2):163–168 17. Poulsen G, Kurinczuk JJ, Wolke
D, et al. Accurate reporting of expected delivery date by mothers 9 months after birth. J Clin Epidemiol. 2011;64(12):1444–1450
18. Gisselmann M, Koupil I, De Stavola BL. The combined influence of parental education and preterm birth on school
performance. J Epidemiol Community Health. 2011;65(9):764–769
19. Ment LR, Vohr B, Allan W, et al. Change in cognitive function over time in very low-birth-weight infants. JAMA. 2003;289(6):705–711
20. Mangin KS, Horwood LJ, Woodward LJ. Cognitive development trajectories of very preterm and typically developing children. Child Dev. 2017;88(1):282–298 21. O’Brien F, Roth S, Stewart A,
Rifkin L, Rushe T, Wyatt J. The neurodevelopmental progress of infants less than 33 weeks into adolescence. Arch Dis Child. 2004;89(3):207–211
22. Jaekel J, Baumann N, Wolke D. Effects of gestational age at birth on cognitive performance: a function of cognitive workload demands. PLoS One. 2013;8(5):e65219
23. Tong S, Baghurst P, McMichael A. Birthweight and cognitive development during childhood. J Paediatr Child Health. 2006;42(3):98–103 24. Hillemeier MM, Morgan PL, Farkas
G, Maczuga SA. Perinatal and socioeconomic risk factors for variable and persistent cognitive delay at 24 and 48 months of age in a national sample. Matern Child Health J. 2011;15(7):1001–1010
25. Resnick MB, Gueorguieva RV, Carter RL, et al. The impact of low birth weight, perinatal conditions, and sociodemographic factors on educational outcome in kindergarten.
Pediatrics. 1999;104(6). Available at: www. pediatrics. org/ cgi/ content/ full/ 104/ 6/ e74
26. Glass N. Sure Start: the development of an early intervention programme for young children in the United Kingdom.
Child Soc. 1999;13(4):257–264 27. Snelgrove JW, Murphy KE. Preterm
birth and social inequality:
Predoctoral Training Program in Reproductive, Perinatal, and Pediatric Epidemiology under award T32HD052460; and from the Health Resources and Services Administration of the US Department of Health and Human Services under grant T03MC07651. Dr Kramer received support from the Eunice Kennedy Shriver
NICHD of the NIH under award K01-HD074726. The content is solely the responsibility of the authors and does not necessarily represent the official views of the NICHD, NIH, Health Resources and Services Administration, US Department of Health and Human Services, or the US government. Funded by the National Institutes of Health (NIH).
assessing the effects of material and psychosocial disadvantage in a UK birth cohort. Acta Obstet Gynecol Scand. 2015;94(7): 766–775
28. Najman JM, Aird R, Bor W, O’Callaghan M, Williams GM, Shuttlewood GJ. The generational transmission of socioeconomic
inequalities in child cognitive development and emotional health.
Soc Sci Med. 2004;58(6): 1147–1158
29. Office for National Statistics. Birth characteristics. Available at: www. ons. gov. uk/ peoplepopulationa ndcommunity/ birthsdeathsandma rriages/ livebirths/ datasets/
birthcharacterist icsinenglandandwa les. Accessed October 25, 2016
DOI: 10.1542/peds.2017-0509 originally published online December 14, 2017;
2018;141;
Pediatrics
and Michael R. Kramer
Jennifer L. Beauregard, Carolyn Drews-Botsch, Jessica M. Sales, W. Dana Flanders
Preterm Birth, Poverty, and Cognitive Development
Services
Updated Information &
http://pediatrics.aappublications.org/content/141/1/e20170509
including high resolution figures, can be found at:
References
http://pediatrics.aappublications.org/content/141/1/e20170509#BIBL
This article cites 26 articles, 7 of which you can access for free at:
Subspecialty Collections
http://www.aappublications.org/cgi/collection/public_health_sub
Public Health
rning_disorders_sub
http://www.aappublications.org/cgi/collection/cognition:language:lea
Cognition/Language/Learning Disorders
al_issues_sub
http://www.aappublications.org/cgi/collection/development:behavior
Developmental/Behavioral Pediatrics following collection(s):
This article, along with others on similar topics, appears in the
Permissions & Licensing
http://www.aappublications.org/site/misc/Permissions.xhtml
in its entirety can be found online at:
Information about reproducing this article in parts (figures, tables) or
Reprints
http://www.aappublications.org/site/misc/reprints.xhtml
DOI: 10.1542/peds.2017-0509 originally published online December 14, 2017;
2018;141;
Pediatrics
and Michael R. Kramer
Jennifer L. Beauregard, Carolyn Drews-Botsch, Jessica M. Sales, W. Dana Flanders
Preterm Birth, Poverty, and Cognitive Development
http://pediatrics.aappublications.org/content/141/1/e20170509
located on the World Wide Web at:
The online version of this article, along with updated information and services, is
http://pediatrics.aappublications.org/content/suppl/2017/12/12/peds.2017-0509.DCSupplemental
Data Supplement at:
by the American Academy of Pediatrics. All rights reserved. Print ISSN: 1073-0397.