University of Pennsylvania
ScholarlyCommons
Publicly Accessible Penn Dissertations
1-1-2013
Innovation Tournaments: Improving Ideas through
Process Models
Joel O. Wooten
University of Pennsylvania, [email protected]
Follow this and additional works at:
http://repository.upenn.edu/edissertations
Part of the
Business Commons
This paper is posted at ScholarlyCommons.http://repository.upenn.edu/edissertations/722 For more information, please [email protected].
Recommended Citation
Wooten, Joel O., "Innovation Tournaments: Improving Ideas through Process Models" (2013).Publicly Accessible Penn Dissertations. 722.
Innovation Tournaments: Improving Ideas through Process Models
Abstract
Innovation tournaments have a long history of driving progress, especially in the fields of engineering and design, and are once again gaining popularity thanks to advances in technology. Stripped to its essence, an innovation tournament is a process that uncovers exceptionally good opportunities by considering many raw opportunities at the outset and selecting the best to survive. Both the host of the tournament (the
administrator) and the participants (the agents) face many decisions throughout this process. In the following papers, we answer a series of questions about innovation tournaments, addressing the specific managerial challenges of how to provide in-process feedback, how to moderate entry visibility, and how to understand and affect leaps in innovation. We report on two sets of field experiments using web-based platforms for graphic design contests and a unique data set from an online platform dedicated to data prediction
tournaments. The answers to these questions contribute new understanding to the literature on innovation tournaments and offer managers guidance on improving outcomes.
Degree Type Dissertation
Degree Name
Doctor of Philosophy (PhD)
Graduate Group
Operations & Information Management
First Advisor Karl T. Ulrich
Keywords
contest, creativity, idea generation, ideation, innovation tournament, open innovation
Subject Categories Business
! !
Joel Orba Wooten A DISSERTATION
in
Operations and Information Management
For the Graduate Group in Managerial Science and Applied Economics Presented to the Faculties of the University of Pennsylvania
in
Partial Fulfillment of the Requirements for the Degree of Doctor of Philosophy
2013
Supervisor of Dissertation _________________________
Karl Ulrich, Professor, Operations and Information Management
Graduate Group Chairperson _________________________
Eric Bradlow, Vice Dean and Director, Wharton Doctoral Programs
Dissertation Committee
Karl Ulrich, Professor, Operations and Information Management
INNOVATION TOURNAMENTS: IMPROVING IDEAS THROUGH PROCESS MODELS COPYRIGHT
2013
"""! !
"#! !
INNOVATION TOURNAMENTS: IMPROVING IDEAS THROUGH PROCESS MODELS Joel O. Wooten
Karl Ulrich
Innovation tournaments have a long history of driving progress, especially in the fields of engineering and design, and are once again gaining popularity thanks to advances in technology. Stripped to its essence, an innovation tournament is a process that uncovers exceptionally good opportunities by considering many raw opportunities at the outset and selecting the best to survive. Both the host of the tournament (the administrator) and the participants (the agents) face many decisions throughout this process. In the following papers, we answer a series of questions about innovation tournaments, addressing the specific managerial challenges of how to provide in-process feedback, how to moderate entry visibility, and how to understand and affect leaps in innovation. We report on two sets of field experiments using web-based platforms for graphic design contests and a unique data set from an online platform dedicated to data prediction tournaments. The answers to these questions contribute new understanding to the literature on innovation tournaments and offer managers guidance on improving outcomes.
#! !!
!"# #
#
Idea Generation and the Role of Feedback
Table 1: Innovation Tournament Decision Variables and Literature Table 2: Contest Website Comparison
Table 3: Contest Summary Statistics
Table 4: Comparison of Quality between Feedback Treatments Table 5: Comparison of Variation between Feedback Treatments Table 6: Comparison of Productivity between Feedback Treatments
The Impact of Visibility in Innovation Tournaments Table 1. Tournament Characteristics within the Literature Table 2. Inter-rater Reliability of Judges (Krippendorff Alpha) Table 3. Contest Summary
Table 4. Descriptive Statistics and Correlations
Table 5. Comparison of Contest Productivity between Visibility Treatments Table 6. Comparison of Idea Similarity within Contests
Table 7. Comparison of Contest Quality between Visibility Treatments Table 8. Comparison of Contest Variance between Visibility Treatments
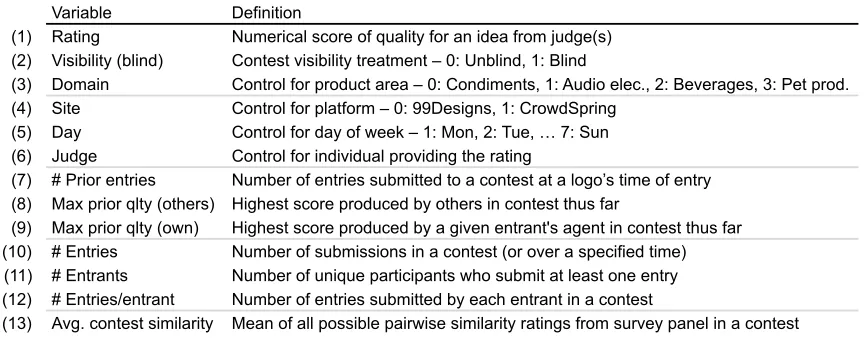
Leaps in Innovation Table 1. Data Definitions Table 2. Descriptive Statistics
!""# #
Idea Generation and the Role of Feedback
Figure 1: Illustrative Examples of Logos Generated Appendix A: Sample Design Briefs – Sports Gear Set Appendix B: Feedback and Rating Validation
Appendix C: Overview of Experimental Design Appendix D: Evolutionary Path of Scored Ideas
The Impact of Visibility in Innovation Tournaments Figure 1. Examples of Logos Generated (sets A and B) Figure 2. Entry Similarity over Time
Figure 3. Submission Quality given Search Landscape Appendix A. Sample Design Briefs
Leaps in Innovation
Figure 1. Sample Kaggle Contest Page Figure 2. Identification of Innovation Leaps
Idea Generation and the Role of Feedback:
Evidence from Field Experiments with Innovation Tournaments
!
"#$%&'()$*&#+
In many innovation settings, ideas are generated over time and managers face a decision
about if and how to provide in-process feedback to the idea generators about the quality of the
ideas submitted. On the one hand, such feedback could help avoid effort wasted exploring
impoverished territory. On the other hand, feedback could over-determine the process, providing
guidance that precludes exploration of unlikely but potentially very valuable directions.
In this paper, we use design contests allowing repeated entry to examine the effect of
in-process feedback on idea generation. We report on a set of field experiments using two online
contest websites for logo design to compare the performance of three different feedback
treatments – no feedback, random feedback, and directed feedback (i.e., in-process feedback
highly correlated with the final quality rating of the entry). In these experiments, we posted six
logo design contests for consumer products and accepted submissions for one week. We provided
daily feedback during the contest period using one of the three treatments. At the conclusion of
the contests, we used a panel of target consumers to rate the quality of each idea. This approach is
unique in its use of real competitions and designers in the experiments.
While feedback can be applied to most types of idea generation processes, we look
specifically at contests or open innovation tournaments. Innovation tournaments have been used for high-profile innovation challenges, including Netflix’s $1M Prize for improved movie
recommendations and the X Prize Foundation’s $10M price for private manned spaceflight.
Despite a growing reliance on innovation tournaments in practice, relatively little research
prescribes how to manage them more effectively. Our research aims to address a specific
managerial challenge – if and how to provide feedback to contestants during the process of
generating ideas. To answer this question, we look at three process parameters from the statistical
view of innovation – average quality, variance in quality, and number of ideas – each of which
We find that the type of feedback is indeed associated with differences in the idea generation
process. Directed feedback is associated with higher average quality than no feedback or random
feedback. We also find that quality improves with cumulative entries. Indeed, in the presence of
directed feedback, quality “ratchets up” in association with the quality of the best prior entry by
others and by the contestant. In the aggregate, the variance in quality of the ideas generated is not
different across the three treatments. However, variance declines as the contest progresses under
directed feedback. Finally, the likelihood that a contestant submits multiple entries increases in
the presence of directed feedback.
!
"##$%&'($#)*$+,#&-.#'/)
Stripped to its essence, an innovation tournament is a process that uncovers exceptionally
good opportunities by considering many raw opportunities at the outset and selecting the best to
survive (Terwiesch and Ulrich 2009). Tournaments accomplish this through a series of steps that
solicit and evaluate entries. Both the host of the tournament (the administrator) and the participants (the agents) face many decisions throughout this process. In the following section, we develop a conceptual model of tournaments and outline the decision variables for the
administrator and agent. We believe this framework is valuable not only in setting up the specific
research question we examine empirically, but—given emerging interest in innovation
tournaments—as a review of the relevant scholarly research in innovation tournaments more
generally.
2.1 A Conceptual Model
The administrator of an innovation tournament encounters a number of decisions, such as the
length of the contest and how many rounds it will entail. Potential agents have their own choices
to make, such as whether to enter and how much effort to invest. We used both bottom-up and
literature on innovation tournaments and listed the decisions used in those papers, whether
explicit or not. In the top-down approach, we considered the temporal flow of a tournament and
what decisions would have to be made over the course of a contest. After combination and
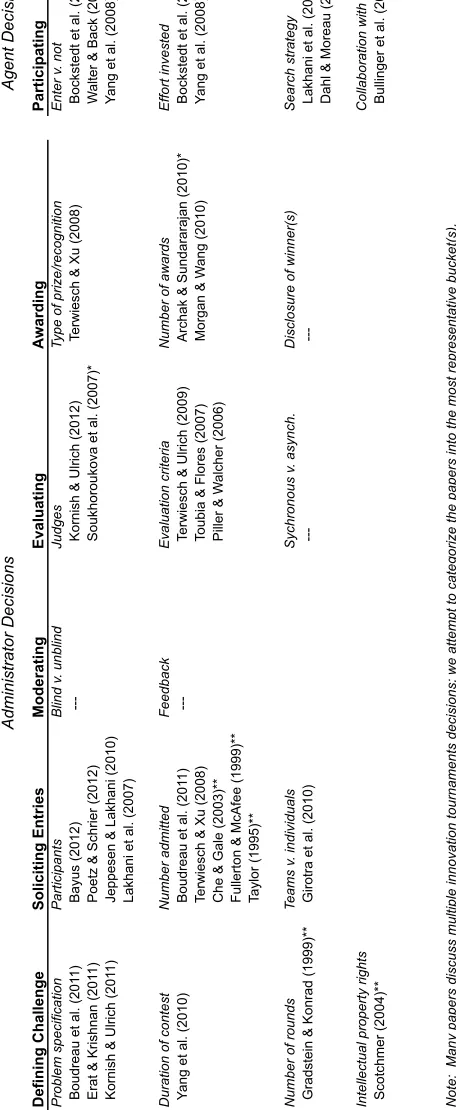
synthesis, nineteen distinct decisions emerged (Table 1). Although we believe these decisions are
mutually exclusive and collectively exhaustive, inevitably the decisions reflect subjective
judgments about groupings and the appropriate level of detail. For example, the problem
specification decision represents several smaller decisions (e.g., problem breadth/scope, degree of
specification, output required, contest platform). Other researchers would likely derive a similar
but certainly not identical set of decisions.
Fundamentally, an innovation tournament works by defining a challenge, soliciting entries,
moderating the contest, evaluating entries, and awarding a winner. In parallel, agents decide if
and how to participate. Table 1 identifies nineteen decision variables for a tournament and divides
them into six categories:
1. Defining Challenge – What does the contest (problem, specification, etc.) look like?
2. Soliciting Entries – Who can participate?
3. Moderating – What is the in-process feedback/information loop?
4. Evaluating – How are entries judged?
5. Awarding – What prize is at stake for the winner(s)?
6. Participating – How does an agent choose to engage (effort, strategy, etc.)?
The nineteen decision variables in six categories serve as a framework for organizing what we
know about innovation tournaments from the prior literature.
2.2 Innovation Tournament Literature
In addition to codifying the innovation tournament decisions, Table 1 also maps the body
of papers that specifically addresses those decisions in the context of innovation tournaments. A
substantial set of papers, largely within the field of economics, relates theoretically to
Ad mi ni st ra to r D eci si on s Ag en t D eci si on s D efi n in g C h al le n g e So lic iti n g En tr ie s Mo d er ati n g Ev al u ati n g Aw ar d in g Pa rti ci p ati n g Pro bl em sp eci fica tio n Pa rt ici pa nt s Bl in d v. u nb lin d Ju dg es Typ e of p rize /re co gn iti on En te r v. n ot Bo ud re au e t a l. (2 01 1) Ba yu s (2 01 2) Ko rn ish & U lri ch (2 01 2) T erw ie sch & Xu (2 00 8) Bo ckst ed t e t a l. (2 01 1) Era t & Kri sh na n (2 01 1) Po et z & Sch rie r (2 01 2) So ukh oro uko va e t a l. (2 00 7)* W al te r & Ba ck (2 01 1)* Ko rn ish & U lri ch (2 01 1) Je pp ese n & La kh an i (2 01 0) Y an g et a l. (2 00 8) L akh an i e t a l. (2 00 7) D ura tio n of co nt est N umb er ad mi tte d F ee db ack Eva lu at io n cri te ria N umb er of a w ard s Ef fo rt in ve st ed Y an g et a l. (2 01 0) Bo ud re au e t a l. (2 01 1) T erw ie sch & U lri ch (2 00 9) Arch ak & Su nd ara ra ja n (2 01 0)* Bo ckst ed t e t a l. (2 01 1) T erw ie sch & Xu (2 00 8) T ou bi a & F lo re s (2 00 7) Mo rg an & W an g (2 01 0) Y an g et a l. (2 00 8) C he & G al e (2 00 3)* * Pi lle r & W al ch er (2 00 6) F ul le rt on & McAf ee (1 99 9)* * T ayl or (1 99 5)* * N umb er of ro un ds Te ams v. in di vi du al s Sych ro no us v. a syn ch . D iscl osu re o f w in ne r(s) Se arch st ra te gy G ra dst ei n & Ko nra d (1 99 9)* * G iro tra e t a l. (2 01 0) L akh an i e t a l. (2 00 7) D ah l & Mo re au (2 00 2) In te lle ct ua l p ro pe rt y rig ht s C ol la bo ra tio n w ith ri va ls Sco tch me r (2 00 4)* * Bu lli ng er et a l. (2 01 0) N ot e: Ma ny pa pe rs di scu ss mu lti pl e in no va tio n to urn ame nt s de ci si on s; w e at te mp t t o ca te go rize th e pa pe rs in to th e mo st re pre se nt at ive b ucke t(s). *I nf orma tio n Syst ems lit era tu re , * *Eco no mi cs lit era tu re
literature on relative performance and incentives of contests in a variety of domains (i.e., Lazear
and Rosen 1981, Holmstrom 1982, Casas-Arce and Martínez-Jerez 2009). Given that the
economics literature has been summarized elsewhere, and that in most cases the links to
innovation tournaments are somewhat tangential, we exclude those papers from the table.
2.3 Decision Variables
Contests have been shown to be effective platforms for innovation (Terwiesch and Xu 2008,
Terwiesch and Ulrich 2009). The reduction in effort from any one participant that results from
increased competition and negative incentive effects (Taylor 1995, Fullerton and McAfee 1999,
Che and Gale 2003) can be offset by a larger participant pool and the positive effect of parallel
exploration (Terwiesch and Xu 2008). Boudreau et al. (2011) empirically show these two effects
to be of comparable magnitudes, with the biggest upside occurring in cases of problem
uncertainty. Given that a tournament will be used, the first category of decisions facing an
administrator is Defining Challenge. The prior literature shows that higher uncertainty problems
mitigate the negative effect of lots of competitors (Boudreau et al. 2011), under-specifying a
problem can be optimal (Erat and Krishnan 2011), and the size of solution spaces can be
quantified (Kornish and Ulrich 2011). Yang et al. (2010) analyze broad contest characteristics
from TaskCN.com and determine that lengthier project specifications delay submissions – but
attract the same number of agents – and that doubling project duration increases participation by
34%. Preliminary work has also looked at the considerations for multiple rounds (Gradstein and
Konrad 1999) and patents in prize contests (Scotchmer 2004).
An administrator’s decisions within the Soliciting Entries category influence the types of
solvers and specific individuals who participate. In a study of 166 science contests from
InnoCentive.com, decisions around breadth of solicitation and level of expertise revealed the
2010)1. Girotra et al. (2010) examine group structures and find that individual-hybrid groups are
better able to generate and filter ideas than pure teams.
When moderating an innovation tournament, the administrator faces the decision of whether
or not to allow participants to see the submissions of their rivals (i.e., blind v. unblind). To our
knowledge there has not been prior published research on this question. The administrator also
faces a decision on the nature of the in-process feedback provided to the agents in response to
their submissions. This decision is the focus of our empirical study, and we discuss the related
literature in greater detail in Section 3.
Within the Evaluating category, we know that surveys of consumers appear more reliable than expert evaluations (Kornish and Ulrich 2012); Soukhoroukova et al. (2007) propose using
idea markets as an alternative to either experts or participants. In terms of the criteria used, the
best performing schemes are those that focus on potentially misclassified ideas and avoid
dismissing ideas too quickly (Toubia and Flores 2007). Kornish and Ulrich (2012) further
characterize a method for evaluating the performance of an idea selection process.
In terms of Awarding, Terwiesch and Xu (2008) demonstrate that performance-contingent
awards can offset agent underinvestment better than fixed-price awards. With risk-neutral agents,
administrators should allocate one prize; with risk-averse agents, multiple prizes can be optimal
(Archak and Sundararajan 2009).
In contrast to the decisions that a tournament host faces, agents each face certain
Participating decisions. Natural experiments on LogoMyWay.com show that earlier entrants to unblind contests are more likely to win, as are those with a wider range of entry timing; however,
simply increasing the number of entries does not benefit the agent (Bockstedt et al. 2011). Walter
and Back (2011) and Yang et al. (2008) collect data from other online markets and show varying
1 Lakhani et al. (2007), Bayus (2011), and Poetz and Schrier (2012) complement this view, showing the
levels of agreement in relating contest measures to agent behavior. With regard to how agents
search for successful solutions, analogical thinking (Dahl and Moreau 2002), recombination of
previously-developed expertise (Lakhani et al. 2007), and cooperation among competitors
(Bullinger et al. 2010) can be effective. In one study of 166 scientific problems posted as
innovation contests on the Innocentive website, intrinsic motivation was the leading driver of
performance in the winners (Lakhani et al. 2007).
!
"#$%&'($%')%*$$+,-./%
In-process feedback is a critical component of innovation processes (Kline and Rosenberg
1986). It introduces information signals that steer future development. However, there has been
no prior work focused on feedback in innovation tournaments. One study does raise several
questions around tournament feedback and offers an anecdotal perspective (N=1) on its
importance (Yang et al. 2010) but leaves the questions unanswered. Despite this dearth, there is
some research on feedback in problem solving and contest settings more generally. We turn to
this work to help develop hypotheses about the role of feedback in the innovation tournament
setting.
3.1 Feedback Literature
The type of contest feedback most often studied involves revealing participant skill level in
head-to-head competitions for well-defined tasks (e.g., solving mazes or math problems). In
particular, lab experiments show that while top-performing competitors do well with feedback,
performance – but not effort – deteriorates for the worst-performing competitors as feedback
frequency increases (Bull et al. 1987, Eriksson et al. 2008). In a similar study, Freeman and
Gelber (2009) demonstrate that a greater possibility of a prize dramatically increases the
performance of the bottom half of competitors with full information. In an observational study of
overconfident students getting a good score slacked (Bandiera et al. 2009). These suggest that
individuals getting unexpected, good feedback can increase both effort and performance in
certain contests.
The field of behavioral psychology, while not associated specifically with innovation, has
long studied such responses to stimuli and methods of modifying behavior. In a famous early
example, Skinner (1948) ran a study on pigeons’ responses to rewards in the form of food; the
birds think they are being rewarded for particular actions, so they continue performing and
reinforcing random behaviors (e.g., a head-turn to the left). The feedback in this setting, which
resembles random feedback in our study, reinforces behavior, whether good or bad. More
recently, a meta-analysis covering over 130 psychology studies revealed a heterogeneous effect
of feedback on performance, with overall improved performance but decreased performance in
over one-third of treatments (Kluger and Denisi 1996).
This context-dependent nature of feedback is reinforced by a crowd-sourced survey
experiment from labor economics that finds feedback lowers rates of task reentry and lowers
productivity, except in top performers (Barankay 2011). The negative relationship between
feedback and effort differs from some of the previously mentioned competition contests and
could have negative effects in an innovation tournament.
The management literature addresses the role of feedback and communication in
organizational dynamics. Tjosvold and McNelly (1988) demonstrate that the quality and type of
communication, rather than its frequency, improve organizational innovation – a finding that
supports the theory that interaction, feedback, and access to more information will lead to greater
levels of innovation. Several empirical studies link higher levels of information gathering and
both internal and external group communication with better performance in research and
Communication and idea generation have also been addressed in the social psychology
literature. Highsmith (1978) posits that a lack of meaningful, positive feedback greatly reduces
the rate of idea generation in group sessions. In a simulated study around organizational context,
the average number of ideas combined goes down in the absence of communication. If there is
variability in communication, however, there is no effect on the average number of proposals
combined or on the variance in their quality (Seshadri and Shapira 2003).
In sum, the literature presents us conflicting theories about which effects might dominate in
innovation tournaments. On one hand, the presence and accuracy of feedback could improve the
rate and quality of idea generation, hone the search for a solution, and help avoid effort wasted
exploring impoverished territory. On the other hand, the presence and accuracy of feedback could
over-determine the process, providing guidance that precludes exploration of unlikely but
potentially very valuable directions. To our knowledge, there have been no empirical explorations
of these effects in innovation tournaments.
3.2 Defining Feedback
We focus on the specific innovation tournament setting in which individual agents may
submit ideas repeatedly to an open, unblind, moderated contest. The tournament is open in the
sense that anyone may choose to participate. The tournament is unblind in the sense that all ideas
and feedback are visible to all participants. The tournament is moderated in the sense that the
contest administrator may provide feedback on the quality of submissions. Recall that we
consider three different types of feedback:
1. Directed feedback. Information provided to the agent on the quality of an idea, shortly
after its submission, is highly correlated with the administrator’s quality function, which
is the final determinant of performance.
2. Random feedback. Information provided to the agent on the quality of an idea, shortly
3. No feedback. No information on the quality of an idea is provided to participants.
In most innovation tournaments, overall performance is determined by the quality of the best
ideas – the quality of the ideas in the upper tail of the distribution. Indeed, in open tournaments,
rewards are typically only awarded to the best ideas.
The notion of best is defined by the quality function of the administrator. This function is
rarely an explicit mathematical expression. Sometimes, as with the X-Prize tournaments, testing
of various kinds is used to determine quality. More typically it is a subjective judgment by one or
more evaluators. In most cases, the quality function of the administrator is not arbitrary, but rather
is similar to those of agents knowledgeable about the domain of the tournament. For instance, in
logo design, participating graphic designers are likely to agree to some extent on what is good
design. Despite some shared understanding, the quality function of the administrator is rarely, if
ever, known perfectly.
3.3 Measuring Impact
In order to evaluate the ideas generated in our tournaments, we rely on the statistical view of
innovation. This perspective, in which idea creation is a series of random draws from a
distribution, was developed by Dahan and Mendelson (2001) and then further elaborated by
Girotra et al. (2010). A key insight from this literature is that the success of idea generation in
innovation depends not on the entire body of opportunities identified, but rather on the quality of
the best ideas; the extremes are important, not the average or the norm (March 1991; Dahan and
Mendelson 2001; Terwiesch and Ulrich 2009; Girotra, et al. 2010). Using this framework, Girotra
et al. (2010) showed that the best idea from an idea generation process depends on three process
parameters: the average quality of ideas generated, the variance in the quality of ideas generated,
and the number of ideas generated. Since tournament performance is dictated by extreme values,
submission is not a practical dependent variable in an empirical study. Following in the tradition
of the prior literature, we focus instead on the three process parameters that drive the outcome.
3.4 Impact of Feedback on the Quality of Ideas Submitted
When generating ideas for a moderated tournament allowing repeated entry, individuals
engage in independent, parallel exploration. Each agent has his or her own imperfect understanding of the administrator’s quality function. Agents explore their own landscape of
possibilities, decide which ideas are most promising, develop those ideas, and submit one or more entries. The contest itself provides two sources of ongoing information to participants:
1. The ideas submitted by others, which may illuminate the landscape of possibilities, even absent feedback from the administrator.
2. Feedback from the administrator on the ideas of both the agent and others. The agent is likely to use this feedback to update his or her understanding of the quality function of
the administrator.
Making use of this new information, agents may choose to engage in additional exploration and
to submit additional entries.
The fundamental idea that information can lead to learning is explored in the literature on
mental models. Mental models activate when new information is incorporated into one’s base of
knowledge, resulting in conceptual change. Enrichment occurs in the simple case when consistent
information reinforces the existing framework, and revision happens when the new information is
inconsistent with prior beliefs (Vosniadou 1994). Vosniadou goes on to point out that learning
failures are more likely when revisions are needed, which can produce inconsistencies. This
suggests that feedback schemes that increase the amount of accurate, accretive information will
reduce misconceptions, enhance learning related to the quality function, and thereby improve the
Based on this logic, we would expect agents to learn the most, and therefore produce better
ideas on average, when the administrator provides directed feedback. Furthermore, we would
expect learning failures and relatively lower performance in the face of random feedback. Under
the no-feedback condition, the agents still have new information based on the submissions of
others, which we would expect to enhance learning and therefore average quality. However, we
would not expect agents under this treatment to perform as well on average as with directed
feedback.
Because learning is likely to occur both from information revealed by the entries of others
and from the feedback from the administrator, we also expect that the quality of ideas submitted
by an agent will increase as the agent observes more cumulative entries. Furthermore, we expect
quality to increase as ideas of better quality are revealed, a sort of ratcheting up of quality. So, an
idea of high quality submitted by one agent, by revealing a promising direction for exploration, is
likely to increase the quality of subsequent entries. This ratcheting up in quality is also likely to
play out for individual agents. An individual agent is unlikely to submit ideas that are clearly
inferior to those he or she has submitted previously. We can pose these expectations as the
following testable hypotheses.
Hypothesis 1: The quality of ideas submitted is increasing in the accuracy of the feedback provided, with directed feedback the most accurate, no feedback the next most accurate,
and random feedback the least accurate.
Hypothesis 2: The quality of ideas submitted is increasing in the number of cumulative contest entries.
Hypothesis 3: The quality of ideas submitted is increasing in the quality of the best previous idea submitted by anyone.
3.5 Impact of Feedback on Variance in Quality of Ideas Submitted.
Variance in the quality of ideas submitted could be caused by variance in the skills and
capabilities of the agents (i.e., across-agent variation) and/or by variance in the quality of multiple
ideas submitted by a particular agent (i.e., within-agent variation). Differences in ideas may be
due to differences in the basic approach taken and/or due to differences in the elaboration and
execution of that approach. (In the logo design setting, the same raw idea may be manifest in
ways that vary highly in quality.) We expect that in any open tournament, directed feedback may
lead to a convergence in approaches, as agents seek to imitate the approaches that have worked
for others, which is likely to reduce variance in quality. In the presence of random feedback, we
might expect greater variation in the approaches attempted by agents in an attempt to discover the
administrator’s quality function.
We expect that as individuals construct a more accurate model of quality, variance in quality
across their ideas will decrease. Thus, we would expect less variance in quality under the directed
feedback condition as the number of entries in the contest increases. Whereas under the random
feedback condition, the agent does not know the quality of the submissions and may act on
inaccurate information about quality and so may explore otherwise unlikely directions. These
expectations can be posed as these two hypotheses.
Hypothesis 5: The variance in quality of ideas submitted is lowest under directed
feedback and highest under random feedback.
Hypothesis 6: The variance in quality of ideas submitted decreases under directed
feedback as the number of cumulative entries increases.
3.6 Impact of Feedback on Number of Ideas Submitted
Once an agent has submitted an idea, he or she has the option to submit additional ideas.
Two forces are likely to influence the likelihood of additional submissions. First, engagement
social psychology literature, specifically studies by Highsmith (1978) and Sheshadri and Shapira
(2003), documents increased rates of idea combination and generation in association with
communication and feedback. This finding supports the hypothesis that agents will be less likely
to engage in a tournament with repeated entry under the no feedback treatment. A lack of
feedback may also diminish the sense of community, which seems to be an underlying motivation
in many open innovation settings (Lakhani et al. 2007).
Second, an agent who receives feedback consistent with his or her own understanding of the
quality function is likely to submit additional entries because the agent can be more confident in
his or her own judgments and therefore in the likelihood of selecting ideas for submission that
will be perceived as good. Directed feedback is more likely to result in a perception of the
administrator “getting it” than is random feedback. In the case of random feedback, the agent may
perceive that efforts are wasted and therefore lose motivation to submit.
Integrating these two forces, we would expect the directed feedback treatment to result in the
highest likelihood of repeat submissions. We cannot predict whether random feedback or no
feedback would result in lower rates of submission, as the two forces would act in opposite
directions for these treatments, which leads to this hypothesis.
Hypothesis 7: The incidence of repeat submissions by an individual agent is higher under directed feedback than under no feedback or random feedback.
!
"#$%&'(%)*+,-.%/'0)-We conducted a set of six field experiments comparing the performance of three distinct
treatments – no feedback, random feedback, and directed feedback. We posted three pairs of logo
design competitions with substantially similar problem statements using two online marketplaces
built around design contests, 99Designs and CrowdSpring. After the contests were completed, we
4.1 Platforms
Several online companies have emerged as leaders in the crowd-sourced design market, which allows buyers to solicit projects – such as logo generation – from a community of artists and graphic designers. The administrator creates a contest by posting project specifications and a prize amount, and then receives online submissions from agents (graphic designers in this case). During a contest, the websites permit the administrator to provide several types of feedback to
agents. Feedback can be posted in the form of public comments, private messages, ratings (1 to 5 stars), and entry elimination. After a prescribed time period, the administrator selects a winner
and awards the prize. These websites have proven to be an inexpensive and popular way to gain access to a wide array of creative talent. The two websites used in this experiment were
99Designs and CrowdSpring (Table 2). They are very similar in their implementation, with well-designed and nearly identical user interfaces.
Table 2: Contest Website Comparison
99Designs.com CrowdSpring.com
Designers on website 38,658 27,000+
Average entries per contest 86 77
Minimum contest award $150 $200
Active logo contests 215 76
Note: Website statistics one month prior to experiment
4.2 Contests
A total of three pairs of contests were created as follows.
Crazy Comet Soccer Gear Mexicali BBQ Sauce Bright Bay Toys Supernova Swim Wear South of the Border Salsa Color Cove Games
markets, and brief specifics. Each logo contest was for a new consumer products brand whose
target audience was college-educated U.S. consumers 18-35 years old. The contests in each pair
shared the type of product (sports gear, condiments, and toys/games). An example of the
submitted design briefs is in Appendix A.
4.3 Treatments
The independent variable tested was the degree of feedback that accompanied each design
contest. Feedback was delivered in the form of ratings once per day using a scale of one to five
stars. The star mechanism is well established on these platforms as the signal for how much an
administrator likes a design. For those receiving directed feedback, a panel of independent
feedback judges determined the rating. For those that received random feedback, the rating was
determined by a random number generator according to the probabilities listed in Appendix B. In
the contests receiving no feedback, none of the entries received any ratings. Both websites
algorithmically monitor administrator activity and flag inactive contests. Feedback factors heavily
in this monitoring, so every agent was left a private thank you message, regardless of the
treatment received, in order to ensure that all contests remained in good standing.
In order to provide star ratings for the two contests that received directed feedback, we
recruited six individuals from the target market to act as feedback judges. All feedback judges
were informed that this was an experiment involving logo creation contests and that participation
was voluntary. The overall charge to feedback judges was aligned with the objective given to the
designers – to develop a logo that will be most appealing to college-educated U.S. customers, age
18-35, for the given product. The feedback judges viewed logos daily in a randomized order and
rated them on a 1-to-5 scale in response to the question, To what extent does this logo appeal to
you? The feedback provided under the directed treatment was the average rating expressed as a
4.4 Experiment
We denote the three pairs corresponding to the three product types as A, B, and C. One of
each pair ran on 99Designs and the nearly identical corollaries ran on CrowdSpring, allowing for
each of the three levels of feedback to be tested on each site and against each other in a balanced,
incomplete block design. Designers closely monitor the contests on these websites and frequently
report copyright violations and other such concerns. To deal with such savvy agents and avoid
undermining the outcomes, we carefully constructed the experiment design to utilize two
different website platforms and slightly staggered start dates for the three product sets. The
feedback treatment can be denoted by subscripts (N for none, D for directed, and R for random)
resulting in the following contest layout:
99Designs: !N "D #R
CrowdSpring: !D !R !N
The six contests relied on the standard mechanisms of the websites to entice designers to
participate. Each contest was open to anyone on the respective website, ran for seven days,
received daily feedback (if applicable), and resulted in an award to the winning designer of $200.
All contest entries were visible to the public, so agents could see every submitted logo and any
rating feedback that was received. All experiments were conducted after obtaining approval from
the human subjects committee at the university. An overview of the experiment is illustrated in
Appendix C.
4.5 Evaluation
At the conclusion of the submission phases of the six contests, a total of 624 entries were
generated by 245 designers. Some submissions included multiple logos, while others were
duplicates or near duplicates. An eventual set of 544, whose progression can be seen in Appendix
survey in order to obtain a measure of the quality of each idea. The order of logos in the survey
was randomized for each judge. The 36 judges were representative of the target market for the six
contests – college-educated individuals in the U.S. between the ages of 18 and 35 – and they
evaluated the logos from the perspective of potential consumers. These judges were similar but
distinct from the feedback judges, who provided the daily feedback for the star ratings. All judges
were informed that this was an experiment involving logo creation contests and that participation
was voluntary.
Ideas from the six contests were rated in separate surveys and were completed in groups of
two, corresponding to the product type (e.g., sports gear, condiments, toys/games). To mitigate
order effects, surveys were administered as a balanced, repeated Latin square design in which the
different sequences of surveys (ABC, ACB, BAC, etc.) resulted in each sequence appearing the
same number of times. The surveys were sent in three batches. Each batch contained the matched
pair of contests. Within each pair, half the judges were given the contest from 99Designs first
followed by the one from CrowdSpring; the other half saw them in the opposite order. Within
each individual survey, the logos were presented to each judge in a randomized order. The
question and response choices (on a 1-5 rating scale) were the same for the judges as for the
feedback panel. A threshold of 94 was established as the maximum number of logos to be graded
in any one survey in order to limit surveys to a manageable ten minutes. This cutoff was
established after survey pre-tests on a separate, but similar, group showed deteriorating results in
longer surveys. Only one contest (Bright Bay Toys, with 188 ratable designs) exceeded this
threshold. As a result, each judge rated all of the designs in the other five contests and exactly
half of the designs in the Bright Bay contest. For the Bright Bay surveys, the assignment of
particular logos to judges followed a balanced, repeated Latin square design in which every rater
The judges’ responses to the six surveys provide the raw data for our analysis. The
inter-rater reliability of judges is high. We check this using a Krippendorff alpha test for inter-inter-rater
reliability across the 36 judges. Given the artistic nature of our contests, personal preferences will
yield variation in the judges’ scores, and we observe this with a relatively low degree of
agreement between any two judges (Appendix B). However, if populations have stable
preferences, then a high degree of agreement should be seen in the average quality for each logo
across two sample populations. We compare the average logo scores from our sample of 36
judges to the averages from the survey pre-test of 24 similar judges and obtain a degree of
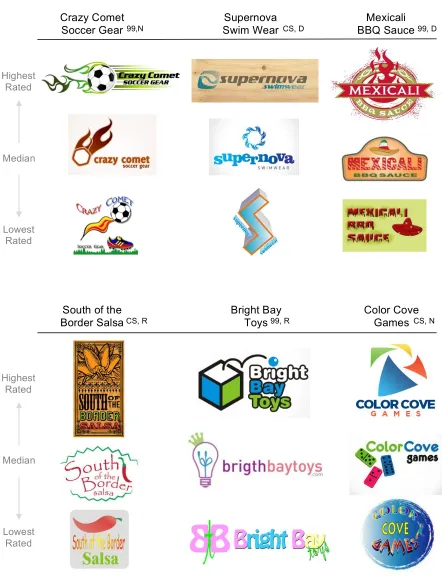
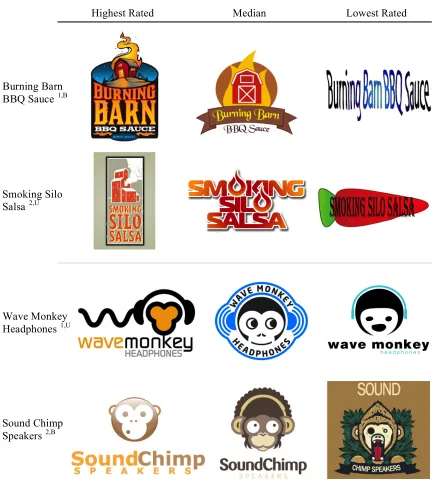
agreement of 0.74, well above commonly accepted thresholds. A sample of the scored logos is
Figure 1: Illustrative Examples of Logos Generated
Crazy Comet Soccer Gear
Color Cove Games Bright Bay
Toys South of the
Border Salsa
Mexicali BBQ Sauce Supernova
Swim Wear
Highest Rated
Lowest Rated
99,N CS, D
CS, R 99, R
99, D
CS, N
99: 99Designs, CS: CrowdSpring; N: no feedback, D: directed feedback, R: random feedback Median
Highest Rated
!
"#$%&'(')$#*)+,'-%.')
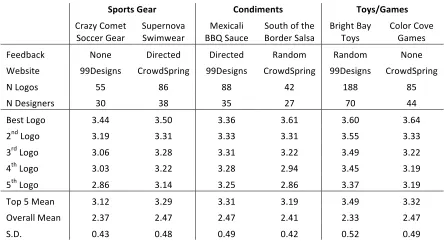
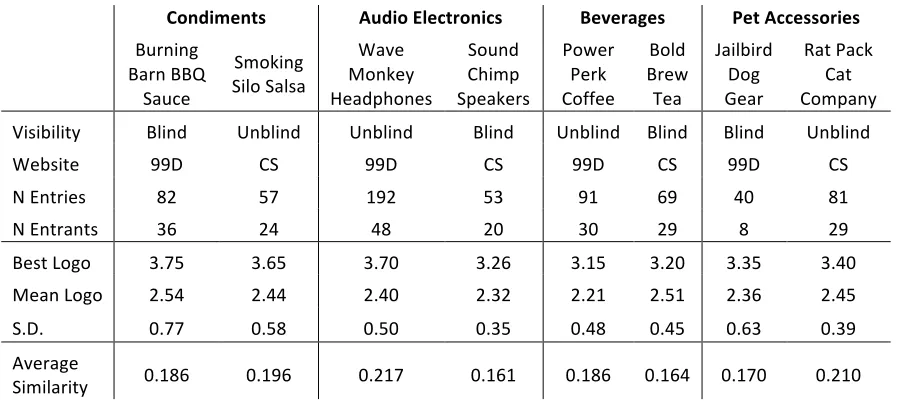
Table 3 provides the summary statistics for the outcomes of each contest. Ideally, we would
want to analyze performance at the level of the overall contest. Unfortunately, because contests
are relatively expensive and logistically challenging, it is not feasible to run a large sample of
distinct contests. Furthermore, the quality of winning submissions will also vary widely because
the winner is the extreme value from a set of candidates – a statistic that exhibits a great deal of
variation. We have just six observations at the level of the contest, and so any differences in
outcomes at the contest level are not likely to be statistically significant. The six contests also
vary in terms of the website they were run on and the types of products, which introduces
confounding effects that cannot be controlled for in a sample of six. Instead we analyze the data
at the level of the entries to the contests, of which there are hundreds, and at the level of judges’
Table 3: Contest Summary Statistics
! !"#$%&'()*$! +#,-./),%&! 0#1&2(*/)&!
! "#$%&!"'()*!
+',,)#!-)$#! +./)#0'1$!+23(2)$#! 778!+$.,)!4)53,$63!!! 7'#;)#!+$6<$!+'.*9!':!*9)! 7#3=9*!7$&!>'&<! "'6'#!"'1)!-$()<! ?));@$,A! B'0)! C3#),*);! C3#),*);! D$0;'(! D$0;'(! B'0)! E)@<3*)! FFC)<3=0<! "#'2;+/#30=! FFC)<3=0<! "#'2;+/#30=! FFC)<3=0<! "#'2;+/#30=!
B!G'='<! HH! IJ! II! KL! MII! IH!
B!C)<3=0)#<! NO! NI! NH! LP! PO! KK!
7)<*!G'='! NQKK! NQHO! NQNJ! NQJM! NQJO! NQJK!
L0;!G'='! NQMF! NQNM! NQNN! NQNM! NQHH! NQNN!
N#;!G'='! NQOJ! NQLI! NQNM! NQLL! NQKF! NQLL!
K*9!G'='! NQON! NQLL! NQLI! LQFK! NQKH! NQMF!
H*9!G'='! LQIJ! NQMK! NQLH! LQIJ! NQNP! NQMF!
>'/!H!4)$0! NQML! NQLF! NQNM! NQMF! NQKF! NQNL!
R1)#$66!4)$0! LQNP! LQKP! LQKP! LQKM! LQNN! LQKP!
+QCQ! OQKN! OQKI! OQKF! OQKL! OQHL! OQKF!
!
ratings of entries, of which there are thousands. The bulk of our analysis examines differences in
the quality, variance, and frequency of individual submissions to the contests with respect to the
feedback treatment and other explanatory variables. In the discussion, we will relate these
process-level results to the implications for overall contest performance.
More specifically, the dependent variable on which most of our analyses are based is the
rating on a 1-to-5 scale of a particular logo by a particular judge. There are 16,200 such
logo-ratings. To test our hypotheses, we regress the logo rating against the variables of interest (e.g.,
feedback treatment) and a set of control variables.
We include controls for the website on which the contest was conducted (the site), the paired
product type (the domain), the time (both the contest day2 and the day of the week), and the
judge. This is to account for any differences in talent across platforms, any differences imposed
by innate product characteristics, and any temporal differences resulting from the day. The
control for the judge captures differences in how judges use the rating scale.
In all cases, the results tables show analyses run for one base case (i.e., omitted variable) –
the directed feedback treatment dummy variable. Pair-wise comparisons of the coefficients for
the non-omitted treatments are left for the discussion. Unless noted, variables are not centered, to
permit easier interpretation of the contest progression from the start of the tournament.
5.1 Effect of Feedback on Quality of Ideas Submitted
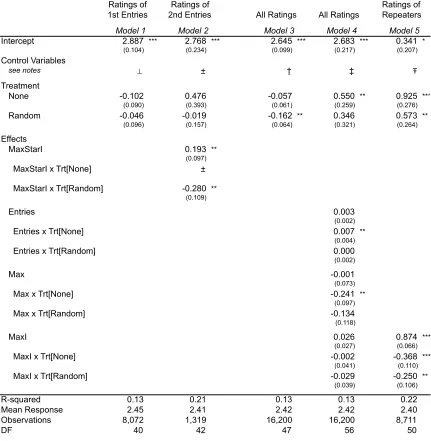
Table 4 shows the results of a regression analysis with logo rating as the dependent variable
and these independent variables: treatment (none, directed, or random), the agent’s best prior
feedback score (MaxStarI), cumulative number of entries, best prior entry by others (Max), and
the agent’s best prior entry (MaxI). Because there are multiple ratings for a single logo we use a
2Contest days are the 24-hour periods corresponding to the seven days that each experiment ran. So
clustered OLS for the analysis when using ratings as the dependent variable.3
Before analyzing our hypotheses, the first question one might ask is whether the feedback
given actually impacts the quality of a designer’s next submission. Model 1 shows that the quality
of first entries (those submitted before getting personal feedback) for all participating designers
doesn’t differ across treatments (N=8,072). This suggests that the populations arriving to these
contests are similar and that feedback treatments do not affect the first submissions. Model 2 then
shows that the judged quality of designers’ second submissions differ, with more stars on first
entries leading to higher-quality second entries under directed feedback and lower-quality second
entries under random feedback.
If our contest setting revolved around a single entrant, then the preceding feedback-quality
improvement link would be sufficient. However, in open, unblinded contests with repeated entry,
a greater level of analysis is needed. Imagine a case where every entrants’ second design was
worse than their first, but each entrants’ first design was better than the first design that came
before it. That would result in a better tournament outcome, despite a failing in the individual
feedback response. So while the answer to the previous question is interesting, it is not
necessarily sufficient in the context of contests.
To test our hypotheses, we return to idea generation as a random draw and test the
differences in quality for distinct submissions. Models 3 and 4 show the analysis for all
logo-ratings (N=16,200). Model 5 shows the analysis only for those logo-logo-ratings associated with a
repeated entry by an agent (N=8711).
When including as explanatory variables only the feedback treatment and the control
variables, directed feedback and no feedback are associated positively and significantly with the
quality of a submission relative to random feedback. (There is no significant difference between
3 If we did not use a cluster correction, our OLS standard error estimates could be biased downward as a
Table 4: Comparison of Quality between Feedback Treatments
!"#$%&'%&(()*+$*+$)+,)-),./0$%/1)+'(2$30.(1&%&,$45$0*'*2$4/(&$3/(&$)($6)%&31&,$7&&,4/38$$ #)'+)7)3/+3&$0&-&0(9$$:$;<=><2$::$;<=<?2$:::$;$<=<>$ $
@*4.(1$30.(1&%&,$(1/+,/%,$&%%*%($')-&+$)+$A/%&+1B&(&($ $ $
!!C*1$()'=9$$6*D/)+2$#)1&$$$$$$$$$$$$$$$$$$$#)'=9$$E.,'&$$$$$$$$$$$$$$$$$$$$$$$$$$$$$$$$@*4.(1$1*9$>(1$()+'0&$&+1%52$F)D&$3*+1%*0($
G$C*1$()'=9$$6*D/)+2$#)1&$$$$$$$$$$$$$$$$$$$#)'=9$$E.,'&$$$$$$$$$$$$$$$$$$$$$$$$$$$$$$$$@*4.(1$1*9$F)D&$3*+1%*0($ !!!!"#$%&'(!)*!+($!#&,!-&,!.&$/%.(!012(3!'/)45!.&$/%.(!*/)6!$7#$!,#8!!
!!!!9&$./#:$%)&!)6%$$.,!0;)!*..,<#:=!7#(!&)!>#?@$#/9!A.B.A(3C!>#?@$#/9!6.#&D:.&$./.,!#/)4&,!-EF-! $$
H$C*1$()'=9$$6*D/)+2$#)1&2$6/5$$$$$$$$$$#)'=9$$E.,'&2$I*+1&(1$6/5$$$$$$$$$@*4.(1$1*9$!%,&%&,$A%*4)1$D*,&02$J$/'&+1($ K$C*1$()'=9$$6*D/)+2$I*+1&(1$6/5$$$$#)'=9$$E.,'&2$#)1&2$6/5$$$$$$$$$$$$$$$@*4.(1$1*9$!%,&%&,$A%*4)1$D*,&0$
L$C*1$()'=9$$I*+1&(1$6/52$6/5$$$$$$$$$$$#)'=9$$E.,'&2$6*D/)+2$#)1&$
Ratings of Ratings of Ratings of
1st Entries 2nd Entries All Ratings All Ratings Repeaters
Model 1 Model 2 Model 3 Model 4 Model 5
Intercept 2.887 *** 2.768 *** 2.645 *** 2.683 *** 0.341 *
(0.104) (0.234) (0.099) (0.217) (0.207)
Control Variables
see notes ! ± † ‡ !
Treatment
None -0.102 0.476 -0.057 0.550 ** 0.925 ***
(0.090) (0.393) (0.061) (0.259) (0.276)
Random -0.046 -0.019 -0.162 ** 0.346 0.573 **
(0.096) (0.157) (0.064) (0.321) (0.264)
Effects
MaxStarI 0.193 **
(0.097)
MaxStarI x Trt[None] ±
MaxStarI x Trt[Random] -0.280 **
(0.109)
Entries 0.003
(0.002)
Entries x Trt[None] 0.007 **
(0.004)
Entries x Trt[Random] 0.000
(0.002)
Max -0.001
(0.073)
Max x Trt[None] -0.241 **
(0.097)
Max x Trt[Random] -0.134
(0.118)
MaxI 0.026 0.874 ***
(0.027) (0.066)
MaxI x Trt[None] -0.002 -0.368 ***
(0.041) (0.110)
MaxI x Trt[Random] -0.029 -0.250 **
(0.039) (0.106)
R-squared 0.13 0.21 0.13 0.13 0.22
Mean Response 2.45 2.41 2.42 2.42 2.40
Observations 8,072 1,319 16,200 16,200 8,711
directed feedback and no feedback.) These results support Hypothesis 1 to the extent that random
feedback is associated with lower quality than either directed feedback or no feedback, although
they do not allow us to distinguish between no feedback and directed feedback.
When including the cumulative entries submitted and the quality of the best of those entries
submitted, a more nuanced association emerges, which is supportive of Hypotheses 2 through 4.
Under the no-feedback condition, the cumulative number of prior entries has a significant
positive association with the quality of a submission. In the presence of feedback (whether
random or directed), the magnitude of this association is significantly lower. An interpretation of
these results is that when there is no feedback, the agent focuses on learning from the prior
submissions to the contest. However, when there is feedback, whether or not it is accurate, the
agent seeks information from the feedback ratings, and thus pays less attention to the prior
entries.
In contests with directed feedback, the best prior entry from anyone (Max) is associated
positively and significantly with the quality of a subsequent entry. One interpretation of this result
is that if feedback is available and accurate, then the quality of prior entries serves as useful
information in improving subsequent submissions. However, if the feedback is random or
nonexistent, then agents are not able even to identify the best prior entries, and therefore cannot
use them effectively as signals.
The last rows of coefficients in Table 4 reflect the role of the agent’s own best prior entry
(MaxI) on the quality of subsequent entries. In the full data set, no effect is significant. However,
the majority of designers submit just one logo. For this reason, we conduct the analysis (Model 5)
for repeat entries only. We find a significant, positive association between an individual’s best
prior entry and their future entries under all three treatments. Of course the main effect can be
interpreted as the skill level of the agent – agents producing one good design are likely to produce
significantly higher association between the quality of the agent’s best prior submission and
subsequent entries under directed feedback than under no feedback or random feedback.
The above results are robust to several approaches with respect to time controls and
regression model. Using just a designer’s first entry in Model 1, instead of averaging all entries
submitted on the first day (before receiving feedback), produces similar results. Models 1 and 2
can introduce time controls, such as contest day and day of the week, although both variables lose
some of their meaning when averaged across entries and were omitted in Table 4. To check
robustness around the analysis of our dependent variable, we use an ordinal probit model and
obtain the same results as shown in Model 3 and Model 4.4 An ordinal model is useful if the
distances between the ratings levels are not equidistant, which does not appear to be the case with
our ratings data.
5.2 Effect of Feedback on Variance in Quality of Ideas Submitted
Table 5 reports the results of an analysis in which the dependent variable is the squared
difference between the average quality rating of an entry and that of the average ratings of all
logos at that time in the contest (N=544).5 This is a measure of variance that accounts for a linear
quality improvement trend over time, which is a prominent feature of these contests.
We again look first at the impact of feedback on an individual’s second submission. Model 6
shows that the variance of a second entry (those submitted after getting personal feedback)
differs, with more stars on first entries leading to higher-variance second entries under random
feedback and lower-variance second entries under directed feedback. Having some understanding
4 While ordered probit models are particularly well suited to ordinal dependent variables, they become
unstable if cells are empty or small. In this case, the crosstab of our categorical and response variables show some empty cells (judge and rating pairs). In addition, the responses, while ordinal in measurement, represent a continuous concept (quality) and there is indication that intervals between the points are approximately equal. For these reasons, we present the OLS model as the primary analysis, whose coefficients are also easier to interpret.
5 We take the squared difference variance calculation from Girotra et al. (2010) and modify it slightly to
Table 5: Comparison of Variation between Feedback Treatments
!"#$%&'%&(()*+$*+$,-./)01$2&30%&+2&2$4.%).0)*+$.0$/*'*$/&4&/5$.267$8*%$6-2'&5$9.(&$:.(&$)($;)%&:0&2$8&&29.:<$ #)'+)8):.+:&$/&4&/(=$$>$?@7A@5$>>$?@7@B5$>>>$?$@7@A$ $
#0.+2.%2$&%%*%($')4&+$)+$C.%&+0D&(&($ $
$
E$!F)00&2$:*+0%*/$4.%).9/&(5$()'+)8):.+0$$ G$!F)00&2$:*+0%*/$4.%).9/&(5$+*0$()'+)8):.+0$
!
H*9-(0$0*=$I)F&$C&%)*2($)+(0&.2$*8$&+0%)&($.($F&.(-%&$*8$:*+0&(0$C%*'%&(()*+J$K-.+0)/&$%&'%&(()*+
Variances of
2nd Entries All Variances All Variances
Model 6 Model 7 Model 8
Intercept 0.260 0.169 *** 0.249 ***
(0.183) (0.055) (0.068)
Treatment
None -0.455 -0.057 -0.184 **
(0.309) (0.042) (0.080)
Random -0.127 -0.030 -0.187 **
(0.163) (0.045) (0.085)
Control Variables
Domain[Condiments] -0.165 -0.002 0.017
-0.133 (0.041) (0.044)
Domain[Toys/Games] -0.028 0.052 0.069
(0.165) (0.045) (0.051)
Site[CrowdSpring] -0.112 -0.015 -0.019
(0.112) (0.030) (0.042)
Contest Day 0.026 0.004 0.013
-0.023 (0.007) (0.019)
Day ! ‡ †
Effects
MaxStarI -0.106
(0.083)
MaxStarI x Trt[None] !
MaxStarI x Trt[Random] 0.192 **
(0.094)
Entries -0.003 *
(0.002)
Entries x Trt[None] 0.003 *
(0.002)
Entries x Trt[Random] 0.003 **
(0.001)
R-squared 0.205 0.03 0.04
Mean Response 0.18 0.23 0.23
Observations 47 544 544
of the effect on feedback on the individual, we now test our hypotheses over the entire contest.
In the aggregate (Model 7), there are not significant differences in variance across the three
treatments, which is not consistent with Hypothesis 5. However, there are significant trends in the
level of variance as a contest progresses. When including number of prior entries as an
explanatory variable (Model 8), there is a decline in variance over time under the directed
feedback treatment. The net effect is that variation under directed feedback is initially higher than
under the other treatments, but becomes lower after about 62 entries. These findings are
consistent with Hypothesis 6. An interpretation of these results is that as entries are submitted
under directed feedback, a consensus emerges as to the direction of the best designs. As this
consensus develops, there is less and less variation in the quality of submissions.
5.3 Effect of Feedback on Number of Ideas Submitted
We hypothesized (H7) that the feedback treatment influences the likelihood that an agent submits
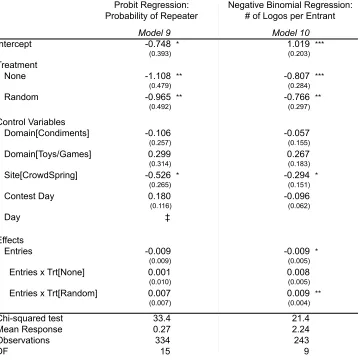
repeatedly to a contest. Model 9 in Table 6 reports on a probit analysis including control variables
and model effects, as well as cohorts, which control for multiple entries from an agent with no
opportunity for feedback. We observe that directed feedback is associated significantly and
positively with agents submitting multiple entries. We observe from this analysis that both
random and no feedback are associated significantly and negatively with agents submitting
multiple entries. This result supports Hypothesis 7. An interpretation of this result is that
designers who receive feedback consistent with reasonable expectations of quality are more likely
to continue to engage in the competition. This feedback may give the agent confidence that he or
she understands the contest and that the administrator is engaged.
We corroborate this finding with a negative binomial regression (Model 10), which is a
generalized Poisson that can accommodate over-dispersed data. The dependent variable is a count
Table 6: Comparison of Productivity between Feedback Treatments!
"#$%&'!#()#(**&$+!$+!#(,(-'&+)!(+'#-+'*.!/&'0!1$0$#'*.!%-*(!1-*(!&*!2&#(1'(3!4((3%-15!
6()-'&7(!%&+$8&-9!#()#(**&$+!$+!1$:+'!$4!+:8%(#!$4!9$)$*!,(#!(+'#-+'.!%-*(!1-*(!&*!2&#(1'(3!4((3%-15! ;&)+&4&1-+1(!9(7(9*<!!=!>?@A?.!==!>?@?B.!===!>!?@?A! !
;'-+3-#3!(##$#*!)&7(+!&+!,-#(+'0(*(*! ! !
C!D8&''(3!1$+'#$9!7-#&-%9(*.!*&)+&4&1-+'!!
E$0$#'!3(4&+(3!-*!-!)#$:,!$4!(+'#&(*!/0(#(!8-F&8:8!(9-,*(3!'&8(!%('/((+!1$+*(1:'&7(!(+'#&(*!&*!G@H!0#*! ;&8&9-#!#(*:9'*!$%'-&+(3!/&'0$:'!1$0$#'*!I-99!BHH!*:%8&**&$+*J!
!
K$#!8$3(9!A?.!L+'#&(*!3(4&+(3!-*!-7(#-)(!9$)$*!&+!1$+'(*'!-1#$**!-+!(+'#-+'M*!*:%8&**&$+*!I*$!-+!-)(+'! /0$!$+9N!*:%8&'*!-'!'0(!%()&++&+)!/$:93!%(!#(,#(*(+'(3!%N!-!9$/!+:8%(#!$4!(+'#&(*J!
Probit Regression: Negative Binomial Regression: Probability of Repeater # of Logos per Entrant
Model 9 Model 10
Intercept -0.748 * 1.019 ***
(0.393) (0.203)
Treatment
None -1.108 ** -0.807 ***
(0.479) (0.284)
Random -0.965 ** -0.766 **
(0.492) (0.297)
Control Variables
Domain[Condiments] -0.106 -0.057
(0.257) (0.155)
Domain[Toys/Games] 0.299 0.267
(0.314) (0.183)
Site[CrowdSpring] -0.526 * -0.294 *
(0.265) (0.151)
Contest Day 0.180 -0.096
(0.116) (0.062)
Day ‡
Effects
Entries -0.009 -0.009 *
(0.009) (0.005)
Entries x Trt[None] 0.001 0.008
(0.010) (0.005)
Entries x Trt[Random] 0.007 0.009 **
(0.007) (0.004)
Chi-squared test 33.4 21.4
Mean Response 0.27 2.24
Observations 334 243
!
"#$%&$$#'())
6.1 Summary of Findings
The hypotheses we pose in Section 3 are largely supported. Directed feedback is associated
positively with the quality of entries. Quality improves with cumulative entries. Quality ratchets
up with the quality of the best prior entry by others and by the agent, in the presence of directed
feedback. In the aggregate, the variance in quality is not different across the three treatments.
However, variance declines as the contest progresses under directed feedback. Finally, the
likelihood that an agent submits multiple entries increases in the presence of directed feedback.
6.2 Implications at Contest Level
While our results are supportive of a theory of the behavior of individual agents in contests,
in general an administrator is concerned primarily with the net result of a contest; how good is the
best entry. Based on the statistical conceptual framework for our work, we can infer that
increasing average quality and increasing the number of submissions from an agent will increase
the quality of the best idea in a contest. These effects are associated with directed feedback. The
quality of the best idea should also increase in the variance in quality of submissions. While we
do not observe statistically significant differences in variance across the three treatments in the
aggregate, there is a reduction in variance over time with directed feedback, which could result in
lower overall performance of the contest. However, the net effect does not appear to be large
enough, in this setting, to warrant omitting feedback altogether or randomizing feedback.
6.3 Limitations
We constructed our experiments to run in close temporal proximity to each other without
being too adjacent within the contest sites. As a result, we began the first set of contests on a
Monday, the second set on a Wednesday, and the third set on a Friday. There could be submission