Research Article
Effect of deficit irrigation and nitrogen
levels on growth and yield of cauliflower
under drip irrigation
Sohail
1, Nangial Khan
2*, Zia Ullah
1, Junaid Ahmad
2, Abdullah Khan
3,
Farooq Nawaz
2and Riaz Khan
11. Department of Water management, The University of Agriculture Peshawar-Pakistan 2. Department of Agronomy, The University of Agriculture Peshawar-Pakistan
3. Department of Horticulture, The University of Agriculture Peshawar-Pakistan
*Corresponding author’s email: nangialkhan@aup.edu.pk
Citation
Sohail, Nangial Khan, Zia Ullah, Junaid Ahmad, Abdullah Khan, Farooq Nawaz and Riaz Khan. Effect of deficit irrigation and nitrogen levels on growth and yield of cauliflower under drip irrigation. Pure and Applied Biology. Vol. 7, Issue 2, pp910-921. http://dx.doi.org/10.19045/bspab.2018.700112
Received: 05/03/2018 Revised: 11/06/2018 Accepted: 22/06/2018 Online First: 29/06/2018
Abstract
A field experiment was conducted to study the effect of deficit irrigation and nitrogen levels on the growth and yield of cauliflower at Agronomy Research Farm, The University of Agriculture Peshawar Khyber Pakhtunkhwa. The experiment was designed as randomized complete block with split plot arrangement having three replications. Four irrigation levels I1, I2, I3 and I4 (100%, 75%, 50% and 25% of Management Allowed Deficit) were applied. Similarly, three nitrogen (N) levels N1, N2 and N3 were applied as 20, 40 and 60 kgha-1 respectively. Results showed that different irrigation levels significantly affected number of leaves per plant, leaf length, leaf weight, plant height, days to curd initiation, Curd maturity, Curd diameter, biological yield, curd yield, water use efficiency and harvest index. Maximum number of leaves per plant (23), leaf length (29 cm), leaf weight (457 g), days to curd initiation (93), curd maturity (16), curd diameter (27 cm), plant height (59 cm), biological yield (50 tons ha-1), curd yield (41 tons ha-1), water use efficiency (210 kgha-1mm-1) and harvest index (8.50 %) were recorded at I
1 irrigation level. Different nitrogen levels had significantly affected leaf length, leaf weight, days to curd initiation, curd maturity, plant height, curd diameter, curd yield, curd weight, water use efficiency and biological yield. Maximum leaf length (26 cm), leaf weight (378 g), plant height (53 cm), days to curd initiation (101), maturity (17), biological yield (47 tons ha-1), water use efficiency (175 kgha-1mm-1) and curd yield (39 tons ha-1) was recorded at 60 kg N ha-1. The above results showed that full irrigation through drip system with nitrogen application of 60 kgha-1 is recommended for higher cauliflower yield.
Keywords: Cauliflower; Drip Irrigation; Nitrogen
Introduction
Cauliflower (Brassica oleracea var. Japanica Snow white) is a member of family brassicaceae. It consists of two Latin words caulis means cabbage and floras means flower. It is also known as the queen of winter vegetables.It is important for its edible part called curd or a bunch of young
flowers. Salad can be prepared from the seedlings of cauliflower.
cauliflower, given the yields about 18.33 tons ha-1 and 0.21 million hectares of yield in 2007-2008 [1]. The production of cauliflower in Khyber Pakhtunkhwa is 21,495 tons over the area of 1,739 hectares, whereas the average yield in Peshawar was recorded 14.25 and 12.73 tons ha-1 in 2000 and 2001 [2].
The seasonal crop water requirements of cauliflower are 380 to 500 mm with an interval of irrigation from 5 to 10 days. The duration of crop is 90 to 120 days, with the depletion of water of 45% is allowable in the root zone of the soil. Cauliflower has a depth of root zone of 0.5 m and an average gross depth of 40 to 60 mm water.
There is a serious need to decrease the water consumption in irrigation by developing new methods and techniques. Drip irrigation is an effective and modern irrigation method having about 90% irrigation efficiency. This system of irrigation increase the total yield up to 30% with a saved volume of water from 50 to 60% compared with conventional irrigation techniques [3]. Farmers are adopting surface irrigation for more than a hundred years which resulted in not only the loss of fertile land due to drainage and water logging but also caused some other problems like leaching of useful fertilizer etc.
Cultivation of crops in soil having water deficit condition is one of the key issues. Less than 500 mm rainfall on 60 % of the land may be associated with degradation cause of crop production [4]. The nitrogen application has more effect on resulting yield of cauliflower instead of other fertilizer because nitrogen is frequently scarce in the soils. If it is properly managed, about 200 to 250 lbs per acre nitrogen is generally required for optimal yield. Nitrogenous fertilizers play an important role for all vegetable crops. Vegetables requires high amount of water and are very sensitive to water deficit condition, which reduce its metabolism and thus resulting less output. The maximum water is required
during the curd developmental stage of cauliflower [5].
Interaction of water and nitrogen for yield is expressed and well documented for many types of vegetables crops. The use of drip irrigation improves the potential of water and nitrogen use efficiency, as well as by plastic mulching which not only helps to control weeds but give more improvements to water use efficiency [6]. Therefore, by increasing the adoption of drip irrigation systems can help to a more viable future for great production.
The main objectives of the study were to find out:
1. Effect of deficit irrigation on growth and yield of cauliflower.
2. Effect of nitrogen levels on growth and yield of cauliflower.
3. Combined effect of deficit irrigation and nitrogen levels on water use efficiency.
Materials and methods
Experiment was laid out in randomized complete block design (RCBD) with split plot arrangement having three replications. The irrigation was selected as main plots while nitrogen applications were chosen as sub plots. An area of 10 m x 5.4 m x 3 (162 m2) having three laterals in three rows containing 72 plants. The crop was planted on October 21, 2014 using a seedling of 30 days old from the primary and nursery beds. The irrigation levels were considered as Factor (A) and nitrogen levels were as Factor (B). Detail of treatments is as follows.
Factor A: Irrigation levels
I1 = 100% of full irrigation (Controlled) I2 = 75% of full irrigation
I3 = 50% of full irrigation I4 = 25% of full irrigation
help of frequency domain reflectometer (FDR).
Factor B: Nitrogen levels
N1 = 20 kgha-1 N2 = 40 kgha-1 N3 = 60 kgha-1
The required amount was applied in three split doses.
Drip irrigation system for the field
Drip irrigation system with spacing between emitters of 0.4 m and laterals spacing 0.45 m was installed before
plantation at the field. The length of each lateral was 10 m. There were 36 numbers of plots.
Irrigation water management Rainfall
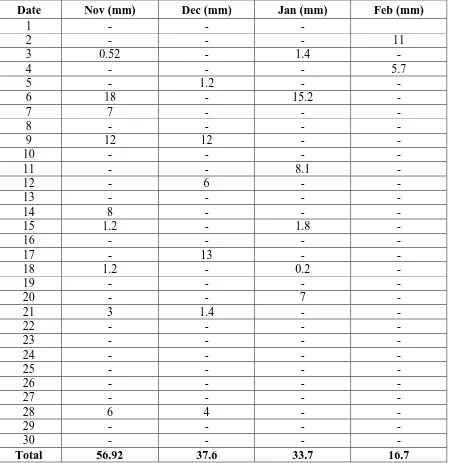
The data about any rainfall event in the study period was taken from the weather station installed at the Agronomy Research Farm, The University of Agriculture Peshawar (Table 1). Rainfall data was recorded in order to adjust the irrigation scheduling during the study period.
Table 1. Rainfall (mm) During the Growing Season of Cauliflower (November, 2014 to February, 2015)
Date Nov (mm) Dec (mm) Jan (mm) Feb (mm)
1 - - -
2 - - - 11
3 0.52 - 1.4 -
4 - - - 5.7
5 - 1.2 - -
6 18 - 15.2 -
7 7 - - -
8 - - - -
9 12 12 - -
10 - - - -
11 - - 8.1 -
12 - 6 - -
13 - - - -
14 8 - - -
15 1.2 - 1.8 -
16 - - - -
17 - 13 - -
18 1.2 - 0.2 -
19 - - - -
20 - - 7 -
21 3 1.4 - -
22 - - - -
23 - - - -
24 - - - -
25 - - - -
26 - - - -
27 - - - -
28 6 4 - -
29 - - - -
30 - - - -
Determination of critical moisture level
The critical moisture content before irrigation was determined by the relation of [8] as follow;
𝜃c = 𝜃𝑓− 𝑀𝐴𝐷(𝜃𝑓− 𝛳𝑝𝑤𝑝)(1) Where,
𝜃c= Critical soil, moisture content (%) by volume
𝜃𝑓 = Soil moisture, at field capacity (%), by volume
𝑀𝐴𝐷 = Management allowed, deficit (%) 𝛳𝑝𝑤𝑝= Soil moisture at permanent wilting point (%) by volume
Determination of irrigation depth
To find the depth to be applied per irrigation, following the relation of [9] as follow;
dx = 10 𝑍(𝜃𝑓− 𝜃𝑖)(2) Where
dx = Maximum net depth to be applied per irrigation (mm)
Ө𝑓= Soil moisture at field capacity (%) by volume
Өi= Soil moisture content at that (ith) day Z = Effective rooting depth (m)
While 10 is the conversion factor.
In drip irrigation system, the whole surface area is not wetted for widely spaced crops, in that case water depth applied wasto be adjusted by the multiplication of the net depth of irrigation with wetted area fractions. However, cauliflower is a crop of closed space, so for achieving the high precision, net irrigation depth to be applied by the relation of [9] as follow;
dn=
𝑑𝑥𝑃𝑤 100(3) Where,
dn= Net depth of irrigation after adjusting for percent wetted area, (mm)
dx= Maximum total depth per irrigation to be applied, (mm)
Pw = Wetted area (%)
Time calculation for full irrigation
Time of irrigation for the experimental plots under full irrigation which was calculated by the relation, [9] as follow;
T = 𝑆𝑝𝑆𝑟𝐷𝑔 𝑁𝑝 𝑞𝑎(4) Where,
T = Time of operation per irrigation in (s) Sp= Spacing between plants (m)
Sr= Spacing between rows (m)
Dg = Gross depth to be applied per irrigation in (m)
Np = Number of emitters plant-1
qa= Average emitter discharge (m3hr-1) Determination of soil moisture content
Soil moisture content was continuously monitored at a very closed interval to determine when to irrigate the crop under full or optimal irrigation. Calibrated frequency domain reflectometer (FDR) was used to determine the soil moisture in the root zone of experimental plots.
75% of the full irrigation (I2)
In quantity 75% of full irrigation was equal to the gross depth applied, time of irrigation was calculated by using the formula of gross depth of irrigation in equation (4).
50% of the full irrigation (I3)
In irrigation level of 50% of full irrigation which was equal to net depth applied, timeof irrigation was calculated by using respective gross irrigation depth in equation (4).
Soil wetted area
In trickle irrigation system, typically water is applied in small amount on frequent basis, maintaining soil water near field capacity, but usually not all the soil surface is wetted, and much of the root zone is not wetted (at least not by design) by the system. It is to be noted that the system is applying water to each individual plant using one emission point per plant so wetted area calculated per emitter was area for plant (33%). The wetted soil area Aw was measured 30 cm bellow the soil surface. For the straight single lateral system, the percent wetted area is computed as follow;
Pw=
𝑁𝑝 𝑆𝑒 𝑊
𝑆𝑝𝑆𝑟 𝑥 10 (5) Where,
Pw = Percentage of soil area wetted (%) Np = Number of emitters plant-1
W = Wetted width at 30 cm depth (m) Se = Emitters spacing (m)
Water Use Efficiency
Water use efficiency (%) of the crop was calculated by following the equation suggested by [10]:
WUE = 𝐶𝑢𝑟𝑑 𝑦𝑖𝑒𝑙𝑑 𝐸𝑇 (6)
Where ‘ET’ is the seasonal
evapotranspiration.
ET was calculated by Cropwat (FAO Penmen-Monteith) method.
Statistical analysis
The analysis of thedata was carried out statistically by using the analysis of variance technique by [11], appropriate for randomized complete block design. Among all the treatments significant differences were found by using the least significant difference (LSD).
Results and discussion Number of leaves
Data about number of leaves plant-1 is shown in (Table 2). Analysis showed that
different levels of irrigation had a significant effect on number of leaves per plant while nitrogen levels and interaction of irrigation and nitrogen levels were found non-significant. In different water deficit levels, the maximum number of leaves plant-1 (23) were recorded at 100% of full irrigation followed by 22 at 75% of full irrigation and 21 at 50% water deficit while the minimum number of leaves plant-1 (20) were recorded at 25% of full irrigation. The number of leaves plant-1 was affected non-significantly by reducing irrigation levels to 75% of full irrigation. However, by reducing irrigation levels to 50% and 25% of full irrigation the number of leaves plant -1 was significantly affected. In drip
irrigation system water is supplied to the root zone of the plant in best way to fulfill the water requirements to give highest number of leaves.
Table 2.Number of leaves, plant-1 of cauliflower, as affected by irrigation, and nitrogen levels
Nitrogen levels
Irrigation levels N1 N2 N3 Mean
I1 22 23 23 23 a
I2 22 21 22 22 ab
I3 20 20 21 21 bc
I4 20 20 21 20 c
Mean 21 21 22
LSD value (at p<0.05) for irrigation, nitrogen and their interaction = 1.58, 1.13 and 2.26 respectively
Leaf length
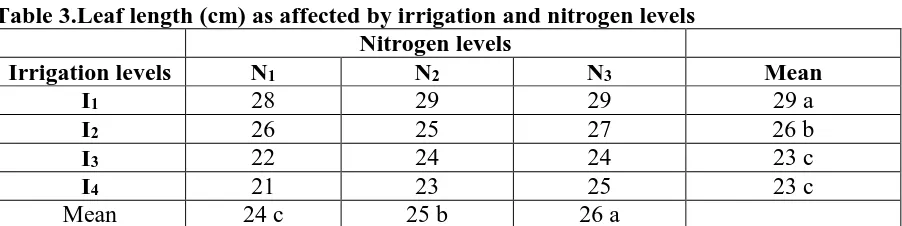
The data about leaf length is shown in (Table 3). Analysis of variance showed that different irrigation water deficit and nitrogen levels had a significant effect on the leaf length of cauliflower. The interaction of irrigation and nitrogen was also found significant. Maximum leaf length (29 cm) was recorded at I1 followed by 26 cm at I2 and 23 cm at water deficit level of I3. The minimum leaf length (23 cm) was recorded at I4 and I3. Out of all nitrogen treatments, the maximum leaf length (26 cm) was recorded at N3 which
maximum at high irrigation and nitrogen levels.
Table 3.Leaf length (cm),as affected by irrigation and nitrogen levels Nitrogen levels
Irrigation levels N1 N2 N3 Mean
I1 28 29 29 29 a
I2 26 25 27 26 b
I3 22 24 24 23 c
I4 21 23 25 23 c
Mean 24 c 25 b 26 a
LSD value, (at p<0.05) of irrigation, nitrogen levels and their interaction = 0.79, 0.48 and 0.97 respectively
Leaves weight
Data regarding the leaves weight as affected by irrigation and nitrogen levels is presented in (Table 4). Statistical analysis showed that different irrigation water deficit, nitrogen levels and their interaction had significant effect on the leaves weight of cauliflower. The maximum leaves weight (457 g) was observed at 100% irrigation followed by 407 g at 75% of full irrigation and 328 g with the application of 50% of full irrigation. The average leaves weight (214 g) was obtained at 25% of full irrigation. In case of nitrogen, the maximum leaves weights of 378, 351 and 326 g were recorded by the application of 60, 40 and 20 kg N ha-1 respectively. Maximum leaves weight of 496 g was recorded at the interaction of 100% of full
irrigation and 60 kg N ha-1 (I1N3). By the reduction of irrigation to 75% of full irrigation at the same level of nitrogen (I2N3), the maximum leaves weight (496 g) recorded which was significantly affected. However, in comparison the leaves weights reduced (472 g) to lesser extent in combination of I1N2. The minimum leaves weight was recorded (181 g) at I4N1 (25% of full irrigation and 20 kg N ha-1). This may due to the low availability of water to the plant. These results are supported by [13] who described that highest leaves weight can be obtained at higher irrigation and higher nitrogen application. In general, the reduction in leaves weights was extensively very large when irrigation was reduced at lowest nitrogen application rate (I1N1 to I4N1).
Table 4.Leaves weight (g) as affected by irrigation and nitrogen levels Nitrogen levels
Irrigation levels N1 N2 N3 Mean
I1 405 472 496 457 a
I2 398 406 419 407 b
I3 319 315 350 328 c
I4 181 212 248 214 d
Mean 326 c 351 b 378 a
LSD value (at p<0.05) for irrigation, nitrogen levels and their interaction = 17.1, 8.86 and 17.7 respectively
Plant height
Data concerning plant height is presented in (Table 5). Analysis of variance showed that plant height was affected significantly by irrigation and nitrogen levels. The value of maximum height of plant (59 cm) was
height in cauliflower at the highest level of irrigation is supported by [14] who reported that the production of fresh vegetables usually requires the application of considerable amounts of irrigation water and nitrogen fertilizer. At 60 kg N ha-1 highest plant height (53 cm) was obtained
which was followed by 52 cm at 40 kg N ha-1 while the lowest plant height of 50 cm at 20 kg N ha-1 was recorded. The other all interactions related to plant heights were found significant. However, the reduction in irrigation from I1 to I2 was not significant at nitrogen application rates of N1 and N3.
Table 5.Plant height (cm),asaffected by different irrigation and nitrogen levels Nitrogen levels
Irrigation levels N1 N2 N3 Mean
I1 57 59 60 59 a
I2 54 55 58 56 b
I3 46 49 51 49 c
I4 43 43 45 44 d
Mean 50 b 52 b 53 a
LSD value (at p<0.05) for irrigation, nitrogen levels and interaction = 2.28, 1.8 and 3.6 respectively
Days to curd initiation
Data about days to curd initiation is presented in (Table 6). Statistical analysis of the data showed that different irrigation and nitrogen levels and the interaction of these two had a significant effect on days to curd initiation. Maximum days to curd initiation (112 days) were recorded at 25% of full irrigation followed by 106 days at 50% of full irrigation which at 75% of full irrigation subsequently shifted to 98 days. The minimum of 93 days was recorded at 100% of full irrigation. Similarly, at low nitrogen level of 20 kg N ha-1 it took 103 days which subsequently changed to 102 days at 40 kg N ha-1. The minimum days to curd initiation 101 was recorded at 60 kg N ha-1. Similar results were reported by [18]
who presented that low amount of water and nitrogen application delay curd initiation. In case of interaction, the maximum days to curd initiation (113 days) were recorded at those plots which were treated to 25% of full irrigation with an application rate of 20 kg N ha-1 followed by 112 days to curd initiation at 25% of full irrigation with an application rate of 40 kg N ha-1. This subsequently reduced to 110 days at 25% of full irrigation with an application rate of 60 kg N ha-1. The lowest days to curd initiation were recorded (93 days) at 100% irrigation having an application rate of 60 kg N ha-1. With high application of irrigation water and nitrogen it took less days to initiate the curd.
Table 6. Days to curd initiation as affected by irrigation and nitrogen levels
Nitrogen levels
Irrigation levels N1 N2 N3 Mean
I1 92 93 93 93 d
I2 100 98 96 98 c
I3 107 106 105 106 b
I4 113 112 110 112 a
Mean 103 a 102 b 101 c
Days to curd maturity
Data pertaining to curd maturity are presented in (Table 7). From analysis of data it was concluded that curd maturity was significantly affected by the application of irrigation and nitrogen. The interactions were also found significant. In mean values of the results, minimum days were recorded to curd maturity (16 days) by 100% of full irrigation applied followed by 18 days at 75% of full irrigation (25% water deficit). However, at 25% of full irrigation it took 25 days to reach maturity. Due to the application of high nitrogen dose it took 17 days to reach maturity which was recorded at 60 kg N ha-1. Higher nitrogen provides strength to the plant for quick maturity as
compared to low nitrogen. Maximum days (20) were recorded to curd maturity at 20 kg N ha-1. The results coincide with [15] who described that the maturity of curd was delayed by decreasing the nitrogen application. Maximum days (25) were recorded to curd maturity at I4N1 followed by 25 days at I4N2 while the lowest number of days (11) was recorded at I2N3. Days to curd maturity wereaffected by the interaction of irrigation and nitrogen. Maximum days (25) were recorded to maturity in case of I4N1, followed by 21 days at I3N1, 20 days at I3N2 while minimum (16 days) were recorded to curd maturity at I1N3 which was the treatment to mature early.
Table 7.Days to curd maturity as affected by irrigation and nitrogen levels
Nitrogen levels
Irrigation levels N1 N2 N3 Mean
I1 17 15 16 16 d
I2 19 18 17 18 c
I3 21 20 17 19 b
I4 25 25 25 25 a
Mean 20 b 19 a 19 a
LSD value, (at p<0.05) of irrigation, nitrogen levels and their interaction = 1.84, 0.63 and 1.27 respectively
Curd diameter
The data regarding curd diameter are shown in (Table 8). Statistical analysis showed that irrigation and nitrogen levels had a significant effect on curd diameter of cauliflower. Maximum curd diameter (27 cm) was recorded at 100% of full irrigation which was followed again by 27 cm at 75% of full irrigation. The curd diameter further reduced to 22 cm at 50% of full irrigation. The minimum curd diameter (16 cm) was recorded at 75% water deficit levels (25% of full irrigation). In the same way, maximum curd diameter (24 cm) was measured at 60 kg N ha-1which was followed by 23 cm at 40 kg N ha-1and the minimum curd diameter of 22 cm was recorded at 20 kg N ha-1. Maximum diameter of curd at N3 of 60 kg N ha-1, may be due to the accumulation of reserve substances in the leaves resulting from
Biological yield
Data concerned to biological yield is shown in (Table 9). The analysis of variance showed that different water deficit and nitrogen levels highly affected the yield of cauliflower as well as the interaction of irrigation and nitrogen was found also significant. According to the data the maximum biological yield (50 tons ha-1) was recorded at 100% of full irrigation, 49 tons ha-1 at 25% water deficit from full irrigation and subsequently biological yield reduced to 44 tons ha-1 at 50% water deficit. The minimum biological yield of 34 tons ha-1 was recorded at 25% of full irrigation. The maximum biological yield of 47 tons ha-1 at 60 kg N ha-1 was obtained and was subsequently 45 tons ha-1 at 40 kg N ha -1.The minimum biological yield of 41 tons
ha-1 was measured at 20 kg N ha-1.
Interaction had also a significant effect on biological yield of cauliflower so its maximum value of 54 tons ha-1 was obtained at I1N3,50 tons ha-1 at I1N2 followed by 50 tons ha-1 at I2N3. The maximum biological yield (32 tons ha-1) was recorded at I4N1 which means that the values obtained at the interaction in high levels of irrigation and nitrogen were more. According to the result it is concluded that drip irrigation system has the ability to improve the biological yield. Thus, maximum production was achieved at the highest irrigation level. Nitrogen is the most essential element for plant, so highest yield were obtained at high level of nitrogen. These findings are supported by [17] who showed that high appropriate apply of irrigation and nitrogen gives high production.
Table 8.Curd diameter (cm),asaffected by different irrigation and nitrogen levels
Nitrogen levels
Irrigation levels N1 N2 N3 Mean
I1 27 27 28 27 a
I2 26 27 28 27 a
I3 20 22 23 22 b
I4 16 16 16 16 c
Mean 22 b 23 b 24 a
LSD value, (at p<0.05) of irrigation, nitrogen levels and their interaction = 0.99, 0.69 and 1.38 respectively
Table 9.Biological yield (tons ha-1), as affected by different irrigation and nitrogen levels Nitrogen levels
Irrigation levels N1 N2 N3 Mean
I1 46 50 54 50 a
I2 47 49 50 49 a
I3 39 47 47 44 b
I4 32 34 37 34 c
Mean 41c 45 b 47 a
LSD value (at p<0.05) of irrigation, nitrogen levels and interaction = 1.8, 1.1 and 2.2 respectively
Curd yield
Data concerned to curd yield is shown in (Table 10). The analysis of variance showed that different water deficit and nitrogen levels showed highly significant effect on the yield of cauliflower. Meanwhile the interactions between
deficit. In case of nitrogen application, the mean highest curd yield (39 tons ha-1) was recorded at 60 kg N ha-1 followed by 37 tons ha-1 at 40 kg N ha-1 while at 20 kg N ha -1 the lowest curd yield (34 tons ha-1) was
recorded. Furthermore, in interactions the highest value of curd yield was recorded (44 tons ha-1) at I4N3 treatment. Subsequently curd yield of 42 tons ha-1 was recorded at I1N2 or I2N3 curd yield of 41 tons ha-1 was obtained at I2N2 while the lowest curd yield (25 tons ha-1) was recorded at the treatment I4N1, which was the lowest application treatment of irrigation and nitrogen. The result showed that at the highest irrigation level maximum
production were achieved. As nitrogen is the most essential element for plant thus high production were obtained at high level of nitrogen. In the present study from the given NPK ratio 17% more yield was obtained when compared to 35 tons ha-1 from surface traditional irrigation system by [18] in Khyber Pakhtunkhwa. The increase in yield was due to the efficiency of drip irrigation system. In Pakistan the production of cauliflower is 36.06 tons ha-1 according to bureau of agricultural statistics of Pakistan. The results were also supported in term of nitrogen by [19] who showed that maximum amount of nitrogen gives high production.
Table 10.Curd yield (tons ha-1), as affected by different irrigation and nitrogen levels Nitrogen levels
Irrigation levels N1 N2 N3 Mean
I1 38 42 44 41 a
I2 39 41 42 41 a
I3 33 41 40 38 b
I4 25 26 28 27 c
Mean 34 c 37 b 39 a
LSD value, (at p<0.05) of irrigation, nitrogen levels and their interaction = 0.96, 0.99 and 1.99 respectively
Water use efficiency
Water use efficiency was determined by dividing the amount of yield obtained by the crop evapo-transpiration of entire growing season of the cauliflower crop. Water use efficiency of the cauliflower crop is given in (Table 11). Statistical analysis indicated that different water deficit levels had a significant effect on the water use efficiency of cauliflower. Nitrogen application and the interaction of irrigation and nitrogen were also found significant. The maximum water use efficiency (201 kg ha-1mm-1) was recorded at I4 irrigation levels followed by 174 and 163 kg ha-1mm -1 at I
3 and I2. However, the minimum water use efficiency (140 kg ha-1mm-1) was recorded at the levels where no deficit was
given (100% of full irrigation). The results showed similarity to [20] who concluded that the water use efficiency (WUE) in his experiment was decreased by increasing amounts of total irrigation water. The mean maximum water use efficiency of 175 kg ha-1mm-1 was recorded at 60 kg N ha-1 and 169 kg ha-1mm-1 at 40 kg N ha-1. The mean minimum water use efficiency 165 kg ha -1mm-1 was also recorded at 20 kg N ha-1. In
Table 11.Water use efficiency (kgha-1mm-1) as affected by irrigation and nitrogen levels
Nitrogen levels
Irrigation levels N1 N2 N3 Mean
I1 137 140 144 140
I2 161 166 162 163
I3 172 167 183 174
I4 192 201 210 201
Mean 165 169 175
LSD value (at p<0.05) for irrigation, nitrogen levels and interaction = 28.7, 6.9 and 13.8 respectively
Harvest index
The data about harvest index is shown in (Table 12). The analysis of variance indicated that different water deficit levels had significantly affected the harvest indices of cauliflower while nitrogen and the interaction between irrigation and nitrogen were found non-significant. According to the data the maximum harvest index 8.50% was recorded at 50% water deficit from full irrigation followed by
8.35% and 8.29% at 25% water deficit and 100% of full irrigation respectively which were mutually non-significant.The minimum harvest index of 7.76% was recorded at 25% of full irrigation which was significantly different than other irrigation levels. The results were similar with [21] who showed that at high levels of nitrogen application rates increases the yield of cauliflower hence shows similarity to the present documents.
Table 12. Harvest Index (%) as affected by irrigation and nitrogen levels
Nitrogen levels
Irrigation levels N1 N2 N3 Mean
I1 8.25 8.40 8.20 8.29 a
I2 8.31 8.35 8.39 8.35 a
I3 8.36 8.61 8.52 8.50 a
I4 7.99 7.65 7.65 7.76 b
Mean 8.23 a 8.25 a 8.19 a
LSD value (at p<0.05) for irrigation = 1.36
Conclusion and recommendations
The irrigation levels significantly affected the number of leaves per plant, leaf length, leaves weight, plant height, curd diameter, biological yield, days to curd initiation, days to curd maturity and curd yield.The different nitrogen levels significantly affected the leaf length, leaves weight, plant height, curd diameter, biological yield and curd yield. The number of leaves per plant, water use efficiency and harvest index were found non-significant.By the reduction in irrigation from full irrigation to 75%, the
(100%) and highest level of nitrogen i.e 60 kgha-1 is recommended for better production of cauliflower while further study need to be carried out to evaluate the most appropriate irrigation and nitrogen levels for the highest production.
Authors’ contributions
Conceived and designed the experiments: Sohail, Z Ullah & N Khan, Performed the experiments: Sohail, N Khan, Analyzed the data: J Ahmad &A Khan, Contributed materials/ analysis/ tools: F Nawaz, Sohail& R Khan, Wrote the paper: N Khan.
References
1. Anonymous (2015). Area and production of major crops, Federal Bureau of Statistics, Statistics division, Government of Pakistan.
2. GOP (2001). Agricultural Statistics of Pakistan. Ministry of National Food Security and research Economic Wing Islamabad.
3. Yadav BS, Singh GR, Mangal JL & Srivastava VK (1993). Drip irrigation in vegetable production. J Agri Res 14(2): 75-82.
4. Deng XP, Shan, Inanaga S&Inoue M (2005). Water-saving approaches for improving wheat production. J Sci Food Agri 85: 1379-1388.
5. Pekarkova E and Zelenina (2007). Veg. Brio. Praha 9: 67.
6. Vázquez N, PardoA, Suso ML & Quemada M (2005). Drainage and nitrate leaching under processing tomato growth with drip irrigation and plastic mulching. Agri Ecosys and Environ 112(4): 313-323. 7. Abraham T (1947). Irrigation Agronomy
Book pp 34-37.
8. Mehdi M, Mir AA, Dwivedi DH, Thakur
SK & Namgyal D (2003). Influence of nitrogen and phosphorus on growth and yield of cauliflower under Ladakh condition. Prog Hort 35(1): 51-54. 9. Keller J & Bliesner RD (1990). Sprinkle
and trickle irrigation. pp 67-78.
10. Huang Y, Chen L, Fu B, Huang Z & Gong J (2004). The vegetables yield and water-use efficiency in the Loess Plateau:
irrigation effects. Agri Water
Manage 72(3): 209-222.
11. Steel & Torrie (1980). Principle and procedures of Statistics. 2nded. New York.
12. Ojetayo AE, Olaniyi JO, Akanbi WB, &Olabiyi TI (2011). Effect of fertilizer types on nutritional quality of two cabbage varieties before and after storage. J Appl Bio Sci 48: 3322-3330.
13. Farooq M, Wahid A, Kobayashi N, Fujita D & Basra SMA (2009). Plant drought
stress: effects, mechanisms and
management. Agro Sustain Dev 29: 185-212.
14. Yu HM, Li ZZ, Gong YS, Mack U, Feger KHS & Tahir K (2006). Water drainage and nitrate leaching under traditional and improved management of vegetable-cropping systems in the North China Plain. J of Plant Nut Soil Sci (169): 47-51. 15. Tiwari KN, Singh A & Mal PK (2003).
Effect of drip irrigation and nitrogen on cauliflower (Brassica oleracea L) under non-mulch condition. Agri Water Manage 8(1): 19-28.
16. Westerveld SM, McDonald MR, Scott-Dupree CD & McKeown AW (2003). Optimum nitrogen fertilization of cauliflower. Acta Hort 6(27): 211-215.
17. Foyer CH, Vanacker H, Gomez
LD&Harbinson J (2002). Regulation of
photosynthesis and antioxidant
metabolism in maize leaves at optimal and chilling temperatures: review. Plant Phy Biochem 40: 659–668.
18. Elahi E, Wali A, Nasrullah G, Ayub, Ahmed S, Huma Z & Ahmed N (2015). Response of cauliflower (Brassica oleracea L. botrytis) cultivars to phosphorus levels. Pure and Appl Biol 4(2): 187-194.
19. Islam MH, ShahebMR, RahmanS, Ahmed
B, Islam ATMT & Sarker PC (2010). Curd yield and profitability of broccoli as affected by phosphorus and potassium. Int J Sustain Crop Prod 5(2): 1-7.
20. Bozkurt S, UygurV, Agca N&Yalcin M (2011). Yield responses of cauliflower (Brassica oleracea L. Var. Botrytis) to different water and nitrogen levels in a Mediterranean coastal area. ActaAgric 61(2): 183-194.