Keywords
Highlights
Abstract
Graphical abstract
216
Research Paper
Received 2018-06-14 Revised 2018-08-17 Accepted 2018-08-18 Available online 2018-08-18
Pervaporation Performance data PERVAPTM membrane
• Permeance and selectivity are also dependent on operating condition.
• Separation performance data for the improved PERVAPTM membranes.
• Tuning the PERVAPTM membrane.
Separation Performance of Improved PERVAP
TMMembrane and Its Dependence on Operating
Conditions
Research and Development Department, DeltaMem AG, Rothausstrasse 61, Muttenz CH-4132, Switzerland
Wilfredo Yave
Article info
© 2019 MPRL. All rights reserved.
* Corresponding author at: Phone: +41 61 463 7002; fax: +41 61 463 7000 E-mail address: [email protected] (W. Yave)
DOI: 10.22079/JMSR.2018.88186.1198
1. Introduction
Since pervaporation and pervaporation membranes started to become
important in industry, the conflicting ways in which separation performance
data is reported, has been an issue for the membrane community. Wijmans and Baker et al. have analyzed in detail this issue and advocated reporting intrinsic membrane properties, i.e. permeability or permeance and selectivity [1-3]. Today, many authors still prefer to report flux (J) and separation factor (β) to characterize and compare the pervaporation membranes. Thus, when
we search newly developed membranes with potential for scaling-up and commercialization, we are faced with separation performance data reported
in different ways, and sometimes, it is tricky to compare with the existing
commercial membranes.
Pervaporation is a simple process but at the same time it is a bit complex to understand the mechanism of separation. That was already noted by Kober, who originated the term pervaporation [4]. For example, one of his theoretical hypotheses was that polymeric membranes for pervaporation should be gel-like (since the membrane in dry state was impermeable), i.e.
he observed the effect of feed nature on membrane performance. However, he did not report a specific performance data to characterize the membranes.
Later, Farber [5] and Heisler et al. [6] reported flux as performance data,
Heisler et al. even presented permeate concentration as performance data.
Journal of Membrane Science & Research
journal homepage: www.msrjournal.com
By using binary ethanol/water mixtures, the separation performance of two improved commercial pervaporation membranes (PERVAPTM) are presented. Separation performance data
are analyzed and compared as a function of operating conditions. The effect of initial feed concentration on the separation performance and the effect of feed concentration on apparent
activation energy are presented. For membranes that swell, we show that permeance values and selectivity are also dependent on operating conditions. In addition, the results show
the importance of initial feed concentration in pervaporation tests. Arbitrary initial feed concentrations lead to different separation performance. Nevertheless, this membrane feature can be used for tuning the final separation performance.
In the sixties, Binning et al. [7, 8] investigated the pervaporation process through several laboratory experiments. They studied the effect of membrane type and operating conditions on membrane separation performance, and reported flux and permeate concentration as performance data. For membrane comparison, they used the same or at least similar operating conditions between experiments. They also described selectivity and separation factor, but those data have not been used to compare the membrane performance.
In the seventies, Paul et al. reported several papers on hydraulic permeation, diffusivity, pervaporation and liquid-polymer interaction in highly swollen polymeric membranes [9-15]. Those reports demonstrated that swollen membranes are not simple to characterize. The works reported by Paul are very important, because in pervaporation most of polymeric membranes work in a swollen state. Later, Mulder et al. [16, 17] noted that although solution-diffusion mechanism takes place in pervaporation membranes, the presence of a third component changes the mechanism of separation due to coupling effects. Consequently, the separation performance of the membrane is also changed. The effect of a third component on membrane separation performance was also reported by Tusel et al. [18], who also suggested that separation factor values cannot be used for membrane comparison.
As described above, various other authors also investigated and analyzed pervaporation membranes and performance data [19-25]. However, until today, there is not any uniformity in the reported data, and thus, we face difficulties identifying a potential membrane for scaling-up.
By using two commercial pervaporation membranes, this paper presents performance data for ethanol dehydration and shows that permeance or normalized flux is also dependent on operating conditions, especially on initial feed concentration. Thus, the membrane comparison by using permeance and selectivity should be also done for the whole feed concentration. These data are important during the plant design, because single performance data are useless.
2. Experimental
2.1. Materials
For the pervaporation tests, two commercial pervaporation PERVAPTM 4100 and 4101 from DeltaMem AG, Switzerland were used. These composite membranes are the improved generation of PERVAPTM membranes [26]. The selective layer based on polyvinylalcohol (PVA) with different degree of cross-linking is coated on a porous support from poly(acrylonitrile) (PAN). This support has an asymmetric pore structure, which is on a woven or non-woven fabric support. The non-non-woven support supplies the mechanical strength and manageability of the membrane.
2.2. Pervaporation experiments and analysis
The pervaporation tests are performed with binary ethanol (laboratory grade) water (distilled) mixtures. The setup includes six pervaporation cells (each of 38 cm2) to allow testing simultaneously of up to three pairs of different membranes. The material (feed) is filled into the feed tank (four liters capacity) and pumped by a pump to the cells. Two heat exchangers maintain a constant feed temperature (95°C) at the entrance of each cell. The feed goes to the cells and the product from the cells is returned to the feed tank as retentate. In the permeate side, a vacuum of 10 mbar is maintained by a vacuum pump.
Permeate samples are collected in a cold trap with a dry ice and ethanol mixture. For each measurement point, the amount of permeate, time, as well as the composition of feed/retentate and permeate samples are collected.
The feed/retentate and permeate composition are determined by Karl-Fisher (KF) and gas chromatography (GC), respectively.
3. Results and discussion
3.1. Permeability or permeance and selectivity
Permeability and selectivity are intrinsic properties of membrane material [27, 28]; these properties are used to compare the separation performance of membranes under certain operating conditions. In gas separation membranes, these two terms, permeability and ideal selectivity (equation 1 and 2) are widely accepted and universally used during the development of new polymeric membranes, i.e. measurements of pure gas permeability on dense thick films. The data are generally presented as a part of membrane characterization when new polymeric membranes are developed.
)
( f p
i i P P l J P (1) j i P P (2)
Pi is the permeability of component i, Ji the flux, l the membrane thickness, Pf
and Pp the partial pressure in feed and permeate, and α the ideal selectivity.
Nowadays, there is even the famous Robeson plot for different gas pairs [29]; hence the authors can compare the membranes. The Robeson plot is very useful when new membranes are being developed.
Because most polymeric membranes for pervaporation swell and present different separation performance in pure and multicomponent mixtures, the permeability of pure components and ideal selectivity are not useful data for further analyses and pervaporation plant sizing.
For industrial applications, asymmetric and composite pervaporation membranes are fabricated instead of dense thick films [26], as well as mixed components (real industrial feedstock) are used for pervaporation pilot tests. Under those conditions, the membrane thickness and permeability values are unknown. Hence, permeance values are calculated to analyze the membrane performance.
Baker et al. [1] recommended calculating and reporting driving force normalized data, i.e. permeance (equation 3) and selectivity. They concluded that these are far more useful data because they are related to intrinsic properties of a membrane. However, they recognized that this pair of performance data (permeance and selectivity) may depend on operating conditions.
)
( f p
i i P P J l P (3)
Before performing pervaporation tests, the range of feed concentration, feed temperature and permeate pressure must be defined from a technical point of view, i.e. considering the real operating conditions at industrial plants. Those data corresponding to operating conditions must be given in the reports; otherwise the reported performance data is not useful.
For dehydration of organic solvents, the azeotropic mixture composition is a practical initial value for the performance data (most pervaporation applications are for breaking azeotropes). This will mean a feed water concentration with one or two percent above the azeotropic mixture composition. For example, for ethanol dehydration, the pervaporation performance data should be reported at least between 0.2 and 5.0 wt.% of water in the feed, unless the membrane is developed for high feed water concentrations.
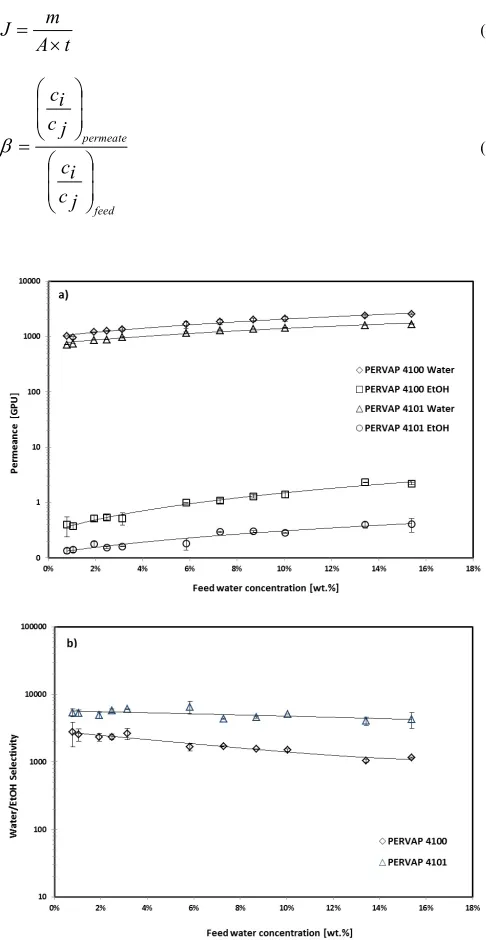
The performance data presented in Figure 1 are obtained under same operating conditions; hence the comparison of these two membranes is valid. The water permeance values for PERVAPTM 4100 are higher (~30%) than those for PERVAPTM 4101 (Figure 1a). This result is explained by the type and degree of cross-linking of these two membranes. Although both membranes are based on PVA, PERVAPTM 4101 is more cross-linked than PERVAPTM 4100, and thus, it exhibits lower permeance values.
In both membranes, the water and ethanol permeance depend on feed water concentration. The water permeance value at high feed water concentration (15 wt.%) is ~140% higher than at low feed water concentration (0.7 wt.%). This water permeance difference (a factor of ~2.4) is attributed to the membrane swelling due to the water content in the feed, i.e. the higher the feed water concentration, the higher the degree of membrane swelling, which results in higher water permeance.
The water/ethanol selectivity of PERVAPTM 4101 is quasi constant (see Figure 1b); while for PERVAPTM 4100 it varies with the feed water concentration. The low selectivity values at high feed water concentration for PERVAPTM 4100 are due to the much higher ethanol permeance (see Figure 1a) than that in PERVAPTM 4101. Because PERVAPTM 4100 is less cross-linked, this membrane swells more than PERVAPTM 4101, and thus, the fractional free volume in the polymer matrix is high for the swollen PERVAPTM 4100. This allows ethanol to permeate through the membrane to a greater extent. Therefore, the selectivity values for PERVAPTM 4100 are lower than those for PERVAPTM 4101 and vary between 1000 and 3000 (i.e. it is feed water concentration dependent), while for PERVAPTM 4101 it is 5000 approximately for the whole feed water concentration.
performance of membranes.
The analysis done by using Figure 1 is a typical and simple analysis for pervaporation membranes, and one may conclude that PERVAPTM 4101 is better than 4100 because it has high selectivity, or PERVAPTM 4100 is better because of its higher water permeance. Now, a question arises: which permeance and selectivity value should be reported to compare the performance of these two membranes? One may calculate an average value or choose the highest values. As seen in Figure 1, these two options may not be the appropriate, because the permeance data are concentration dependent. Thus, reporting a single permeance data for membrane comparison may lead to wrong conclusions.
An additional issue that must be also considered when reporting permeance and selectivity is the data treatment, i.e. the use of different tools and approaches to calculate and obtain the permeance values. Unreliable data base, wrong assumptions and small mistakes during the simulation or calculation may lead to erroneous results.
3.2. Flux and separation factor
Flux is a raw data (equation 4), and separation factor is an arbitrary definition that is obtained from raw data too (equation 5).
t
A
m
J
(4)
j
c
i
c
j
c
i
c
feed permeate
(5)Fig. 1. (a) Water and ethanol permeance, and (b) water/ethanol selectivity for the membranes PERVAPTM 4100 and 4101. Operating conditions: Tfeed=95°C and
Ppermeate=10mbar (Tcondenser= -72°C).
where, m is the amount of permeate, A the membrane area, t the time interval to collect m, and ci and cj the faster and slower permeating component
concentration, respectively.
Although these performance data are not normalized for driving force, they can be used in a more useful way if the full operating conditions are properly reported, i.e. range of feed concentration, operating temperature and permeate pressure. However, these performance data must not be used to compare different membranes, as concluded by Baker [1] and Wijmans [3] and supported by other authors [19-25].
Figure 2 presents flux and separation factor for the same data presented in Figure 1. By analyzing the flux values (see Figure 2a), one can conclude that the water flux is a function of feed water concentration, and PERVAPTM 4100 has higher flux than PERVAPTM 4101. This conclusion is like the permeance data analysis. However, the flux values variation between low and high feed water concentration is much higher (a factor of ~32) than that for permeance data (a factor of ~2.4). Thus, reporting flux without feed water concentration and operating conditions, or without normalizing for driving force lead to incorrect analysis and conclusions.
Fig. 2. (a) Water and ethanol flux, and (b) separation factor for the membrane PERVAPTM 4100 and 4101. Operating conditions: T
feed=95°C and Ppermeate=10mbar
(Tcondenser=-72°C).
The separation factor values (see Figure 2b) also vary as a function of feed water concentration. For PERVAPTM 4100 it varies from 800 to 3000 and for PERVAPTM 4101 from 3000 to 5000. Therefore, for membrane comparison, one must perform the pervaporation tests under the same operating conditions and report this pair of performance data as a function of whole feed water concentration.
Now, the question posed above (in section 3.1) is even more difficult to answer. One might report and highlight the highest values of flux and separation factor. So, for PERVAPTM 4100 one may conclude that the membrane has a water flux of 2700 g/m2h and a separation factor up to 3000. However, this conclusion can wrongly be understood if the operating conditions and full raw data are not reported.
factor accompanied by full raw data and operating conditions [30-32]. That is good as a starting point.
3.3. Flux and permeate concentration
Instead of reporting separation factor, permeate concentration is more useful as raw data. When flux, permeate concentration and operating conditions are reported, the authors have the possibility of calculating the permeance and selectivity values by themselves. Thus, the analysis and comparison of membrane performance becomes simpler. In addition, permeate concentrations show the quality of permeates as a function of feed water concentration. The permeate concentrations are very important data during the industrial plant sizing, since it defines the further process for permeate recycling.
The water concentration in the permeate is almost the same for both membranes, PERVAPTM 4100 and 4101 (see Figure 3), only below 2 wt.% of feed water concentration they are a bit different. So, in terms of permeate quality, one may conclude that both membranes are similar. Nevertheless, as described above, the difference between these two membranes is the type and the degree of cross-linking, which makes them different.
Fig. 3. Water flux and permeate concentrations for the membrane PERVAPTM 4100
and 4101; Operating conditions: Tfeed=95°C and Ppermeate=10mbar (Tcondenser=-72°C).
Since permeance and selectivity are calculated from raw data, the best choice regarding raw experimental data, would be flux and permeate concentration as a function of feed water concentration (see Figure 3). The readers or authors now have the advantages of using the raw data for further analyses. Nevertheless, the feed temperature and permeate pressure must be also reported. Without these additional data, one cannot calculate the permeance and selectivity values.
3.4. Effect of initial feed water concentration on membrane performance
The effect of feed water concentration and the effect of initial feed water concentration on the membrane performance are not the same. The first was already discussed (Figures 1, 2 and 3), where all plots show the effect of water concentration on membrane separation performance. The second, i.e. the initial feed water concentration was 16 wt.% for the data presented above. Now, we will show that for membranes that swell, different initial feed water concentrations result in different separation performance.
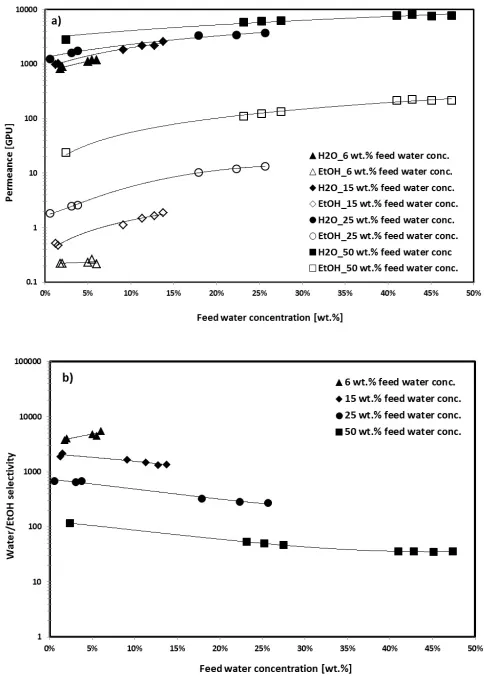
As PERVAPTM 4100 swells more than PERVAPTM 4101, data for this membrane are presented. The water and ethanol permeance values are dependent on the initial water concentration, i.e. 6, 15, 25 and 50 wt.% (see Figure 4a). The separation performance of the same membrane for different initial feed water concentrations are different, higher permeance values are obtained when higher initial feed water concentration is used, and thus, for obtaining much higher permeance values, arbitrary higher initial feed concentrations can be used. For example, the water permeance for 6 wt.% of initial feed water concentration is between 900 and 1100 GPU, and for 50 wt.% it is between 3000-8000 GPU.
As PVA is the base material of this membrane, the difference in separation performance is explained by the membrane swelling, dissolution of PVA crystallites and recrystallization due to water content in the feed [33]. On the one hand, the swelling process and dissolution of PVA crystallites
enhance the permeance. On the other hand, the recrystallization of PVA that occurs during the dehydration of ethanol lowers the permeance.
As seen in Figure 4a, the initial feed water concentration has affected the ethanol permeance more than the water permeance, and thus, the selectivity values for 50 wt.% of initial water concentration are below 200. For initial water concentration of 6 and 15 wt.%, the selectivity is higher than 1000 (Figure 4b).
Therefore, higher initial water concentration (>50 wt.%) in the feed (at 95°C) would lead to higher permeance values. However, because of the swelling and dissolution of PVA crystallites in the membrane, the separation performance of the PVA selective layer in this membrane (PERVAPTM 4100) may deteriorate, i.e. when it is in contact with higher water concentration (>80 wt.%) mixtures over time. Highly cross-linked membranes reduce this effect, e.g. PERVAPTM 4101.
Fig. 4. (a) Water and ethanol permeance, and (b) water/ethanol selectivity for the membrane PERVAPTM 4100 under four different initial water content; Operating
conditions: Tfeed=95°C and Ppermeate=10mbar (Tcondenser=-72°C).
In summary, performing a pervaporation test with an arbitrary initial water concentration will lead to different results. As described above, for dehydration of organic solvents, the azeotropic mixture composition is a recommended initial value for the performance data. For ethanol/water azeotropic mixture for example, the performance data corresponding to 6 wt.% of initial water concentration in the feed (see Figure 4) would be the most realistic and useful for membrane comparison and sizing a pervaporation plant. Nevertheless, for applications where the feed has high water concentration, the other set of data must be used.
3.5. Effect of feed temperature on membrane performance
first, a temperature change means a change of polymer chain mobility and free volume in the polymer matrix, as well as a change of solubility and diffusion of components through the membrane. For the second, as the feed temperature changes, the partial vapor pressure of components changes. Thus, the driving force changes if the permeate pressure is kept constant.
Different operating temperatures give different separation performance of membranes. In practice, higher temperatures are preferred to reduce the required membrane area. However, the thermal stability of membrane and heat costs have to be taken into account for process optimization.
During the membrane development in the laboratory, the most typical way to consider the temperature effect on flux and/or permeance is an Arrhenius-type equation (equation 6), and through an analysis, the apparent activation energy is calculated. Later, the calculated activation energy values for a given membrane and mixture are reported and correlated with the transport of components through the membrane.
RT Ea
e
J
J
0 (6)where, J represents the flux, Jo the pre-exponential coefficient, Ea the
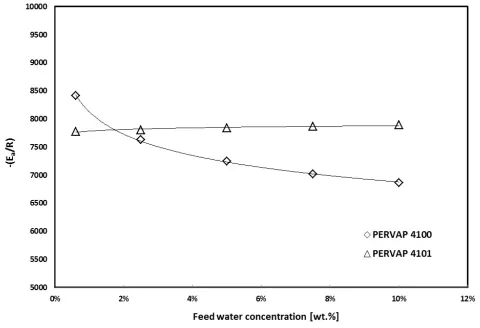
apparent activation energy, R the gas constant and T de temperature. The variation of apparent activation energy has a substantial effect on flux and permeance calculation, and depending on membrane nature it may be concentration dependent too, as showed in Figure 5. So, when reporting activation energy, we should also consider its concentration dependence. For example, the apparent activation energy (Ea/R) varies with feed water
concentration for PERVAPTM 4100, while for PERVAPTM 4101 it is almost constant.
Fig. 5. Apparent activation energy divided by R as a function of feed water concentration.
The activation energy reported as a numerical value is not useful. However, if the apparent activation energy and the pre-exponential coefficient from Arrhenius-type equation are reported, they are useful data for membrane comparison when the pervaporation tests are performed under different operating temperatures. With those data, one can calculate the flux values at different temperatures, consequently the permeances. Table 1 for example shows the apparent activation energy and pre-exponential coefficient for PERVAPTM 4100 and 4101 (for two water concentrations in ethanol/water mixture), as well as the calculated flux and permeance values for two different temperatures.
As seen, by using the apparent activation energy (-Ea/R) and the
pre-exponential coefficient (Jo), one can calculate the fluxes for two different
temperatures (60 and 105°C). Later, knowing or assuming the operating conditions, one has the possibility of calculating the permeance values and compare the membrane performance more accurately.
Although the flux values are calculated for 0.6 wt.% of feed water concentration at 60°C, the permeance values are not included in Table 1 for this operating condition. This is because the feed partial pressure of water is smaller than permeate pressure (10 mbar), and thus, the permeances result in negative values.
4. Conclusions
For polymeric pervaporation membranes that swell, we demonstrate that permeance and selectivity are also dependent on operating conditions. Therefore, the operating conditions and whole feed concentrations should be also reported for this pair of performance data.
In terms of raw experimental data, the best option is flux and permeate concentration instead of separation factor. By using these raw data, i.e. flux (kg/m2h), feed and permeate concentration (wt.%) and operating conditions, one can calculate the permeance values for membrane comparison.
The initial feed concentration of mixtures has a considerable effect on membrane performance, especially on membranes that swell. Thus, the used initial feed concentration must be justified. As shown, the final separation performance of a membrane can be extremely changed by the initial feed concentration. However, this membrane feature can be also used for tuning the membrane performance.
When the pervaporation tests are performed at different operating temperatures, it is also important to report the pre-exponential coefficient from Arrhenius-type equation and not only the apparent activation energy. By reporting both data, they can be used to calculate/estimate fluxes and permeance values for different operating temperatures. Thus, the membrane performance can be compared in a better way.
Table 1
Apparent activation energy, pre-exponential coefficient from Arrhenius-type equation for PERVAPTM 4100 and 4101, and estimated water flux and permeance.
Parameter PERVAP
TM 4100 PERVAPTM 4101
10 wt.% 0.6 wt.% 10 wt.% 0.6 wt.%
-Ea/R [°K] 6861 8418 7898 7775
Jo [g/m2h] 25.9 26.8 28.5 25.1
J105°C [g/m2h] 2400 90 1960 95
J60°C [g/m2h] 202 4.5 120 6.0
P/l105°C [GPU] 2309 1308 1886 1386
P/l60°C [GPU] 1156 _ 687 _
Acknowledgment
The support of D. Gladman and L. Leva from DeltaMem is gratefully acknowledged for providing language editing and reading the article, respectively.
References
[1] R.W. Baker, J.G. Wijmans, Y. Huang, Permeability, permeance and selectivity: A preferred way of reporting pervaporation performance data, J. Membr. Sci. 348 (2010) 346-352.
[2] J.G. Wijmans, R.W. Baker, A simple predictive treatment of the permeation process in pervaporation, J. Membr. Sci. 79 (1993) 101-113.
[3] J.G. Wijmans, Process performance = membrane properties + operating conditions, J. Membr. Sci. 220 (2003) 1-3.
[4] P.A. Kober, Pervaporation, perstillation and percrystallization, J. Am. Chem. Soc. 39 (1917) 944-948.
[5] L. Farber, Applications of pervaporation, Science 82 (1935) 158.
[6] E.G. Heiler, A.S. Hunter, J. Sicillano, R.H. Treadway, Solute and temperature effects in the pervaporation of aqueous alcoholic solutions, Science 124 (1956) 77-78. [7] R.C. Binning, J.M. Stuckey, Method of separating hydrocarbons using ethyl cellulose
permselective membrane, US patent 2,958,657 (1960).
[8] R. Binning, R. Lee, J. Jennings, E. Martin, Separation of liquid mixtures by permeation, Ind. Eng. Chem. 53 (1961) 45–50.
[9] D.R. Paul, O.M. Ebra-Lima, Pressure-induced diffusion of organic liquids through highly swollen polymer membranes, J. Appl. Polym. Sci. 14 (1970) 2201-2224. [10] D.R. Paul, O.M. Ebra-Lima, The mechanism of liquid transport through swollen
polymer membranes, J. Appl. Polym. Sci. 15 (1971) 2199-2210.
[11] D.R. Paul, Relation between hydraulic permeability and diffusion in homogeneous swollen membranes, J. Polym. Sci. B Polym. Phys. 11 (1973) 289-296.
[12] D.R. Paul, Further comments on the relation between hydraulic permeation and diffusion, J. Polym. Sci. B Polym. Phys. 12 (1974) 1221-1230.
polymeric networks. I. Poly(vinyl alcohol)–water, J. Appl. Polym. Sci. 19 (1975) 1381-1386.
[14] D.R. Paul, J.D. Paciotti, O.M. Ebra-Lima, Hydraulic permeation of liquids through swollen polymeric networks. II. Liquid mixtures, J. Appl. Polym. Sci. 19 (1975) 1837-1845.
[15] D.R. Paul, O.M. Ebra-Lima, Hydraulic permeation of liquids through swollen polymeric networks. III. A generalized correlation, J. Appl. Polym. Sci. 19 (1975) 2759-2771.
[16] M.H.V. Mulder, C.A. Smolders, On the mechanism of separation of ethanol/water mixtures by pervaporation I. Calculations of concentration profiles, J. Membr. Sci. 17 (1984) 289-307.
[17] M.H.V. Mulder, A.C.M. Franken, C.A. Smolders, On the mechanism of separation of ethanol/water mixtures by pervaporation II. Experimental concentration profiles, J. Membr. Sci. 23 (1985) 41-58.
[18] G.F. Tusel, H.E.A. Brüschke, Use of pervaporation systems in the chemical industry, Desalination 53 (1985) 327-338.
[19] W.F. Guo, T.-S. Chung, T. Matsuura, Pervaporation study on the dehydration of aqueous butanol solutions: a comparison of flux vs. permeance, separation factor vs. selectivity, J. Membr. Sci. 245 (2004) 199-210.
[20] X. Qiao, T.-S. Chung, W.F. Guo, T. Matsuura, M.M. Teoh, Dehydration of isopropanol and its comparison with dehydration of butanol isomers from thermodynamic and molecular aspects, J. Membr. Sci. 252 (2005) 37-49. [21] Y. Huang, J. Ly, D. Nguyen, R.W. Baker, Ethanol dehydration using hydrophobic
and hydrophilic polymer membranes, Ind. Eng. Chem. Res. 49 (2010) 12067-12073. [22] V. Smuleac, J. Wu, S. Nemser, S. Majumdar, D. Bhattacharyya, Novel Perfluorinated Polymer-Based Pervaporation Membranes for Separation of Solvent/Water Mixtures, J. Membr. Sci. 352 (2010) 41–49.
[23] P. Luis, B. Van der Bruggen, The driving force as key element to evaluate the pervaporation performance of multicomponent mixtures, Sep. Purif. Technol. 148 (2015) 94-102.
[24] A. Rozicka, J. Niemistö, R. L.Keiski, W. Kujawski, Apparent and intrinsic properties of commercial PDMS based membranes in pervaporative removal of acetone, butanol and ethanol from binary aqueous mixtures, J. Membr. Sci. 453 (2014) 108-118.
[25] P. Luis, J. Degrève, B. Van der Bruggen, Separation of methanol–n-butyl acetate mixtures by pervaporation: Potential of 10 commercial membranes, J. Membr. Sci. 429 (2013) 1-12.
[26] W. Yave, The improved pervaporation PERVAP membranes, Filtration+Separation, 54 (2017) 14-15.
[27] S. A. Stern, Polymers for gas separations: the next decade, J. Membr. Sci. 94 (1994) 1-65.
[28] B.D. Freeman, Basis of permeability/selectivity tradeoff relations in polymeric gas separation membranes, Macromolecules 32 (1999) 375-380.
[29] L.M. Robeson, The upper bound revisited, J. Membr. Sci. 320 (2008) 390-400. [30] M. Wang, H. Wua, X. Jin, C. Yang, X. He, F. Pan, Z. Jiang, C. Wang, M. Chen, P.
Zhang, X. Cao, Enhanced dehydration performance of hybrid membranes by incorporating fillers with hydrophilic-hydrophobic regions, Chem. Eng. Sci. 178 (2018) 273-283.
[31] Y.M. Xu, Y.P. Tang, T.-S. Chung, M. Weber, C. Maletzko, Polyarylether membranes for dehydration of ethanol and methanol via pervaporation, Sep. Purif. Technol. 193 (2018) 165-174.
[32] A. Banerjee, S.K. Ray, PVA modified filled copolymer membranes for pervaporative dehydration of acetic acid-systematic optimization of synthesis and process parameters with response surface methodology, J. Membr. Sci. 549 (2018) 84-100.
[33] S. Jeck, P. Scharfer, W. Schabel, M. Kind, Water sorption in semicrystalline poly(vinyl alcohol) membranes: In situ characterisation of solvent-induced structural rearrangements, J. Membr. Sci. 389 (2012) 162-172.
[34] X. Feng, R.Y.M. Huang, Estimation of activation energy for permeation in pervaporation processes, J. Membr. Sci. 118 (1996) 127-131.