ISSN 0975-6175
Application of Mathieu potential to calculation of photocurrent from
the surface of metals
B. Zoliana1, Z. Pachuau2 and R. K. Thapa2
1
Department of Physics, Govt. Zirtiri Residential Science College. Aizawl 796001, India
2
Department of Physics, Mizoram Uni versity, Aizawl 796012, India
Rece ived 28 Januar y 2010 | Acc epted 2 Febr uary 2010
ABSTRACT
Mathieu potential have been used for the photoemission calculations from surfaces of ferro-magnetic material, Fe (iron), and semiconductor, PbSe (lead selenide). This approach gives a qualitative characterization of surface state photoemission by considering only the surface con-tribution from the existing bulk-band structure calculations. In this paper, we present the calcu-lations of photocurrent from Fe and PbSe by using the Mathieu potential which defines the crystal potential. The derived initial wave function was used and variation of photocurrent only by those contribution from the surface region defined was calculated. Photocurrent was calculated for values of z0 = -2 a.u. and z0 = -8 a.u. As the width of the surface is 10 a.u. in both the cases,
z0 = -2 a.u. is near the surface-vacuum interface and z0 = -8 a.u. is towards the surface-bulk interface. We found that at low photon energy range, the metal and the semiconductor under study showed similar trend in the behaviour of photocurrent at a region nearer to edge of the surface.
Key words: Mathieu potential; photocurrent; surface states; wavefunctions.
Correspo nding auth or: B. Zoliana
Tel. +91-9436140347 (cel l); Fax: 0091-389-2341102 E-mail : bzoliana@ rediffmail.com
INTRO DUCTIO N
Mathieu potential is a sinusoidal type of po-tential which had been used by Davison and
Levine1 for surface band structure calculations.
Pachuau et al.2 had applied this approach for
deriving the initial state wavefunctions for eval-uation of the matrix element ‹ ψf | Η’/|ψ
i › for
calculating photocurrent. The photocurrent
data as obtained by them in the ultra-violet pho-ton energy range showed interesting features
comparable to experimental results,3 especially
in the case of tungsten (W) and molybdenum
(Mo ).
However, the main drawback of the calcula-tion for photocurrent is that the same initial state wavefunction is used both for the surface and the bulk regions of the metal. In this study,
we used the derived2 initial wavefunction and
MATERIALSAND METHOD
The photocurrent density formula4 from
golden rule approximation can be written as
| | 2 ) ( f d E dj H / )] ( 1 [ ) ( ) ( ) ( 2 |
| Ei fo E fo E
f E f E E
i
where ψi (ψf) refer to the initial (final) state
wavefunctions and perturbation H/ can be
writ-ten as
H/=
A.pp.A
c e m
e
2
In eq. (2), me is the mass of the electron, p
the one-electron momentum operator and A the
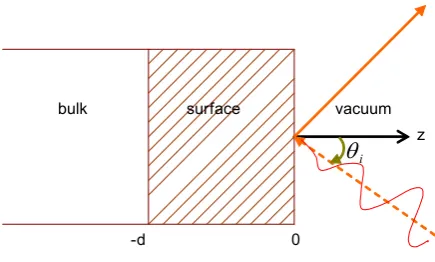
vector potential of the incident photon field. We assumed the z-direction to be perpendicular to the surface (which is chosen as z = 0 plane), and the surface region is defined by – d = z = 0 while the metal is assumed to occupy all the spaces to the left of z = 0 plane as shown in Figure 1. 0 ) ( c d
is given by
) ( . 0 ), ( . 1 ) ( 0 , )] ( 1 [ ). ( . 1 ) ( , 1 ) ( ~ vacuum z A surface z d d z d A bulk d z A z A
e zz f k i e f k f q f q f q z f
. . 2 . 2 1 2 1 wher e f E fk 2 2 , 2 2( V0)
f E f
q
(3) (2)
(1)
(4)
and Ei
f
E .
The initial state wavefunction derived by us-ing Mathieu potential is given2 in atomic units
(in one-dimension) by
) 0 ( , 0 2 1 2 ) 0 ( , 0 2 640 11 16 1 2 1 4 1 z z z e z z z e q q i k vacuum surface
zq i , (5)
i
z-d 0
surface
bulk vacuum
We considered a p-polarised light to be
inci-dent on the surface plane making an angle i
with the z-axis. The vector potential
A
~
z
in the long wavelength limitFigure 1. A model photoemission diagram.
where A1 is a constant depending on the di-electric function ε (ω), photon energy ћω and angle of incidence θi. The final state wavefunc-tion ψf used in eq. (1) is the scattering state of
Here, the various constants (in a.u.) used are as follows
0 . 0 2 2 2 1 z a z i E i k q (6)
where z0 is the location of the surface state
wavefunction and a is the lattice constant
which is taken as 6 unit.
We have calculated photocurrent for two lo-cations of the initial state wavefunctions in the surface region, that is, at z0 = za and zb, where za is closer to vacuu m-surface interface and zb is closer to bulk-surface interface.
The matrix element ‹ ψf | Η’/|ψ
i › involved
in eq. (1) can be expanded as follows
0 0 * * * * 0 1 2 d i if i f f i f
d d
d dA d
A dz A dz dz A dz
dz dz dz
(7)
Considering only the surface contribution, eq. (7) reduces to
I = ‹
ψ
f|
Η’/|
ψ
i › =
* f
H/idz =
dz i z A dz d dz d z Af
~ 2 1 ~ * =
Eq. (8) had been used to compute photocur-rent from metal (Fe) and semiconductor (PbSe) and FORTRAN programmes were writ-ten to evaluate the above integrals.
RESULTS
We dicuss here the results of photocurrent
I =
i dzdz z A d d f dz d dz i d z A
f . .
~ . 0 * 2 1 . 0 . ~ *
in the case of iron (Fe) and semiconductor lead selenide (PbSe). For Fe, we used the experi-mentally measured dielectric constants as given
by Weaver,5 whereas for semiconductor, the
data as given by Edward.6 Choice of parameter
like initial state energy (Ei), magnitude of po-tential (V0), Fermi level (EF), were those per-taining to respective metal and semiconductor.
However, angle of incidence was θi = 45º for
p-polarised light under consideration in all the cases. Photocurrent was calculated for values of z0 = -2 a.u. and z0 = -8 a.u. As the width of the surface was 10 a.u. in both the cases, z0 = -2 a.u. was near the surface-vacuum interface,
and z0 = -8 a.u. was toward the surface-bulk
interface. We showed the plots of photocurrent which had been converted to normalized unity. This was done in order to avoid the large dif-ference in numerical magnitude of the calculat-ed photocurrent data in these two values of z0.
1. Iron (Fe)
Figure 2 shows the behaviour of photocur-rent in the case of Fe where we have shown the plot again for two locations of surface
0 0 .2 0 .4 0 .6 0 .8 1 1 .2
5 10 15 2 0 2 5
P h o to n En e rg y (e V )
P h o to c u r re n t (n o rm a li z e d to u n it y )
z o = - 8 a. u. z o = - 2 a. u.
states wavefunctions, that is, at z0 = -2 a.u. and z0 = -8 a.u. The observed value6 of plasmon
en-ergy (ћ ωp) of Fe was 15.8 eV. In the case of
wavefunction located at z0 = -2 a.u. plot of
photocurrent showed a maxima at ћ ω = 9 eV
and it decreased to a minima at ћ ω = 13 eV. AA second peak of small magnitude in height was fou nd at ћ ω = 15 eV. The case of z0 = -8 a.u. shows a different trend which decreases rapid-ly as the photon energy increases and having a
minima also at ћ ω = 13 eV. However, there
was no proper peak in photocurrent near plas-mon energy.
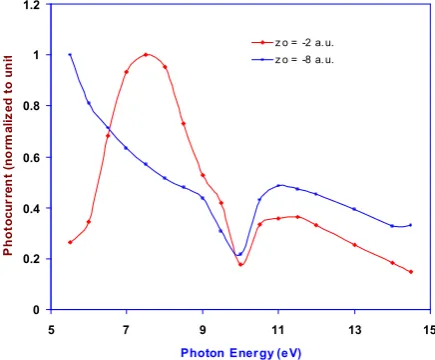
2. Lead selenide (PbSe)
In Figure 3 we show the plot of photocur-rent against photon energy in the case of PbSe for z0 = -2 a.u. and z0 = -8 a.u. Photocurrent increases with the increase in ћ ω for z0 = -2
a.u. and reaches a maximum at ћ ω = 7.5 eV. It
decreases with the further increase in žù but
showed a minimum at ћ ω = 10 eV. A small
peak in photocurrent is obtained at ћ ω = 11 eV
and photocurrent decreases with further in-crease in ћ ω. For the case of z0 = -8 a.u., pho-tocurrent goes on decreasing with the increase
in ћ ω and showed minimum at ћ ω = 10 eV..
Beyond ћ ω = 10 eV, photocurrent showed
sim-ilar behaviou r as shown in the case of case z0 = -2 a.u.
DISCUSSIO N
We find from our results that at low photon energy range the metal and the semiconductor under study showed similar trend in the behav-iour of photocurrent at a region nearer to edge of the surface. For example in both cases, we see the occurrence of peak which is due to surface photoeffect and the decrease in photo-current to minimum after the first peak which is due to loss of photon energy by excitation of
bulk plasmons for z0 = -2 a.u. The surface
0 0.2 0.4 0.6 0.8 1 1.2
5 7 9 11 13 15
Photon Ener gy (e V)
P
h
o
tocur
ren
t
(no
rm
aliz
ed
t
o
un
it
y) z o = -2 a. u.
z o = -8 a. u.
Figure 3. Plot of photocurrent against photon energy with Ψi defined by Mathieu potential for the case of PbSe.
plasmon frequency (ωp) is assumed to be the
value of photon frequency at which photocur-rent is maximum. As the incident photon ap-proaches plasmon frequency, the component of electric field tends towards minimum which also causes the the photocurrent to be mini-mum Beyond the plasmon energy, a second peak in photocurrent was obtained whose height is smaller in magnitude than the first one at ћ ω < ћ ω
p. The reason for the occurrence of
peak in photocurrent at ћ ω < ћ ω
p is due to
surface refraction effect where the z-compo-nent of electromagnetic field becomes
maxi-mum at ћ ω < ћ ωp / 2 . This had been also seen in the experimental3 results of W and Mo.
We tried to see the effect of surface contri-bution only and excluded the bulk photoemis-sion in Mathieu type of potential from metal and semiconductor surfaces. We find that at narrower surface width (z0 = -2 a.u.) the pho-tocurrent results from these element showed similar behaviour for as had been obtained by Zoliana et al.7 and Thapa et al.8 in the case of
other metals and semiconductors.9 As the initial
bulk-surface interface the photocurrent behav-iou r tend to deviate away from the qualitative behaviou r.9
REFERENCES
1. Da vison SG & Levine JD (1970).In: Soli d State Phys-ics (H Ehrenreich, F Seitz & D Trunbull, eds.). Aca-demic Press, New York, USA , 25, 1.
2. Pachuau Z, Zoliana B, Khathing DT, Patra PK & Thapa R K (2000). Application of Mathieu potantial to photo-emissio n from metals. Phys Lett A, 275, 459-462. 3. Weng SL, Gustaffson T & Plummer EW (1978).
Experi-mental and theoretical study of the surface reso-nances on the (100) faces of W and Mo. Phys Re v B, 18, 1718.
4. Weaver JH (1987). Ha ndbook of Ch emistry and
Phys-ics. CRC Press, Boca Raton, Florida, USA, p. E377. 5. Edwards DP, ed. (1991). Ha ndbook of Optica l Co
n-stants of Sol id s. Academic Press, New York, USA , p. 429.
6. Glicksman M (1971). In: Soli d State Physics (H Ehrenreich, F Sei tz & D Trunbull, eds.). Academic Press, New York, USA, 26, 338.
7. Zoliana B, Pachuau Z, Zadeng L, Patra PK, Khathing DT & Thapa RK (2003). Photoemissio n studies of met-als by using Mathieu potentia l. Indi an J Phys, 77(4), 393-396.
8. Thapa RK & Kar N (1995). Photocurrent calculations in beryllium using local diaelectric model. Phys Re v B, 51, 17980-17983.