Experimental and Numerical simulation of
the Translational Downburst using
impinging jet model
K.K.Das1*, A.K.Ghosh2,K.P.Sinhamahapatra3
1*
Department of Mechanical Engineering, Assam Engineering College,Guwahati, INDIA
2 3
Department of Aerospace Engineering, Indian Institute of Technology Kharagpur, INDIA
*
Corresponding Author: e-mail: [email protected], Tel +91-09864405087
Abstract
Severe thunderstorms are important weather phenomenon which impact on various facets of national activity
like civil and defense operation, particularly aviation, space vehicle launching, agriculture in addition to its
damage potential to life and properties. Experimental and numerical simulation studies on thunderstorm
downburst have been reported by many researchers during the past two decades. Most of the numerical studies
are based on stationary downburst. Translational downburst occur more frequently than stationary downburst
due to the presence of ambient boundary layer winds. In the present work a axisymmetric numerical code has
been developed to simulate the translational downburst using vorticity-stream formulation, with LES model for
the turbulence. In addition a microburst simulator has been fabricated with a 165 mm diameter nozzle to
generate experimental data for the translational downburst.
Keywords: Microburst, Experimental simulation, Ring vortex, Macro-flow dynamics.
1.0 Introduction
The famous atmospheric scientist Fujita(1981) has observed and studied the flow due to downburst impacting
on the ground and spreading outward in the different directions. He classified downburst as either microburst or
macroburst depending on their horizontal extent of damage. For the complexity of the full scale phenomenon,
the physical simulation of the downburst is confined to the generic experiments of density currents impinging on
numerical code to simulate the translational downburst and also to fabricate a physical simulator for validating
the code.
2.0 Numerical Simulation
The two-dimensional incompressible Navier-Stokes equations in stream function-vorticity form are solved
numerically to simulate the axisymmetric impinging jet downburst problem. The LES technique is adopted to
model the turbulence. The Poisson equation for the stream function ψ is given by
V2ψ=-ξ ---- (1)
the vorticity transport equation in non-dimensional form is
( ) ( )
1 Re2
2 Re
2
2 2 2
2 2
u v
t x y
u v u v
y x x y x y x y
sgs
sgs
sgs
sgs
ν ν ξ ξ ξ ξ ν ν ν ν ν ν ν ν ν ν + ∂ ∂ ∂ + + = ∇ ∂ ∂ ∂ ∂ ∂ + ∂ ∂ + ∂ ∂ ∂ + + + − − ∂ ∂ ∂ ∂ ∂ ∂ ∂ ∂
The vorticity transport equation (2) is normalized with the jet exit parameters. The unsteady vorticity transport
equation is parabolic, and is solved using the implicit ADI technique, whereas the Poisson equation for stream
function is elliptic and is solved by successive over-relaxation (SOR) method with a relaxation factor (ω) of
1.85. It is further assumed that the flow enters the computational domain with the jet exit velocity, where the
fluid is stationary at t = 0. The Smagorinsky constant (Cs) is taken as 0.15 for this CFD simulation.
2.1 Boundary Conditions
The impermeable no-slip boundary condition is imposed for the solid surface BC as shown in figure 1.The
outflow boundary condition is imposed for surfaces CD, DE and AH. Free slip condition is imposed for EF and
HG. Logarithmic velocity profile is considered for the surface AB.
Figure 1: Computational Domain for the translational downburst
3.0 Physical modeling
Physical simulation of the translational dry microbursts is done using the impinging jet model with a 165 mm
exit diameter pipe. Two 1.5 HP centrifugal blowers are used to generate the impinging jet.. The translational
velocity (Vtrans) of the jet is kept fixed at 5 m/s for the entire experimentation. The dimension of the wooden
platform on which the jet impinges is 2.0 m
×
2.0 m with roughness of 4.2 micron. The distance of the jet fromthe impinging platform (H) can be varied between 125 mm and 400 mm using an adjustable frame to change the
value of H/Djet. The H/Djet ratios considered for this work are 1.0, 1.5, 2.0. Three jet velocities (Vjet) of 10 m/s,
15 m/s and 20 m/s are used in the experiments. Experimental setup is shown in figure 2. Velocity is measured
using DANTEC 56C17 CTA probe with traverse system and CTA software.
.
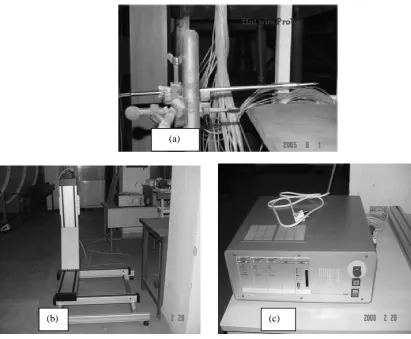
Figure 2 Physical simulator of the thunderstorm microburst fabricated at IIT Kharagpur
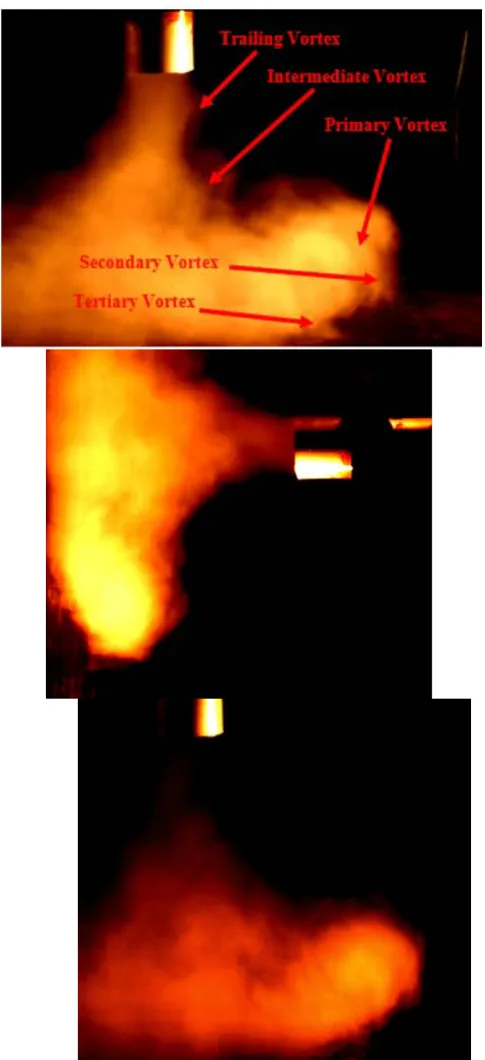
Figure 3 Flow visualization of the simulated travelling downburst from the physical simulator
The primary, secondary and tertiary vortices are observed in the flow visualization photographs shown in figure
3. The initial trailing and the intermediate vortices can also be seen in figure 3. Contrary to the primary and
secondary vortices, the tertiary vortex is attached to the impinging plate. Hence, it generates high wind shear
3.1 Velocity and Pressure measurements
A DANTEC 56C17 hot wire anemometer system is used to measure the velocity in the flow field. In addition,
a vane type digital anemometer is also used to measure the velocity at some locations in the flow field. To
determine the velocity profiles in the radial and axial directions, hot wire anemometer probe is placed in the
DANTEC traversing system as shown in figure 4. Pressure is measured using a PDCR23 pressure transducer
system with a scanivalve. To estimate the pressure on the impinging platform 300 pressure taps are placed on
the platform. Pressure taps are connected to the scanivalve through 1 mm diameter PVC tubing. A multi tube
manometer is also used to verify the pressure readings of the PDCR23 pressure transducer system.
Figure 4 DANTEC CTA Probe with the Traversing system and the controller
3.2 Flow visualization
Flow visualisation of the impinging jet is done using a smoke generator and high speed cameras. Smoke
generator is connected to the inlet of the blower. Flow patterns at different jet velocities and plate locations are
photographed.
(b) (c)
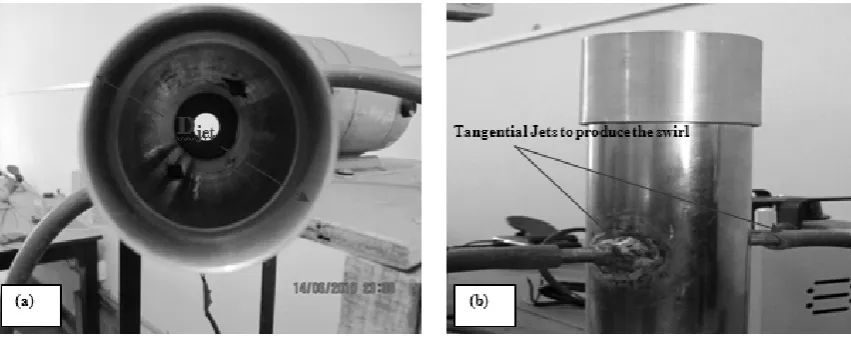
Figure 5 Impinging jet used for the physical simulation.
4.0 Results and Discussions
Some assumptions are made in the present numerical and experimental simulations of the dry downburst. It is
assumed that the buoyant acceleration characteristics of a natural downburst can be modeled by impinging jet.
Cross jets are used to generate secondary injection, which reduces the boundary layer effect of the jet wall,
which gives a better representation of the density driven flow in the natural downburst.
The spatial scale of the simulation is estimated based on the observations related to stationary microbursts made
by Hjelmfelt (1988). Hjelmfelt observed that the microburst typically had a diameter of 1.8 km and that the
maximum outflow winds occurred at approximately 1.5 km from the center of the descending column of air.
Based on this observation the geometric scaling factor in this study is about 1/10000. Also, it is found from the
preliminary tests performed in the physical simulation that the model produces peak radial wind of nearly 32m/s
compared to a maximum velocity of nearly 60m/s in natural downburst (Fujita, 1981). Therefore the velocity
scaling factor is 1/2. Combining the geometric and velocity scaling factors lead to the time scale of 1/5000 for
this study.
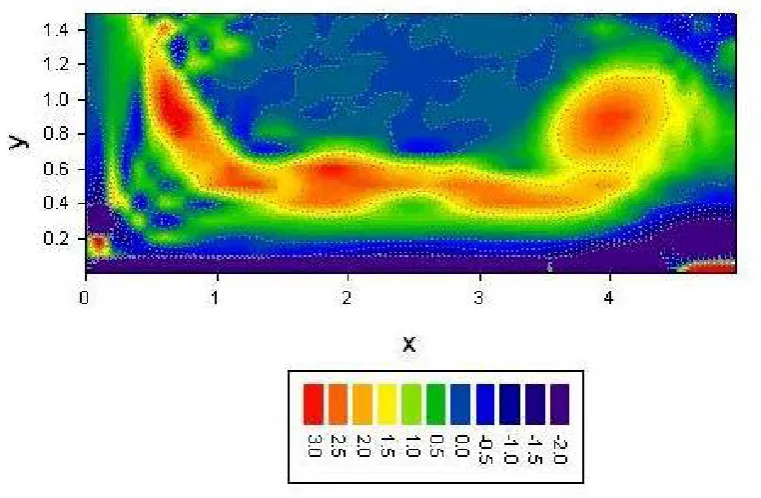
Four distinct major vortices are observed within the downburst flow field: a primary, an intermediate, a
trailing and a counter-rotating secondary vortex as seen in figure 6. Several transient vortices are also observed
near the test surface immediately after the impact of the jet on the test surface as seen in figure 4. The secondary
vortex is generated at x = 1.8 – 3.5. From these figures it is observed that the axial location of the primary vortex
The primary and secondary vortices form at a larger radial distance from the point of impact when the plate
separation ratio is smaller. Similar results are also observed for other plate separations and Reynolds numbers
Figure 6 Vortex formations in the travelling downburst from the numerical simulation
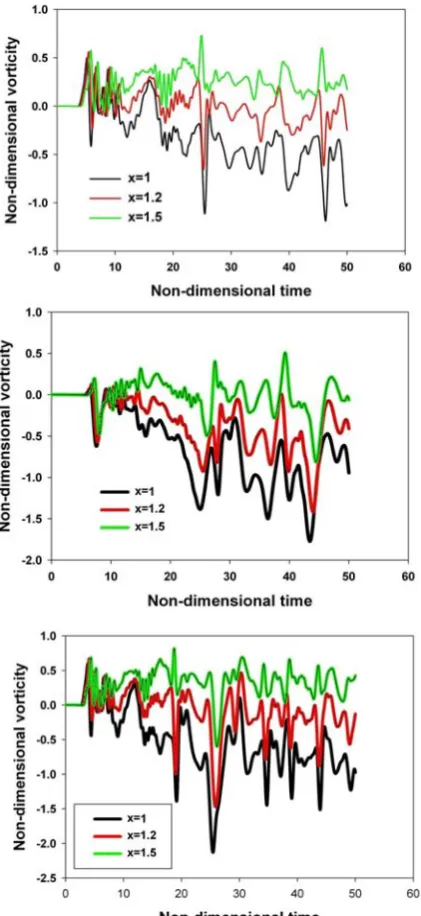
Figure 7 shows the velocity fields of the travelling downburst from the numerical simulation. Figures 8 shows
the computed temporal variation of vorticity at three radial stations, x=1.0, 1.2 and 1.5 at Reynolds number of
1.1×10⁵ and plate separation ratio of 1.0 and 1.5. The point of interest at each radial station is the point of
maximum radial velocity, which is about 5-8% of Djet. In each case the vorticity shows considerable fluctuation.
It is further observed that for a particular value of Reynolds number and plate separation ratio the fluctuations in
vorticity at x=1.2 and 1.5 are almost identical with the time-mean nearly constant. At x=1.0 the fluctuation
Figure 8 Temporal variation of vorticity
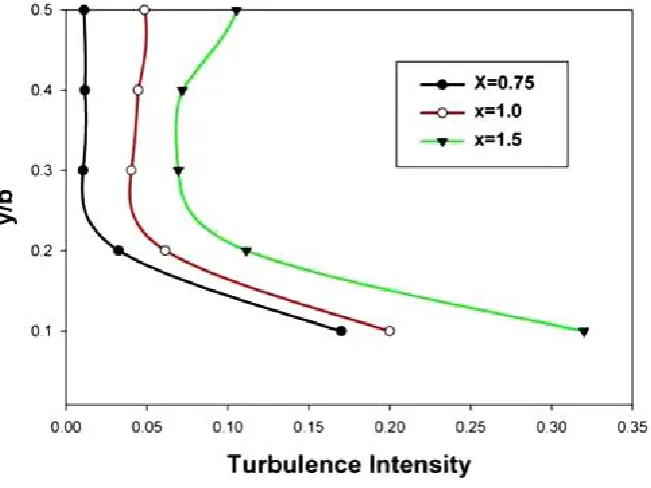
In order to investigate the second order statistics, radial profiles of the turbulence intensity within the range of x
= 0.4 – 1.5 are presented in figure 9. Identical turbulence intensity profiles are observed for x = 0.75 – 1.5 but
the turbulence intensity profiles for x = 0.4 – 0.6 are different as the primary vortex gains momentum in the
radial direction beyond x=0.75.
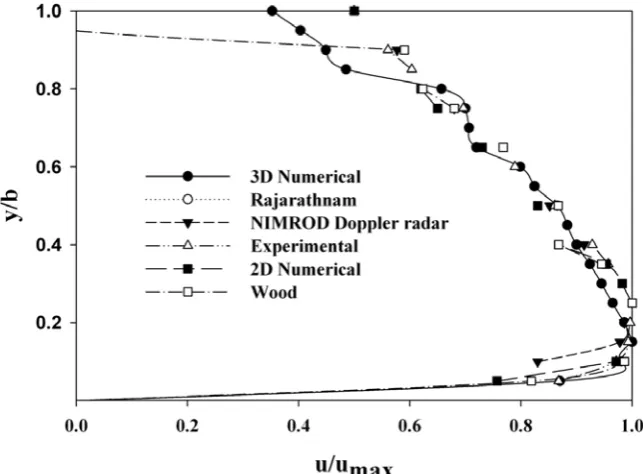
The computed and experimental radial velocity profiles from the present simulations are compared with the
field observation data from the project NIMROD (Fujita, 1981) and empirical profiles due to Rajaratnam (1976)
and Wood et al. (2001). The comparison is presented in figure 10. The radial velocity in the figure is normalized
with the maximum radial velocity and the height is normalized with respect to the height at which radial
velocity falls to 50% of the maximum. The experimental and numerical results shown in figure 8 are for jet
velocity 30 m/s and H/Djet =1.0. The computed radial velocity profile matches closely with the experimental
data. The two-dimensional computation too agrees reasonably well. Very good agreement is also observed with
the full scale data from NIMROD (Fujita, 1981) as shown in figure 10.
Figure 9 Turbulence intensity profiles
5.0 Conclusion
ground and about 1.5Djet away from the jet axis.
c. Ground pressure coefficient distribution is independent of Reynolds number and jet separation ratio.
d. The magnitude of the maximum radial velocity increases for decreasing value of surface slip but the
maximum velocity occurs closer to the surface for higher value of slip.
e. The secondary vortex reduces the velocity decay rate beyond 1.5Djet and hence increases the radial extent
of the downburst.
f. Vertical location of the primary vortex is independent of Reynolds number and jet separation but the
horizontal location depends on these parameters. For lower Reynolds number and higher jet separation
ratio, primary vortex forms closer to the point of impact.
g. The primary vortex separates from the ground at x = 2.0 - 2.5Djetfor all Reynolds number and cloud height
Figure 8 Comparison with full scale data
6.0 Nomenclature
x Radial direction
y Axial direction
Vjet Jet velocity
u Radial velocity
v Axial velocity
Djet Diameter of the jet
H Distance of the jet from the impinging plate.
H/Djet Plate separation ratio, Cloud height for the full scale downburst.
7.0 References
[1] Alahyari, A., Longmire, E.K., 1995. Dynamics of experimentally simulated microbursts. AIAA J. 33 (11), 2128-2136. [2] Chay, M.T., Letchford, C.W., 2002. Pressure distribution on a cube in a simulated thunderstorm downburst—Part A: stationary
downburst simulation. J. Wind Eng. Ind. Aerodyn. 90, 711-732.
[3] Cooper, D., Jackson, D.C., Launder, B.E., Liao, G.X., 1993. Impinging jet studies for turbulence model [4] Assessment-I. Flow-field experiments. Int. J. Heat Mass Transfer 36 (10), 2675–2684.
[5] Craft, T.J., Graham, L.J.W., Launder, B.E., 1993. Impinging jet studies for turbulence model Assessment-II: an ex amination of the performance of four turbulence models. Int. J. Heat Mass Transfer 36 (10), 2685–2697.
[6] Das K.K, Ghosh A.K., Sinhamahapatra K.P.,2010, Investigation of the axisymmetric microburst flow field, Journal of Wind and Engg., Vol. 7 no. 1, Jan 2010, pp 1-15.
[7] Didden, N., Ho, C.M., 1985. Unsteady separation in a boundary layer produced by an impinging jet. J. Fluid [8] Mech. 160, 235–256.
[9] Fujita, T.T., 1981. Tornadoes and downbursts in the context of generalized planetary scales. J. Atmos. Sci. 38, 1511–1534. [10] Fletcher C.A.J 1987 Computational Techniques for the Fluid Dynamics(vol. 2) Springer-Verlag Publication
[11] Hjelmfelt, M.R., 1988. Structure and life cycle of micoburst outflows observed in Colorado. J. Appl. Met. 27, 1988, 900-927 [12] Holmes, J.D., Oliver, S.E., 2000. An empirical model of a downburst. Eng. Struct. 22, 1167–1172.
[13] Kim, J., Hangan, H., 2007. Numerical simulation of impinging jets with application to downbursts. J. Wind Eng. Ind. Aerodyn. 95, 279–298.