Lincoln University Digital Thesis
Copyright
Statement
The
digital
copy
of
this
thesis
is
protected
by
the
Copyright
Act
1994
(New
Zealand).
This
thesis
may
be
consulted
by
you,
provided
you
comply
with
the
provisions
of
the
Act
and
the
following
conditions
of
use:
you
will
use
the
copy
only
for
the
purposes
of
research
or
private
study
you
will
recognise
the
author's
right
to
be
identified
as
the
author
of
the
thesis
and
due
acknowledgement
will
be
made
to
the
author
where
appropriate
you
will
obtain
the
author's
permission
before
publishing
any
material
from
the
thesis.
Forms and mechanisms for phosphorus
leaching in an alluvial soil.
A dissertation submitted in
partial fulfilment of the requirements
for the Degree of
Master of Water Resource Management
at Lincoln University.
By Wayne Richard Worth.
i
Forms and Mechanisms for Phosphorus leaching in an alluvial soil.
By
W.R.Worth.
Abstract.
The fresh water quality of New Zealand is considered very clean by international standards however in dense urban and rural areas the water quality has degraded. Economic
incentives of a high milk solid price has led to an increase in dairy herds and milking
platforms in many regions. The conversion of lowland dry stock pastures into dairy units has been widespread in some of the most vulnerable regions prone to leaching. Many of these areas contain glacial outwash fans and till deposits of gravels and sands covered by thin soil layers, which are characterised as having low Anion storage capacity (ASC) and a high potential to leach phosphorus (P) under irrigation.
Leaching studies utilising monolithic soil lysimeters and lab based leaching experiments were undertaken on soils taken from a recently established dairy unit, that occupies part of the Manuherikia River flood plain within the Alexandra basin of Otago, New Zealand. The research objective was to study the potential for P to move down the vadose zone and into groundwater from common P applications under irrigated and grazed dairy pastures.
This was addressed by firstly examining the bioavailability of different organic P forms leached in these gravels, secondly, to determine if low ASC gravel soils coincide with enhanced vertical P loss and thirdly, estimating how long intensive farming of these areas would take to enrich groundwater P.
ii
This is also enhanced by dung, due to the inhibition of P sorption sites by organic compounds in dung and increases the incidence of labile organic forms of P moving
downward towards ground water. There is a strong argument that current concentrations of P potentially reaching ground water underlying these soils, pose a risk to surface water quality.
Keywords
iii
Contents.
Abstract. ... i
Figures and Tables. ... v
Chapter One: Introduction. ... 1
1.1. Phosphorus cycle. ... 2
1.2. Use of Phosphate rock in Fertilizer. ... 3
1.3. Phosphate sustainability. ... 5
1.4. Eutrophication of fresh water surfaces and coastal oceans. ... 6
1.5. Bioavailability to aquatic processes. ... 6
1.6. Forms and sources of phosphorus. ... 9
1.6.1. Organic P. ... 9
1.6.2. Inorganic P. ... 9
1.6.3. Excreta as a source of P. ... 10
1.7. Pathways of phosphorus loss ... 12
1.7.1. Matrix flow. ... 13
1.7.2. Preferential flow. ... 13
1.8. Stony soils ... 15
1.9. Purpose of this research. ... 17
Chapter Two: Methodology. ... 19
2.1. Site description. ... 19
2.1.1. Groundwater hydrology. ... 20
2.1.2. Soil key physical properties. ... 21
2.1.3 Lysimeter collection site ... 22
2.3. Lysimeter trial. ... 24
2.3.1. Lysimeter sampling. ... 30
2.4. Column experiment. ... 32
2.5. NaOH-EDTA extraction and ³¹ P nuclear magnetic resonance spectroscopy (³¹ P NMR). ... 35
2.6. Laboratory analysis. ... 35
2.7. Quality control ... 36
2.8. Statistical analyses and modelling. ... 36
Chapter Three: Results ... 37
3.1. Soil physical properties ... 37
iv
3.3. Lysimeter trial results. ... 43
3.4. Mass balance table. ... 49
3.5 Column trial results. ... 50
3.6. NaOH-EDTA extraction and ³¹ P nuclear magnetic resonance spectroscopy (³¹ P NMR). ... 56
3.7. Otago Regional Council Lysimeter data. ... 58
Chapter Four: Discussion. ... 61
4.1 Lysimeter Trial. ... 61
4.1.1 Pathways of P loss. ... 61
4.1.2 Fertilizer treatments. ... 62
4.1.3 Dung treatment... 62
4.1.4 Loss of bioavailable P. ... 63
4.1.5. Soil enrichment to depth in lysimeters. ... 64
4.2. Mass balance. ... 65
4.3. Lysimeter summary. ... 66
4.4 ³¹ P NMR. ... 67
4.4.1: Organic P. ... 68
4.4.2. Orthophosphate monoester P. ... 69
4.4.3 Orthophosphate Diester P. ... 69
4.5: Column trial experiment. ... 70
4.5.1. Bromide tracer test. ... 70
4.5.2. Column treatments. ... 70
4.5.3. Statistical analysis. ... 71
4.5.4 Column trial summary. ... 71
4.6. Otago Regional Council lysimeter. ... 73
4.7. Groundwater discharge to Manuherikia River. ... 75
4.7.1: Surface Water quality of the Manuherikia River ... 76
Chapter Five: Conclusions. ... 79
Acknowledgments ... 80
References ... 81
Appendices ... 87
Appendix 1 Lysimeter chemistry results. ... 87
Appendix 2 Otago Regional Council results for Lysimeter site. ... 91
v
Figures and Tables.
Figure 1: Phosphorus Cycle. Figure 2: Uses of phosphoric acid.
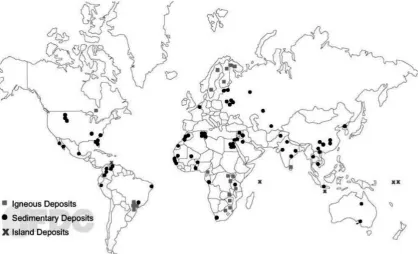
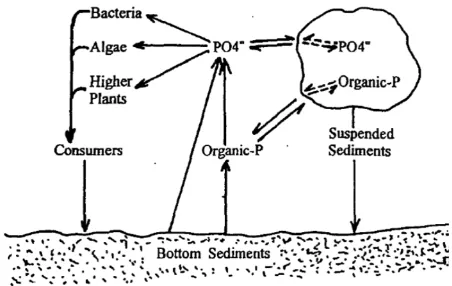
Figure 3: Location of world phosphorus resources Source: Zapata (2004). Figure 4: Phosphorus availability in water, Correll 1998.
Figure 5: Conceptual diagram of potential sources and processes that transport phosphorus from the dairy pastures to surface water (McDowell et al. 2004). Figure 6: Lysimeter collection site. Source S-Map.
Figure 7: Alexandra Basin geology, Source ORC 2012. Figure 8: Lysimeter collection site.
Figure 9: Otago regional council Lysimeter site. Figure 10: Lysimeter excavation site.
Figure 11: Calving and transport of monoliths form excavation site. Figure 12: Diagram of lysimeter design.
Figure 13: Lysimeter dung treatment at time of application. Figure 14: Superphosphate treatment at time of application. Figure 15: Column experiment arrangement.
Figure 16: Column experiment setup.
Figure 17: Particle size frequency distribution curve. Figure 18: Ternary diagram of Sand to Mud proportions. Figure 19: Ternary diagram of Silt to clay proportions.
Figure 20: Rainfall for the period of November 2015 to end of March 2016. Figure 21: Sum of drainage recorded from sample collection during the trial period.
Figure 22: Super only treatment loss of TFP during the first week after treatment application.
vi
Figure 24: Super only treatment loss of TP within the first week following treatment application.
Figure 25: Non-reactive KBr Breakthrough curve. Figure 26: BTC’s of Organic P compounds with dung. Figure 27: BTC’s of Organic P compounds without dung. Figure 28: BTC for Potassium dihydrogen with dung. Figure 29: BTC for Potassium dihydrogen without dung. Figure 30: BTC for dung leachate treatment.
Figure 31: Results of NMR analysis of dung leachate sample.
Figure 32: Groundwater bore site located at Manuherikia TP and FRP (ORC 2014). Figure 33: ORC lysimeter South-arm TP and FRP.
Figure 34: ORC lysimeter East-arm TP and FRP. Figure: 35. Species detected in ³¹ P NMR spectra. Figure 36: ORC lysimeter Data, TP and DRP.
Figure 37: Estimated Maunuherikia water balance, ORC 2012. Figure 38: Water quality index. Modified from ORC (2012).
Table. 1: Broad grouping of stony soils, with the defining soil attributes. Carrick et al., 2013.
Table 2.1: Soil key physical properties.
Table 2.3a: Properties of Dung applied to lysimeters.
Table 3.1a: Background soil analysis results undertaken in October 2015, prior to trial treatment application.
Table 3.1b: ASC% by Potassium dihydrogen phosphate buffer prior to star of lysimeter trial.
Table 3.1c: Particle size analysed by the Otago University geography Laboratory. Table 3.1e: Lysimeters soil chemistry. Post-trial soil chemistry undertaken in April 2016.
Table 3.3a: First drainage events after application.
vii
Table 3.3c: Pasture cuts were taken from the lysimeter plots in January 2016. Table 3.4a: Balance of Total P in g/lysimeter.
Table 3.5a: Column treatments with dung, concentration and time to reach steady flow.
Table 3.5b: Colum treatments without dung, concentration and time to reach steady flow.
Table 3.6a: 0.1M NaOH + 0.05M Na-EDTA extraction results. Table 3.7a: Summary of anticipated P loss from studied sources. Table 4.6a: Median FRP mg/l for Lysimeters.
Chapter One: Introduction.
Phosphorus (P) is one of the main nutrients generally added to soils in the form of fertilizers, one of the main roles of P in living organisms is in the transfer of energy. Organic
compounds that contain P are used to transfer energy from one reaction to drive another
reaction within cells.
Phosphorus is an essential element classified as a macronutrient because of the relatively large amounts of P required by plants. Adequate P availability for plants stimulates early plant growth and hastens maturity. Although P is essential for plant growth,
mismanagement of soil P can pose a threat to water quality. The concentration of P is usually sufficiently low in fresh water so that algae growth is limited, however when lakes and rivers are enriched with P, excessive growth of algae often results.
Phosphorus is found in nature in various forms: mineral forms, organic forms (such as phospholipids, nucleic acids and proteins), gaseous forms, particulate or colloidal forms and dissolved inorganic forms” (Valls-Cantenys et al. 2012).
Research conducted within New Zealand has highlighted conditions where P loss to groundwater, is thought to be enhanced. These are: high soil Olsen P concentrations, soils with low anion storage (i.e. poor P sorption), and irrigation, which may regularly induce leaching to the vadose zone.
There has been abundant studies conducted on subsurface and groundwater transport of P in recent years. This review will examine the published literature regarding P loss to
1.1. Phosphorus cycle.
Phosphorus (P) is a primary plant nutrient. Unlike nitrogen, P is not part of the atmosphere. Instead, it is found in rocks, minerals, and organic matter in the soil. The mineral forms of P are apatite, which may be in a carbonate, hydroxide, fluoride, or chloride form, and iron or aluminum phosphates. These minerals are usually associated with basalt and shale rocks. Chemical reactions and microbial activity affect the availability of P for plant uptake. Under acid conditions, P is held tightly by aluminum and iron in soil minerals. Under alkaline conditions, P is held tightly by soil calcium.
Although P is widely distributed in nature, P is not found by itself in elemental form.
Elemental P is extremely reactive and will combine with oxygen when exposed to the air. In natural systems like soil and water, P will exist as phosphate, a chemical form in which each P atom is surrounded by 4 oxygen (O) atoms. Orthophosphate, the simplest phosphate, has the chemical formula PO₄¯³.
Figure 1: Phosphorus Cycle.
Plants use P for energy transfer and reproduction. Legumes require P for effective nitrogen fixation. Animals consume P when they eat forages. Phosphorus not used for animal growth is returned to the soil in manure. Following decomposition by soil organisms, P again
becomes available for plant uptake (Figure 1).
Much of the phosphate used by living organisms becomes incorporated into organic compounds. When plant materials are returned to the soil, this organic phosphate will slowly be released as inorganic phosphate or be incorporated into more stable organic materials and become part of the soil organic matter. The release of inorganic phosphate from organic phosphates is called mineralization and is caused by microorganisms breaking down organic compounds. The activity of microorganisms is highly influenced by soil
temperature and soil moisture (Busman et al. 2009). The main sources of potentially mobile P are fertilizers, manure, plant residue and P contained within soil.
1.2. Use of phosphate rock in fertiliser.
“The Green Revolution was a period in the mid-20th century (1930-1960) when the productivity of global agriculture increased drastically as a result of new advances and technology transfer. During this time period, new chemical fertilisers have made it possible to supply crops with extra nutrients and, therefore, increase yields. Synthetic herbicides and pesticides were also created contributing to increase yields. The production of P mineral
fertilisers uses phosphate rock (PR), a rock rich in the mineral fluorapatite [Ca5 (PO4)3F] and
phosphoric acid [H3PO4], which comes mainly from the treatment of PR with concentrated
sulphuric acid. Single superphosphate was the first commercial P mineral fertiliser and is manufactured from the reaction between sulphuric acid and PR. Whereas triple
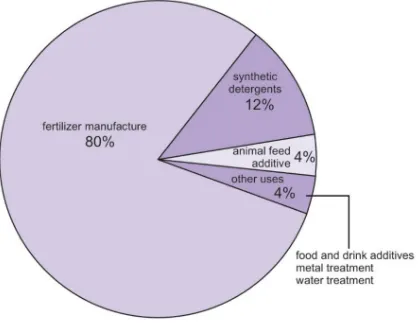
By far the largest use of phosphoric acid is in the manufacture of phosphates for use as fertilizers (Figure 2).
Figure 2: Uses of phosphoric acid.
http://www.essentialchemicalindustry.org/chemicals/phosphoric-acid.html.
1.3. Phosphate sustainability.
The economic importance of phosphate and its conservation has been broached in the past, in 1938, US President Franklin Roosevelt said it was “High time for the nation to adopt a national policy for the production and conservation of phosphates for the benefit of this and coming generations”. However a comprehensive policy was not adopted (Elser et al 2011). Phosphate rock is a finite natural resource and cannot be extracted forever to compensate for its use. Global food production relies on the provision of economically available supplies of inorganic fertilisers.
As noted by Childers (2011), there is no known chemical or technological substitute for P in either natural ecosystems or in the agrosystems that produce food and commodities, this coupled with the fact that the natural P cycle operates in geological time scales means that the increasing demand for this resource will lead to higher prices for dwindling economic supplies. As with oil, P resources are expected to “Peak” around about 2030 (Cordell et al. 2009), and are increasingly moving towards being a strategic mineral for many counties, who want to secure supply for their domestic production (Elser et al. 2011).
Most PR used in fertiliser production is sedimentary (>80%), but igneous deposits are also used and were formed mostly in shield areas and rift zones (Figure 3).
1.4. Eutrophication of fresh water surfaces and coastal oceans.
The anthropogenic eutrophication of aquatic ecosystems due to diffuse pollution of
agricultural P is a water quality problem that can be found globally. Anthropogenic inputs of P have dramatically increased over the last century and in the first world and increasingly in the developing world, nutrient transference by farming systems has overwhelmed natural cycles and led to P accumulation in agricultural soils. And as the P content in soil increases, so to the amount of P lost to surface water rises (Carpenter et al. 1998).
The management of agricultural sources of P and the potential for eutrophication is however difficult, as the task is hindered by the complexity of catchment processes, variability of management practices and variation in climate conditions. The balance between what is economically viable to the farm system is being balanced against what is required to keep receiving waters below a tropic state of decline (Kleinman et al. 2011).
1.5. Bioavailability to aquatic processes.
Figure 4: Phosphorus availability in water, (Correll 1998).
Bioavailable P will move between storage sites, re-mobilize in the water column and be available for uptake by consumers (Figure 4).
Commonly used terms to describe P in the forms that effect surface water quality are
Filterable reactive P (FRP), which is primarily dissolved orthophosphate (PO₄³⁻). FRP, usually
considered to be that fraction that passes through a 0.45 μm filter (McDowell et al. 2004) is
generally considered to be the most labile P form that contributes to eutrophication of surface waters.
The difficulties associated with eutrophication include a decline in drinking water quality, fisheries and water volume or flow. The main causes of these problems being algal blooms, macrophyte and littoral algal growth, altered thermal conditions, turbidity and low dissolved solids. Health conditions for human populations can include a range of skin irritations to schistosomiasis (acute and chronic disease caused by parasitic worms) and diarrhoea to potentially toxic cyanobacteria (Winder 2012). While representing a degradation of
Dodds et al (2009) explored the costs of eutrophication to the United States of America economy and found that when calculations of the potential annual value losses in
recreational water usage, waterfront real estate, spending on recovery of threatened and endangered species, and drinking water were totalled, the combined costs were
approximately $2.2 billion annually. The greatest economic losses were attributed to lakefront property values ($0.3-2.8 billion per year, although this number was poorly constrained) and recreational use ($0.37-1.16 billion per year). Diffuse loss of P to surface waterways is seen as a major worldwide cause of eutrophication in rivers, lakes, estuaries and coastal oceans (Carpenter et al. 1998).
New Zealand has an abundant supply of freshwater, on an average annual basis. However, water demand has grown in many areas due to agricultural development. Intensive dairy farming and dairy support has been identified as being a cause of nutrient enrichment of waterways (Hamill et al. 2003). The fresh water quality of New Zealand is considered very clean by international standards, however in dense urban and rural areas the water quality has degraded. Subsequently, a balancing act is required by government to help preserve local water bodies as a high quality resource, while enabling primary industry to continue with increased productivity to benefit the economy.
Increasingly, reviews of P losses from agricultural point toward diffuse or non-point pollution from intense production systems as being a less understood contributor to anthropogenic eutrophication in the past (Holman et al. 2008; Kleinman et al. 2011). The control of non-point diffuse sources of P is an important knowledge gap and a future research direction (Krovang et al. 2009, Delgado et al. 2008, McDowell et al. 2012).
1.6. Forms and sources of phosphorus.
Phosphorus plays a vital role in determining the function of productivity in terrestrial and
aquatic systems.Phosphorus dynamics in natural and managed ecosystems are determined
to a significant extent, by the complex nature of the interactions between the different forms of inorganic, organic and microbial P (Condron et al. 2011). In New Zealand
agriculture the use of P fertilizer, the inputs of animal dung deposited direct to paddock and the use of farm dairy effluent (FDE) has contributed greatly to increased amount of P
contained within the ecosystem. Therefore, it is practical to accept that as concentrations of P increase, so does the potential for mobility and transformation.
1.6.1. Organic P.
Organic forms of P include labile (combination of mineral and organic P) phospholipids, nucleic acids, inositol’s, fulvic acids and humic acids. This labile form of P undergoes reactions that see the simultaneous transformation of organic P to inorganic P (mineralisation) and the reverse where inorganic P is converted to organic P
(immobilisation)(McDowell et al. 2001; McLaughlin et al. 2011). The cycling of organic P
through available microbial biomass pools is also an important indicator of soil P availability, (Khan et al. 2012). Khan et al (2009) in a trial evaluating microbial biomass P in amended compost, observed that the stimulation of microbial biomass and incorporation of P into microbial cells occurred immediately after inorganic P addition, as microbial biomass rapidly stored easily soluble P preventing adsorption or other fixation processes.
1.6.2. Inorganic P.
In the soil profile, P exists in both inorganic and organic forms. Inorganic P has over 150 different mineral forms and varies in its solubility and ability to supply the soil solution with P. Factors that influence the solubility have been shown to include soil type, pH, the
concentration of aluminium (Al), iron (Fe), calcium (Ca) and magnesium (Mg) and the
concentration of anions that compete with P for exchange sites (Ligand reaction). P minerals generally have a low solubility and as such, the concentrations in the soil solution are low. The most abundant accepted form of soluble P available for plant uptake being
1.6.3. Excreta as a source of P.
In grazing systems worldwide, excreta (dung) has been used as an important source of nutrients to increase soil fertility and lift pasture production. As the scale of the farming system increases from small farm lots running modest sized herds, to large intensive operations that rely on commercial nutrient options such as fertiliser for production, accounting for manure inputs becomes problematic.
Losses of P from grazed pastures have been shown to come from fertilizer, soil, dung, and unused forage (McDowell et al. 2007). The effects of long term exposure of pasture to animal excreta is a concern for many researchers as it has been shown to increase overall P levels in soils with time (Carpenter et al. 1998; McDowell et al. 2004; Kleinman et al. 2011) amongst others, and has implications for the management of nutrient cycling within catchments (McDowell et al. 2011).
A review conducted by Edmeades (2003) compared the results of 14 long term (20 to 120 year) field trials to quantify the effects of manures and fertilisers on soil productivity. The results showed that manured soil had a higher content of organic matter and numbers of micro fauna than fertilised soils. Manured soils also had a lower bulk density and higher porosity, hydraulic conductivity and aggregate stability, relative to fertilised soils and excessive accumulation of some nutrients, particularly P and N from the long-term use of manures, relative to fertilisers.
The increase in New Zealand of instances where dryland pastures are exposed to irrigation through conversion to dairy blocks can, escalate nutrient enrichment. McDowell et al (2015) in a meta-analysis of published data found evidence to suggest that there exists a linkage between the enrichment of soil P beyond the agronomic optimum and dairying.
results in dung deposition and soil disturbance when the soil is typically wet (McDowell et al. 2003).
Animal manure patches have been shown to provide an immediate and long term source of largely water soluble P, which can under the correct conditions can be transported by run-off or leached into soil (Chardon et al. 2007; Lucci et al. 2013). It has been found that the most abundant form of P in dairy dung was in the form of inorganic P (McDowell 2005; Hao et al. 2008). Inorganic P in the form of orthophosphate is also the primary constituent of most P fertilisers, when added to soil it is either sequestered into forms not readily available to plants or extracted from soil water into plants and microbial biomass (McLaughlin et al. 2011). Aarons et al. (2004) found that soil pH, EC, inorganic P and total P pools all increased and that as a function of the nutrients released, changed the soil properties under the dung pat.
The pool of organic P provided by manure or other high P organic amendments has the capability to move more rapidly through the soil profile. Dissolved organic P movement maybe enhanced through the soil profile by lack of sorption compared to inorganic P (Leytem et al. 2002). However, studies have shown that in some instances, sorption sites may not always be preferentially taken up by orthophosphates, but compete with organic anions for adsorption sites (Nziguheba et al. 1998; Malik et al. 2012).
This can create a greater risk of dissolved organic P transfer to groundwater. This shows that understanding the potential for P transport in areas receiving large applications of animal manures is difficult. There are many aspects related to manure composition and the forms of P contained in manures which can affect the potential sorption of P in soils and its potential for transportation.
1.7. Pathways of phosphorus loss
Although surface run-off is deemed to be the major pathway for potential P loss from
pasture in the form of overland flow (Sharpley et al. 1992; McDowell et al. 2001), subsurface leaching of P has moved from being a subject that was poorly documented to a growing area of research, as seen by the rise in recently published works (Holman, Whelan et al. 2008; Djodjic et al. 2004; De Bolle et al. 2013; Gray 2015; McDowell et al. 2015).
This area of research is now leading to a closer investigation of differing soil types and their relationship with local geology and hydrological connections to surface waters (Carlyle et al. 2001; Kang et al. 2011).
The heterogeneity of the soil profile means that there is inherent difficulty in predicting the movement of mass (solids, liquids and gases) in the field situation, however to understand the mechanisms that lead to eutrophication of surface waters, there must be an
understanding of the important pathways for P loss.
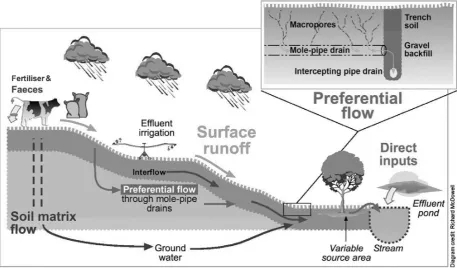
Figure 5: Conceptual diagram of potential sources and processes that transport phosphorus from the dairy pastures to surface water (McDowell et al. 2004).
1.7.1. Matrix flow.
Defined as the uniform downward movement of water through the macro-and micro pores of the soil. Contact time between solution and soil surfaces is measured in days and allows for P fixation by sorption sites within the soil matrix.
1.7.2. Preferential flow.
The movement of water with dissolved and suspended matter, preferential flow also moves downward in the soil but through the use of larger cracks, fissures, burrows and wormholes within the soil profile. Contact time is measured in minutes and hours and therefore there is less chance of P being adsorbed. Preferential flow increases transport of contaminants to surface waters and to groundwater and is seen as one of the most important pathways of P loss (Allaire et al. 2011).
leaching factor will see the solute breakthrough much earlier (Carrick et al. 2014; Jarvis 2007). The use of dye and conservative tracers has aided in identifying the potential flow pathways involved in the fast transport of P via macro pores. These preferential flow pathways are important in that they have demonstrated the potential to bypass the buffering capacity of the upper layers of the soil profile (Gächter et al. 1998; Clothier et al. 2008).
The loss of P in subsurface flow has been shown to decrease as P comes in contact with sorption sites within the soil matrix, this however may not occur where organic matter together with low P-sorption capacity (sandy soils or gravels) where sub-surface flows travel from areas of high P to the unsaturated zone (McDowell 2012).
It has been identified that in order to minimise the risk of P leaching that there must a measure of control made on the amount of P that is applied to soils. Of the many methods available to minimise P losses to waterways from pasture, one simple approach is to ensure that soil test P concentration is maintained within the range that is considered optimal for pasture production (Edmeades et al. 2006; McDowell et al 2012). Having soil P above optimal levels is found to increase the risk of leaching (Monaghan et al. 2008).
1.8. Stony soils
Economic incentives of a high milk solid price has led to an increase in dairy herds and milking platforms in many areas of New Zealand. The conversion of lowland dry stock pastures into dairy units has been widespread in some of the most vulnerable leaching areas. Many of these areas contain glacial outwash fans and till deposits of gravels and sands covered by thin soil layers.
Alluvial gravels are particularly vulnerable to leaching as they are highly permeable and have sufficient preferential flow paths that allow for rapid transport of P, Studies in New Zealand are limited as are those from overseas, however research in stony soils has increased in recent years (Carrick et al. 2013; De Bolle et al. 2013; McDowell et al. 2013; Gray 2015). Recent work in New Zealand points to increasing P concentrations within sand and gravel aquifers underlying soils used for intensive dairy farming (McDowell et al. 2015).
Anion storage capacity (ASC) is a measure used to describe the P immobilisation potential of a soil. The conventional ASC test is expressed as the percentage of P that is removed from a solution of 1000ppm P by the soil after shaking at 4.6 pH, when the soil will exhibit
maximum phosphate fixation. Soil ASC is categorised as High (<60%), Medium (30-60%), Low (<30%) (Saunders 1965).
Carrick et al. (2013), analysed significant land use change on stony soils since 2000. Analysis showed that 42% of stony soils have low ASC (<30%), 77% have moderate to rapid
Table. 1: Broad grouping of stony soils with the defining soil attributes. Carrick et al. (2013).
1.9. Purpose of this research.
The Otago Regional Plan: Water (Plan Change 6A), the purpose of which is to manage contaminant discharge and sediment from runoff, drains, leaching and earthworks, has established farm discharges limits in the Manuherikia river catchment of the Alexandra basin to be < 0.035 FRP mg/L by 2025.
Recent research conducted within the Alexandra basin of Otago, New Zealand, has
highlighted conditions where the loss to groundwater of the potential surface water quality contaminant P, can occur. These are: high soil Olsen P concentrations, soils with low ASC (i.e. poor P sorption), and irrigation, which may regularly induce leaching to the vadose zone. If coupled with an unconfined aquifer– groundwater may become enriched with P and contribute to nearby connected surface waters (McDowell et al., 2015). One rich source of P is the dung from grazing dairy cattle. A review of regional trends in New Zealand has identified areas with high FRP concentrations of leachate P tended to have a high stocking rate and /or moderate to low soil P ASC, whereas those with moderate stocking density had high concentrations due to low P ASC in soils (Dymond et al. 2013).
It has been reported that dairy dung from gazing stock and FDE are both contributing to loads of FRP (Longhurst et al. 2000; O'Connor et al. 2001; Aarons et al. 2004; Lucci et al. 2013), However, FRP was quickly sorbed in soils of higher ASC, resulting in <4% of FRP in leachate (Toor et al. 2005).
There is a need for further research to investigate and model the pathways of P loss in low ASC soils given the extent to which this class of soil is being developed. There is a crucial requirement to determine the transport time for fertiliser P and effluent P applied to the surface of a low ASC soil to move down the soil profile and potentially into groundwater, particularly in the face of expected dairy growth within these regions.
The research objectives were chosen to study the potential for P to move down the vadose zone and into groundwater from common P applications under irrigated and grazed dairy pastures.
Research Objectives:
1. The bioavailability of different P forms in these gravels.
2. Do these areas of low ASC gravels coincide with enhanced vertical P loss?
3. How long would intensive farming of these areas take to enrich groundwater P?
Objectives 1 and 2 will be addressed with leaching studies utilising monolithic soil lysimeters and laboratory based leaching experiments, on soils taken from a recently established dairy unit that occupies part of the Manuherikia River flood plain in the Alexandra basin.
Objective 3 will be addressed using data gained from Objectives 1 and 2, in combination with data obtained from the Otago regional council (ORC) deep pan lysimeter situated on
Chapter Two: Methodology.
2.1. Site description.
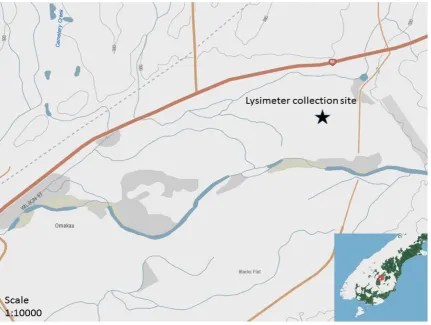
Lysimeters were collected in the spring of 2015 at 45° 05’40”S, 169° 37’57”E near the township of Omakau in the South Island of New Zealand (Figure 6). The study area landscape is described as semi-arid hill country with an irrigated low lying valley, characterized by terrestrial deposits from three distinct geological ages: lake and river sediments from a Pliocene conglomerate; and Quaternary/Pleistocene age outwash fans and alluvial deposits. The basin area is typified by the presence of low ASC soils. Agricultural practices are predominantly centred on sheep and beef farming, with a developing dairy industry.
The soil used for this trial came from a recently established dairy unit that occupied part of the Manuherikia River flood plain in the Alexandra basin. The farm was established in 2010 (270 ha) and supports a dairy unit operating with 3.2 cows/ha. This site was chosen as representing a potential high risk area for P loss to groundwater.
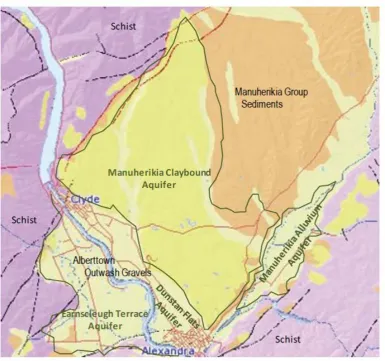
2.1.1. Groundwater hydrology.
Most of the available groundwater in the basin is contained within unconfined, water-table aquifers, which are primarily recharged by irrigation losses. These groundwater systems discharge their excess into the Clutha, lower Manuherikia or into the last kilometre of the Fraser Rivers. The aquifers are mainly high permeability sandy gravel systems, within glacial outwash of the Albert Town or Lindis advances. The base of these sandy gravel aquifers is generally defined by very low permeability silt and the mudstone beds of the Manuherikia group sediments. The collection site for the lysimeters sits above the Manuherikia alluvium or Manuherikia alluvial aquifer (Figure 7) and is defined by the flood plain of the
Manuherikia River on its true left bank between the exit of the Ophir Gorge and Alexandra. This area, and the Quaternary alluvium within it, defines a shallow, unconfined aquifer in hydraulic connection with the Manuherikia River (ORC 2012), therefore the potential for P transfer to surface waters is increased.
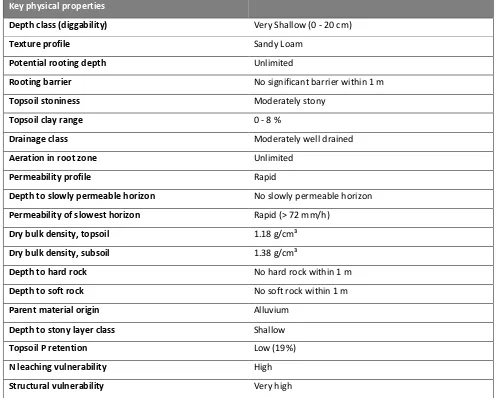
2.1.2. Soil key physical properties.
Soil key physical properties were examined prior to the excavation of Lysimeter cores. At the closest resolution 1:10000 scale provided by Landcare Research based S-map, the dominant soil class is displayed as an Orthic Gley Soil (Flaxtonf), however a paddock scale examination of the soil layers revealed a closer relationship to the adjacent Rangitataf soil class described as a Fluvial Recent soil. It was therefore decided to base the key soil properties upon the closest relationship. Information contained in Table 2.1 is based on available data from S-Map soil reports and details key properties of the dominant Rangitataf soil class. This provides an overview of the soil class, detailed analysis of paddock scale finding are included in the results.
Table 2.1: Soil key physical properties.
Key physical properties
Depth class (diggability) Very Shallow (0 - 20 cm)
Texture profile Sandy Loam
Potential rooting depth Unlimited
Rooting barrier No significant barrier within 1 m
Topsoil stoniness Moderately stony
Topsoil clay range 0 - 8 %
Drainage class Moderately well drained
Aeration in root zone Unlimited
Permeability profile Rapid
Depth to slowly permeable horizon No slowly permeable horizon
Permeability of slowest horizon Rapid (> 72 mm/h)
Dry bulk density, topsoil 1.18 g/cm³
Dry bulk density, subsoil 1.38 g/cm³
Depth to hard rock No hard rock within 1 m
Depth to soft rock No soft rock within 1 m
Parent material origin Alluvium
Depth to stony layer class Shallow
Topsoil P retention Low (19%)
N leaching vulnerability High
Particle size distribution of mineral fines was analysed by the Otago University geography Laboratory using a Malvern Mastersizer, Hydro 2000G with a Malvern autosampler 2000 attachment, with an added de-flocculation agent of Sodium Hexametaphosphate to prevent particles clumping together and being read as one large grain.
2.1.3 Lysimeter collection site
At the paddock scale the collection site consists of a dairy pasture containing a mixed clover/ryegrass sward, gently undulating and sloping towards the Manuherikia River. Irrigation is currently undertaken with a travelling irrigator also supplying FDE at a low rate application (Figure 8). The location for the excavation of the lysimeters was selected to avoid irrigator tracks and areas of high traffic to avoid areas of compaction. Areas of obvious urine or dung deposition were also avoided to limit differences between treatments. The pasture receives a maintenance N and P fertilizer rate of 200 and 45 kg N and P/ha/yr, respectively.
Figure 8: Lysimeter collection site.
Figure 9: Otago regional council Lysimeter site.
2.3. Lysimeter trial.
Collection of the lysimeters followed the method outlined by Cameron et al. (1992). A monolithic gravimetric lysimeter design was used with monoliths of 30 and 50 cm depths, excavated within a 300mm PVC pipe, giving a surface area of 708 cm². Lysimeters were excavated from the pasture by steel cutting tool and hand calving, the edges were then sealed with molten petrolatum to reduce the occurrence of edge flow. Monoliths were then capped with plywood top and bottom and bolted together to minimise disturbance during transport (Figures 10 and 11).
Figure 11: Calving and transport of monoliths form excavation site.
Upon return to Invermay campus the bottom cap was removed and the space between the soil and base cap was then filled with acid washed sand to fill any voids and allow for freely draining seepage collection. The space between the monolith and side wall of the casing was again checked for void spaces and petrolatum added in necessary. Lysimeters were then equilibrated outside at the Invermay research station for 2 weeks prior to installation in a pre-fabricated lysimeter trench and attached to 1000ml collection containers (Figure 12). A WatchDog Model 2700 weather station was installed alongside the lysimeter trench to measure rainfall, relative humidity and temperature with an additional manual rain gauge as a secondary reserve.
An automatic metered irrigation system consisting of Gardena T1030D control unit
connected to farm water supply was installed above the lysimeters, this was then fitted with individual adjustable mirco spray nozzles above each lysimeter with a spray shield to limit wind drift leading to irrigation loss. Trial runs of irrigation timing and volume were
Before the application of treatments, 50mm of irrigation water was applied over 2 weeks. Leachate was then collected and analysed for baseline concentrations of FRP and Total Phosphorus (TP).
Figure 12: Diagram of lysimeter design.
Dung was first analysed to determine nutrient content before application, the dung was collected the day before application and analysis was conducted by Eurofins overnight. Each dung application was weighed to 2kg (based on P content vs load required for 50kg/ha P), prior to placing on the lysimeter Table 3.3a displays characteristics of dung applied to lysimeters.
Table 2.3a: Properties of Dung applied to lysimeters.
Dung N†
%
P†
%
Cl†
%
TC†
%
0.59 0.13 <0.1 7.7
†Indicates: g/100g
Leachate was collected from the lysimeters after events or when drainage equalled 1 litre. Irrigation was applied on a daily basis from the end of October 2015 to February 2016, after which time collection was carried out on an event only basis. This was due to cost
restrictions of time and processing of laboratory samples. Therefore cumulative drainage may be under estimated.
Treatments were applied on the 29th of October 2015 and consisted of those common
concentrations and forms of P lost in leachate from P applications, under irrigated and grazed dairy pastures. The aim being to provide data to better understand the potential for P to move down the vadose zone and into the groundwater.
Each depth (30 cm and 50cm) had 6 replicates of 4 treatments consisting of:
• Control (no P).
• Superphosphate (50 kg P ha).
• Dung (dairy at 50 kg P ha).
Figure 13: Lysimeter dung treatment at time of application.
Dung used in the treatment was sourced from a local dairy farm running a similar feed regime to the Omakau site, with a mixed sward of clover/ryegrass. Dung was sourced from a pasture grazed no longer than 24 hrs earlier by dairy cattle and sent for overnight analysis of nutrient content by a commercial lab prior to application.
The application of dung treatments to the lysimeters used a steel ring to contain the dung within the lysimeter until it could stand unassisted, thereby retaining the P load intended for the lysimeter (Figure 13). Each dung application was weighed to 2kg (based on P content vs load required), prior to placing on the lysimeter.
Figure 14: Superphosphate treatmentat time of application.
Irrigation water (480 mm overall) was applied from Oct 2015 to April 2016 by metered application of 3mm per day, which together with natural rainfall over this period delivered 800 mm of total irrigation.
2.3.1. Lysimeter sampling.
At start of the trial, soil was sampled at 10 locations within the dairy pasture, near the lysimeters excavation site and from 0-7.5, 7.5-15, 15-30, 30-40, 40-50 cm depths. This was then analysed for ASC, Olsen P, water extractable P and pH.
ASC was determined using the P concentration remaining in solution measured
Olsen P was measured by extracting air dried soils in a 0.5 M sodium bicarbonate solution at 8.5 pH for colorimetric analysis (Olsen et al 1954).
Water extractable P provides a direct estimate of the potential FRP loss to surface waters, therefore following the methods of McDowell et al.(2004), air dried samples of 0.50g (> 2 mm well homogenised) soil were added to 150ml of RO water and shaken for 45 min. Filtered (< 0.45 µm) and P concentration determined colorimetrically by the Murphy Riley method.
Leachate was sampled in response to natural rainfall events (> 5 mm) and weekly (whichever was the more frequent). There were cost limitations on the amount of
laboratory analysis that could be conducted, therefore sampling after the first few weeks of initial activity in the lysimeters was based on responding to significant rainfall events, whilst continuing to monitor the performance of the trial site.
Total volume of leachate per event was recorded during collection and the filtering of
samples was conducted during collection.Leachate was filtered with a < 0.45 µm glass fibre
syringe filter and FRP, TP and Total filterable P determined colorimetrically using the method of Watanabe et al.(1965) on a T80+UV/VIS Spectrometer at the 712nm range +/- 2µm.
Soil Total P was conducted by perchloric acid digestion (Sommers et al.1972). 0.20g (> 1mm, well homogenised) soil in glass digestion tubes were left overnight in fume hood to oxidise the organic matter. The following day 250µl MgCl₂ was added to each tube and digested at
80°c for 30 mins. Once cooled, 3ml perchloric acid was added to each tube and placed back on digestion block and gradually increased to 210°C until soil residue turned white and the solution was clear. It was then allowed to cool before samples were then diluted to 50 ml with RO. Samples were filtered with GFA grade filters before colorimetric analysis.
Sub-samples (unfiltered) of 70ml were retained for persulphate digestion, and the
remaining sample bulked in 5 litre containers according to treatment and depth, for later use in the column experiment, these samples were then stored in a 2.0°C until required.
2.4. Column experiment.
To investigate the attenuation and transport of differing P compounds in the gravel aquifer media, we conducted a series of column experiments. Column experiments were used as a time and cost effective means of providing BTC (breakthrough curves) to estimate
parameters of physicochemical processes in the substrate. Column trials were conducted from 0ctober to November 2015 at the Invermay campus.
Gravels used in the experiment were sourced from the same location as the Lysimeter trial but at a depth of 1-2m below the plough layer. Gravels were then air dried at Invermay campus and sieved to 8mm to allow for packing into small columns of 300mm x 75mm, giving a volume of 1325.3 cm³. Columns had a 3mm hole drilled into the concave base to allow for drainage and were fitted with 1mm fine mesh and material voil covering to limit small fines from entering the leachate. Columns were saturated for 24 hours in Reverse osmosis (RO) treated water to fill pore space, thereby limiting the occurrence of preferential flow, and allowed to drain for 1 hour prior to treatments being applied.
Treatment solutions of 1 litre were prepared the day before application to a 2 ml/g
concentration and refrigerated overnight. Before application, solutions were brought up to room temperature of approximately 18°C. All treatment solutions were injected manually by syringe evenly across the tops of the columns at a rate of 200ml/hr and leachate
collected, filtered and analysed the same day for FRP and TP. A simple bench top system was constructed for the columns, attached to supporting stainless steel rods that allowed for the collection of leachate into graduated collection containers (Figures 15 and 16).
Columns breakthrough curves of organic P compounds were examined for species
behaviour and compared to orthophosphate (as KH₂PO₄) as an indication of mobility. All
columns. Columns were not reused between treatments to eliminate contamination risk.
Figure 15: Column experiment arrangement.
Treatments included were a non-reactive KBr tracer at 1 mg Br/L and (largely organic) P compounds of Phosphocreatine, D-glucose 6 phosphate, D-glucose 1-phosphate, 4-nitrophenyl, Adenosine, Bis p-Nitrophenyl phosphate, Phytic Acid, Guanosine-Monophosphate, n-(phosphonomethly)glycine 9, Potassium dihydrogen , Lecithin, o-phospho-6-serine (all 2 mg P/L). These compounds were used to represent a range of monoester and diester P.
In addition to the organic P compounds, leachate collected from the dung treatments of the lysimeter trial was applied to column, with and without a bromide tracer. Concentrations of the KBr tracer were recorded during the column runs with a Thermo scientific Orion Star meter with attached solid state Ion selective electrode probe to indicate a relative steady flow state of the solute. Sub-samples of the leachate collected and retained in a chiller, for use in column trial treatments were analysed for FRP and TP prior to use in column
experiments.
2.5. NaOH-EDTA extraction and ³¹ P nuclear magnetic resonance spectroscopy
(³¹ P NMR).
To determine the organic P species leached from the lysimeters a sample of dung leachate was analysed by ³¹ P nuclear magnetic resonance spectroscopy (³¹P NMR).
A 5L sample of dung leachate collected from the lysimeter trial, was freeze dried down to 2.2g in preparation for extraction. The freeze dried dung leachate sample was shaken in 40 mL of 0.1M NaOH + 0.05M Na-EDTA for 2 hrs. Then filtered through a small GF/A filter paper. A subsample of 0.1mL was taken and diluted to 10mL, this was then analysed for reactive P and total P. The remaining 39.9mL was frozen and freeze-dried, in preparation for (³¹ P NMR) analysis.
Analysis was conducted by the Otago University chemistry department. ³¹P NMR spectra were obtained using a Varian 500MHz Inova NMR spectrometer at 25°C. Shimming (z1-z4) was performed manually using the shape of the water line in the 1H spectra of the sample. A Varian 10mm Broadband probes was used. Samples were locked on the D2O and run at 202.298 MHz, at 20oC, with a spectral window of 12247 Hz, using 65536 data points.
Chemical shifts were recorded relative to an external phosphoric acid standard (δ = 0 ppm)
in a capillary tube. Samples were prepared to a pH > 13 by taking 1 g of the dried extract, adding 3mL of D2O and 500 µL of 10M NaOH. Samples were ultrasonicated for 3 min, equilibrated for 20 min, and then centrifuged.
2.6. Laboratory analysis.
Lab analysis was conducted at the Invermay research campus where practical, during the course of the trial work, with limited use of outside analytical services. This analysis
2.7. Quality control
To avoid contamination, all samples were filtered through new glass fibre syringe filters into unused sterile containers. All glassware used in digestions and colorimetric work was
washed in 0.25 M sulphuric acid followed by distilled water between sample runs.
Quality control of samples included reagent blanks and blank samples for each analytical run, with 10% of the total samples run as duplicates. Calibration standards were first run to ensure instrument performance. Calibration standard curves were calculated from
absorbance vs P concentration using linear regression to calculate the P concentration in each sample for the measured absorbance.
2.8. Statistical analyses and modelling.
Statistical analyses was conducted using Genstat 18th Edition to examine analysis of
variance of log transformed data, examining treatment to treatment interaction factoring in date, depth and treatment. Minitab 17.81 was used for confirming the normal distribution of background lysimeter results, Grubb’s outlier test and further ANOVA analysis of main effects of treatment and date.
Chapter Three: Results
3.1. Soil physical properties
Results are presented for the key soil physical properties of the lysimeter collection site at Omakau, Central Otago. Background as well as post-trial soil chemistry data is reported for
pH, Olsen P and Total P.The Key results of soil analysis are presented in tables 3.1a to 3.1d.
Full soil results are presented in the Appendix.
Table 3.1a: Background soil analysis results for the lysimeter study undertaken in October 2015, prior to trial treatment application.
Depth pH Olsen P mg/kg Total P mg/kg
0-10 cm
(n=10) 6.14 (0.10) 25.6 (3.8) 818.0 (55.4)
10-20 cm
(n=10) 6.26 (0.05) 14.2 (2.5) 663.3 (61.1)
20-30 cm
(n=10) 6.42 (0.24) 11.2 (2.8) 546.2 (63.8)
30-40 cm
(n=10) 6.66 (0.36) 8.8 (4.9) 428.5 (87.6)
40-50 cm
(n=10) 6.72 (0.38) 8.5 (4.6) 417.6 (51.7)
Table 3.1b: ASC% by Potassium dihydrogen phosphate buffer prior to start of lysimeter trial.
Depth Anion storage capacity (ASC) %
0-10cm 6
10-20cm 7
20-30cm 6
30-40cm 6
40-50cm 5
ASC is lower than reported by the soil class description given by S-Map (19%).
Table 3.1c: Results are displayed for particle sizeanalysed by the Otago University geography Laboratory, from sampling of trial site from 10 cm to 50cm depth.
Depth cm % GRAVEL: % SAND: % MUD: % Clay
0-10 cm 0% 70.70% 29.20% 0.002%
10-20 cm 0% 63.90% 36.06% 0.004%
20-30 cm 0% 54.24% 45.74% 0.007%
30-40 cm 0% 68% 31.99% 0.005%
Figure 17: Particle size plotted against the logarithm of effective particle size shows a frequency distribution curve that indicates the Sand fraction as the dominant particle size contained within the background soil samples from the lysimeter collection site.
Results of particle size analysis are displayed in the Ternary diagrams of Figures 18 and 19 and give an illustration the proportions of sediments found. Textural groups of samples to 50cm depth ranged from Sand-muddy Sand to Sandy mud. Sediments were identified as ranging between Poorly Sorted Medium Sand to Very Fine Sandy Very Coarse Silt.
0 1 2 3 4 5 6 7
1.0 10.0 100.0 1000.0
C
lass
w
ei
gh
t (
%
)
Table 3.1e: Lysimeters were destructively sampled at the end of the trial to determine changes in the soil chemistry. Results are displayed for samplings of post-trial soil chemistry undertaken in April 2016.
Depth Treatment Olsen P (mg/kg) WEP P (mg/L) Total P (mg/kg)
0-10 cm Control 6.0 (0.06) 0.06 (0.01) 682.1 (12.0)
10-20 cm Control 4.3 (0.17) 0.047 (0.004) 651.0 (15.8)
20-30 cm Control 3.2 (0.26) 0.045 (0.006) 574.9 (12.5)
30-40 cm Control 2.7 (0.50) 0.041 (0.001) 845.0 (273)
40-50 cm Control 2.7 (0.24) 0.039 (0.005) 526.5 (24.0)
0-10 cm Dung 15.0 (1.79) 0.100 (0.004) 792.7 (22.7)
10-20 cm Dung 5.2 (0.81) 0.054 (0.005) 644.0 (27.0)
20-30 cm Dung 3.7 (0.59) 0.054 (0.008) 543.8 (33.0)
30-40 cm Dung 2.9 (0.59) 0.047 (0.004) 363.9 (64.6)
40-50 cm Dung 2.3 (0.41) 0.043 (0.004) 516.1 (37.4)
0-10 cm Super 5.5 (1.07) 0.062 (0.003) 744.3 (18.0)
10-20 cm Super 4.1 (0.46) 0.050 (0.004) 748.0 (190.0)
20-30 cm Super 3.1 (0.5) 0.046 (0.006) 657.9 (72.2)
30-40 cm Super 2.7(0.65) 0.049 (0.006) 595.6 (50.9)
40-50 cm Super 2.7 (0.17) 0.047 (0.005) 536.8 (45.20
0-10 cm Super + Dung 12.7 (1.83) 0.086 (0.006) 827.3 (59.9)
10-20 cm Super + Dung 5.1 (0.35) 0.055 (0.002) 672.0 (156.0)
20-30 cm Super + Dung 3.9 (0.24) 0.052 (0.004) 568.0 (49.0)
30-40 cm Super + Dung 3.7 (0.29) 0.047 (0.005) 481.5 (56.9)
40-50 cm Super + Dung 3.1 (0.26) 0.042 (0.007) 443.5 (29.9)
3.2. Climate.
General climate conditions were favourable. Annual temperatures were above average (0.51°C to 1.20°C above the annual average) throughout the trial period.
Rainfall was near normal (within 20% of the annual normal) expected within the Lysimeter trial site, with a recorded 303mm of precipitation. No major rainfall events during the period of the trial.
Rainfall for the period of the 28th October 2015 to end of March 2016 is shown in Figure 20.
Moderate rainfall events were recorded on the 26th November 2015, with 32mm occurring
and again on the 13th and 26th of January 2016 with 24mm falling and 19mm respectively.
Figure 20: Rainfall for the period of the 29th of October 2015 to end of March 2016. 0
50 100 150 200 250 300 350
30-Oct-15 30-Nov-15 31-Dec-15 31-Jan-16 29-Feb-16 31-Mar-16
mm
Rainfall for lysimeter site.
3.3. Lysimeter trial results.
Results are presented for the lysimeter trial conducted at the Invermay Research Station.
Treatments were applied on the 29th of October 2015 and the first collection occurred the
following day after irrigation had been applied.
Error bars at the 95% confidence level.
Figure 21: Sum of drainage recorded from sample collection during the trial period. Based on volume collected and lysimeter surface area.
Across all treatments there was variability of drainage characteristics of individual
lysimeters. Lysimeter number 46 of the dung only treatment consistently recorded lower volumes due to clogging of the drainage outlet. Number 2 lysimeter of the dung treatment was also excluded from the results due to problems with edge flow. Both were excluded from the results.
175 180 185 190 195 200 205 210 215 220 225
Control Dung Super Super+Dung
Su
m o
f d
ra
in
ag
e mm
Analysis of variance indicated that P fractions within the lysimeters were not significantly different before application, however the first sampling after treatments were applied shows a significant difference in FRP, TFP and TP between the control and all other treatments (P< 0.05).
Table 3.3a: The first drainage events after application which saw a marked increase in FRP, TFP and TP from all treatments excluding the control, however only the Super 50kg/ha treatment was shown to be statistically different at the 30cm depth during the first week after treatments were applied.
FRP
(mg/L) (mg/L) TFP (mg/L) TP
control 30cm
30/10/2015 0.088 (0.04) 0.149 (0.02) 0.234 (0.03) 4/11/2015 0.147 (0.06) 0.249 (0.03) 0.307 (0.05)
50cm
30/10/2015 0.060 (0.02) 0.177 (0.01) 0.369 (0.17) 4/11/2015 0.044 (0.01) 0.171 (0.01) 0.530 (0.17)
dung 30cm
30/10/2015 0.177 (0.09) 0.156 (0.03) 0.340 (0.12) 4/11/2015 0.414 (0.16) 0.533 (0.06) 1.336 (0.14)
50cm
30/10/2015 0.053 (0.01) 0.220 (0.02) 0.542 (0.26) 4/11/2015 0.329 (0.14) 0.319 (0.07) 0.832 (0.29)
Super 50kg P/ha 30cm
30/10/2015 0.066 (0.01) 0.182 (0.04) 0.276 (0.07) 4/11/2015 0.603 (0.11) 2.759 (0.48) 3.546 (0.68)
50cm
30/10/2015 0.043 (0.006) 0.167 (0.02) 0.604 (0.28) 4/11/2015 0.543 (0.25) 0.704 (0.32) 0.880 (0.40)
Super+dung 100 kg P/ha 30cm
30/10/2015 0.051 (0.01) 0.119 (0.005) 0.276 (0.06) 4/11/2015 0.450 (0.09) 1.592 (0.33) 2.510 (0.48)
50cm
30/10/2015 0.041 (0.003) 0.220 (0.03) 0.566 (0.38) 4/11/2015 0.073 (0.03) 0.189 (0.02) 0.353 (0.10)
The Super only treatment had the largest loss of FRP, TFP and TP for 2 weeks following treatment application (Figures 22-24).
Error bars at the 95% confidence level.
Figure 22: The Super only treatment had the largest loss of TFP during the first week after treatment application, with an average of 2.759 mg/L TFP lost at the 30cm depth and 0.704 mg/L lost at 50cm, compared to 0.249mg/l and 0.171 mg/l for the control treatment.
With a greater proportion of TFP loss in the 30cm depth and decreasing to the 50cm depth. This loss was significantly (P<0.05) different between depths for the first 2 samplings after which it then rapidly dropped off to non-significant levels compared with the control.
0 0.5 1 1.5 2 2.5 3 3.5
30/10/2015 4/11/2015 9/11/2015 30/10/2015 4/11/2015 9/11/2015
30cm 50cm
TF
P
(m
g/
L)
Date
control
dung
super 50kg P/ha
Error bars at the 95% confidence level.
Figure 23: The Super only treatment had the largest loss of FRP during the first week following treatment application, with an average of 0.603 mg/l FRP lost at the 30cm depth and 0.543 mg/l lost at 50cm.
Error bars at the 95% confidence level.
Figure 24: The Super only treatment had the largest loss of TP within the first week following treatment application, with an average of 3.546 mg/l TP lost at the 30cm depth and 0.880 mg/l lost at 50cm, with the largest loss being from the 30cm depth.
0 0.1 0.2 0.3 0.4 0.5 0.6 0.7 0.8
30/10/2015 4/11/2015 9/11/2015 30/10/2015 4/11/2015 9/11/2015
30cm 50cm FRP ( m g/ L) Date control dung
super 50kg P/ha super+dung 100kg P/ha
0 0.5 1 1.5 2 2.5 3 3.5 4
30/10/2015 4/11/2015 9/11/2015 30/10/2015 4/11/2015 9/11/2015
30cm 50cm TP ( m g/ L) Date control dung
Loads of P fractions measured are presented in Table 3.3b. Results are presented in grams/lysimeter due to only 6 months data being collected from the lysimeters. Results
when expressed as kg¯¹ha¯¹yr are consistent with findings of (McDowell, 2008, Toor et al,
2004 amongst others) for measured annual TP loss from pastured fields and catchments
from dairy systems in New Zealand, at 0.34 to 0.90kg¯¹ha¯¹yr.
Table 3.3b: Loads of P lost by fraction are presented in grams/lysimeter due to only 6
months data being collected from the lysimeters, therefore not reflecting the true Kg¯¹ha¯¹yr
value.
Treatment FRP (g) FURP (g) TFP (g) PP (g) TP (g) Control (total) 0.0133 0.0108 0.0241 0.0223 0.0464
30cm 0.0082 0.0068 0.0150 0.0092 0.0242
50cm 0.0051 0.0040 0.0091 0.0131 0.0222
Dung (total) 0.0262 0.0172 0.0549 0.0538 0.108
30cm 0.0194 0.0129 0.0323 0.0266 0.0588
50cm 0.0068 0.0043 0.0226 0.0272 0.0498
Super 50kg P/ha (total) 0.0326 0.0180 0.0505 0.0232 0.0738
30cm 0.0227 0.0136 0.0363 0.0136 0.0499
50cm 0.0099 0.0044 0.0143 0.0096 0.0239
Super+Dung 100 kg P/ha (total) 0.0290 0.0266 0.0555 0.0326 0.0882
30cm 0.0212 0.0211 0.0423 0.0218 0.0641
50cm 0.0077 0.0055 0.0132 0.0108 0.0241
Dung and Super only treatments were not significantly different from each other, however the Super + Dung treatment showed the highest overall loss of filterable unreactive
Phosphorus (FURP) and was significantly different to all other treatments.
The Super + Dung treatment had the highest loss of TFP, and was significantly different between those treatments that received Dung and Super only.
During rainfall events in November 2015 and January 2016, particulate P (PP) concetrations in the Dung and Dung + Super treatments were significantly different to all other
treatments, however when examining the total load of PP it was found that the Dung only treatment was significantly different to all other treatments.
The control treatment was significantly different to all other treatments, with the lowest loss of PP.
Leaching loss data for treatments are given in the Appendix.
Table 3.3c: Pasture cuts were taken from the lysimeter plots in January 2016 and analysed for Total P. Regular pasture cuts were not taken throughout the trial and the results
comprise of the first cut after treatment application, and encompass the period of high post application loss of treatment P.
Treatment Sum of Total P (g/lysimeter). Average of % P per 100g
Control 0.089 (0.048) 0.27
Dung 0.281 (0.008) 0.33
Super 50kg P/ha 0.098 (0.009) 0.30
Super+Dung 100 kg P/ha 0.270 (0.027) 0.30
3.4. Mass balance table.
Table 3.4a: Balance of Total P in g/lysimeter. A mass balance takes into account known inputs of fertilizer and compares against outputs of Total P in leachate to the 50cm depth, to account for potential loss below the plough layer of the pasture.
P Inputs Depth
cm Control Dungᶜ Super Super + Dung
Fertilizer 0 0 3.88 3.88
Soil at start 30 16.890 16.890 16.890 16.890
50 8.243 8.243 8.243 8.243
Dung 0 2.6 0 2.6
P outputs
Plantᵃ 0.290 0.913 0.319 0.877
Leaching 30 0.024
(0.0004) (0.0013) 0.058 (0.0016) 0.049 (0.0019) 0.064
50 0.022
(0.0007) (0.0014) 0.049 (0.0005) 0.023 (0.0009) 0.024
Soil at endᵇ 30 15.895
(0.013) (0.027) 16.499 (0.190) 17.913 (0.088) 17.222
50 10.439
(0.026) (0.042) 8.574 (0.048) 11.033 (0.043) 9.012
Unknown
loss/gainᶜ 30 -0.681 -2.020 -2.489 -5.207
50 2.508 -1.307 -0.748 -4.810
Brackets denote the SE of Mean.
ᵃ Plant uptake estimated from P measured in first cut and projected for 6 months.
ᵇ Soil sampled 12 months after trial start.
ᶜ Loss does not account for P sequestered in remaining dung pad.
3.5 Column trial results.
Results are presented for the laboratory column trial conducted at the Invermay Research Station. This laboratory trial was conducted using gravels excavated from below 1m depth at the Omakau site.
Breakthrough curves (BTC) were established for the P compounds presented in Table 3.5a. Compounds were put through the gravel column one time only due to constraints of time and resources, therefore results reflect an indication of the behaviour of the different compounds and not a more detailed analysis that repeating the column treatments would have provided.
Before the P compounds were applied to the columns, a non-reactive solution of Potassium Bromide (KBr) was injected into a saturated column to determine the time at which a steady flow rate of 1 mg/l would be achieved if samples were taken every 10 min and analysed with an ion selective probe. The resulting time to reach steady flow rate was 130 min, which was indicative of 1 pore volume. This result allowed for the determination of the potential time and quantity of samples that would be generated from the multiple P compounds. Results of the KBr application is presented in Figure 25.
Figure 25: Non-reactive KBr Breakthrough curve.
0 0.2 0.4 0.6 0.8 1 1.2
10 20 30 40 50 60 70 80 90 100 110 120 130 140 150 160 170 180
KB
r m
g/l
Time since irrigation start (Min)