Gestational Diabetes and the Risk of Offspring Obesity
Robert C. Whitaker, MD, MPH*; Margaret S. Pepe, PhD‡; Kristy D. Seidel, MS‡; Jeffrey A. Wright, MD§;
and Robert H. Knopp, MD
i
ABSTRACT. Background. Intrauterine exposure to the metabolic alterations of maternal diabetes may in-crease the risk of later obesity. We determined whether offspring of mothers with diet-treated, gestational diabe-tes mellitus (GDM) have an increased risk of childhood obesity and examined the relationship between child-hood obesity and metabolic markers of GDM.
Methods. At a health maintenance organization in Seattle, WA, we reviewed medical records to obtain the life-time height and weight measurements of 524, 8- to 10-year-old children whose mothers had been screened for GDM. Maternal plasma glucose and triglyceride lev-els were obtained in midgestation 1 hour after ingestion of 50 g of glucose. Those with glucose screening levels
>7.77 mmol/L (140 mg/dL) underwent a 3-hour, 100-g,
oral glucose tolerance test to determine GDM status. Cord serum insulin levels also were obtained at birth. Obesity was defined as an average body mass index between 5 and 10 years of age at or above the 85th percentile for age and sex.
Results. The prevalence of obesity was 19% in the 58 offspring of mothers with diet-treated GDM and 24% in the 257 offspring of mothers with negative glucose screen values. There also was no difference in mean body mass index (adjusted for age and sex) between these two groups of offspring. Among all 524 offspring, there was no significant increase in the rate of offspring obesity according to the quartile of maternal screening glucose, triglyceride, oral glucose tolerance test, or cord serum insulin level.
Conclusion. Prenatal exposure to the metabolic ef-fects of mild, diet-treated GDM does not increase the risk of childhood obesity.Pediatrics1998;101(2). URL: http:// www.pediatrics.org/cgi/content/full/101/2/e9; pregnancy in diabetes, obesity, fetus, child, body mass index.
ABBREVIATIONS. IDDM, insulin-dependent diabetes mellitus; GDM, gestational diabetes mellitus; NIDDM, noninsulin-depen-dent diabetes mellitus; GHC, Group Health Cooperative of Puget Sound; HMO, health maintenance organization; OGTT, oral glu-cose tolerance test; BMI, body mass index.
C
hildren born to mothers with
insuldepen-dent diabetes mellitus (IDDM) have an
in-creased risk of later obesity.
1–5These children
may be programmed in utero for later obesity by
exposure to excess metabolic substrate at a sensitive
period in development.
6 – 8Gestational diabetes
mel-litus (GDM), that is, diabetes with onset or first
rec-ognition during pregnancy,
9affects 3% to 5% of all
pregnancies.
10,11GDM is far more common in
preg-nant women than is existing IDDM or
noninsulin-dependent diabetes mellitus (NIDDM). Previous
studies suggest that GDM also increases the risk for
later obesity in the offspring.
12–15Each of these
stud-ies, however, contained a mixture of subjects with
GDM and either IDDM or NIDDM. No study has
ever compared childhood obesity rates in offspring
of mothers with and without GDM. Therefore, we
tested the hypothesis that offspring from
pregnan-cies affected by GDM have an increased risk of
child-hood obesity. To suggest a possible mechanism by
which the intrauterine environment affects later
obe-sity risk, we also examined the association between
childhood obesity and the metabolic markers of
GDM measured during gestation.
METHODS
The study was conducted at Group Health Cooperative of Puget Sound (GHC), a staff-model, health maintenance organiza-tion (HMO) in Washington state. In 1985 and 1986, 977 pregnant women at GHC participated in a study of screening tests for GDM.16,17The offspring of these pregnancies, followed up at 5 to
10 years of age, are the subjects of the current study. The study was approved by the Human Subjects Review Committees both at the University of Washington and at GHC.
GDM Screening Study
At between 24 and 32 weeks’ gestation, plasma glucose and triglyceride levels were obtained from each mother 1 hour after a 50-g, oral glucose load. Those with glucose screening values $7.77 mmol/L (140 mg/dL) were recalled for a 3-hour, 100-g, oral glucose tolerance test (OGTT). At delivery, an attempt was made to obtain serum insulin levels from the cord blood of all infants. All 3517 women who enrolled for prenatal care at the two main GHC prenatal clinics between January 1985 and May 1986 were potentially eligible for the GDM screening study (Fig 1). A total of 2019 women without known diabetes consented to participate. Of these, 1477 had a normal glucose screen value, 456 had an abnor-mal screen value, and 86 were excluded for reasons such as twin gestation or delivery at a non-GHC hospital. A control group of 521 mothers was selected randomly from those 1477 with a normal glucose screen value. The 456 mothers with an abnormal glucose screen value were placed in one of three other groups based on the OGTT result. GDM was diagnosed in 101 mothers, based on any two of the four OGTT values exceeding the criteria published by Carpenter and Coustan18; 264 had a normal OGTT result, and 91
refused to undergo the OGTT. All with GDM were generally prescribed a 7560 to 9240 J (1800- to 2200-kcal) diet low in oligo-From the *Department of Pediatrics, Children’s Hospital Medical Center
and the University of Cincinnati College of Medicine, Cincinnati, Ohio; ‡Biostatistics Program, Division of Public Health Sciences, Fred Hutchinson Cancer Research Center, Seattle, Washington; and the Departments of §Pe-diatrics andiMedicine, University of Washington School of Medicine, Se-attle, Washington.
This paper was presented at the meeting of the North American Association for the Study of Obesity, Breckenridge, CO, October 13, 1996.
Received for publication Jul 16, 1997; accepted Oct 14, 1997.
Reprint requests to (R.C.W.) Children’s Hospital Medical Center, Division of General and Community Pediatrics, CH-1S, 3333 Burnet Ave, Cincinnati, OH 45229-3039.
saccharide, and they were instructed in home glucose monitoring. Women began to receive insulin if they had fasting glucose values
.5.9 mmol/L (105 mg/dL) and/or 2-hour postprandial glucose values .6.7 mmol/L (120 mg/dL) on two or more occasions within a 2-week period. Of those mothers with GDM, only 5 were treated with insulin. Two of these five were begun on insulin therapy based on elevated glucose screening values (9.3 mmol/L [168 mg/dL] and 11.0 mmol/L [198 mg/dL]) and did not have an OGTT.16
Offspring Follow-up Study
Most offspring of mothers in the GDM screening study re-ceived subsequent health care at GHC, and childhood growth measurements were available in their outpatient medical charts. Because our hypotheses related to childhood obesity, offspring were eligible for this follow-up study only if their chart contained at least one height and weight measurement, recorded on the same day, on or after their fifth birthday. For eligible offspring, we obtained all height and weight measurements recorded before January 1, 1996, in the outpatient medical chart (unless from an emergency department visit). We excluded six children with con-ditions having a major impact on stature and/or adiposity (eg, cancer), and three offspring were stillborn.
Outcome Measures
We used body mass index (BMI) (weight [kilograms] divided by height [meters] squared) to assess fatness. Although BMI does not measure fatness directly, it is an acceptable surrogate measure of childhood fatness among indices derived from height and weight measurements.19,20BMI in children is correlated with direct
measures of adiposity,21blood pressure,22and serum lipid23and
insulin concentrations.24
BMI points (height and weight measurement recorded on the same day) were standardized for age and sex by conversion to az
score. This standardization was required because children were measured at different ages and because BMI varies with age. To standardize BMI, we usedzscores rather than percentiles, because
zscores are more normally distributed and becausezscores more clearly convey the magnitude of BMI difference between any two measurements at the extremes of the BMI distribution. Thezscore was calculated as (BMI2mean)/SD, where the mean and SD of BMI were from a reference population of the same age and sex as the subject. For points after 3 years of age, we used as a reference the combined data from National Health and Nutrition Examina-tion Surveys I and II,25and for points before 3 years of age, we
used data from the Fels Longitudinal Study (S. Guo, personal communication, September 20, 1995). Means and SD values of BMI for specific ages (eg, 6.2 years) were found by linear
interpo-lation between discrete ages (eg, 6 years and 7 years) given in the reference data.
For each subject, we calculated the average BMIz score be-tween 5 and 10 years of age. For subjects with two or more BMI points between 5 and 10 years of age, we estimated the average BMI z score by interpolating data linearly between available points and extrapolating the first and last points out to the ends of the 5- to 10-year interval. The formula used for the average was therefore,
(
i51 K111
2(BMIz(ti)1BMIz(ti21))(ti2ti21)/(tK112t0),
where the ages at which BMI points were measured weret1, . . .tK and where the endpoints of the time interval were t055 andtK115 10. The formula can also be rewritten to show that it computes a weighted average with BMI points closely spaced in time receiv-ing relatively less weight than widely spaced points. This weight-ing ensures that the average is not unduly influenced by multiple observations clustered close together in time.
Although there is no established BMI cut-point to define child-hood obesity,26subjects were classified as obese if, between 5 and
10 years of age, their average BMI z score was $1.036, which corresponds to the 85th percentile of a normal distribution. We also calculated the average BMI for age intervals before 5 years and the BMI at birth to demonstrate, using a consistent measure across ages, how offspring fatness changed from birth through age 10 years. Weight for height is an alternative surrogate measure of fatness in children, especially at younger ages. However, this measure could not be calculated for a number of subjects at the older ages because the National Center for Health Statistics weight-for-height charts do not use data for males taller than 145 cm or females taller than 137 cm.27Birth–weight ratio was
calcu-lated as another surrogate measure of birth size, because the ratio provides a continuous measure of birth weight adjusted for ges-tational age and sex. The birth–weight ratio was calculated by dividing the offspring birth weight by the median birth weight for gestational age and sex (based on a reference population of non-Hispanic white newborns).28Infants were considered large for
gestational age if they had a birth–weight ratio$1.15, ie, a birth weight$115% of reference weight for gestational age and sex. This cut-point is equal to;4000 g for infants born at 40 weeks’ gestation.
Predictor Measures
Because there were only five insulin-treated mothers, we ex-cluded them from our primary analysis. The main comparison of interest was between the offspring of mothers with GDM (treated Fig 1. Selection of the mothers
with diet alone) and the offspring of control mothers (those with a normal glucose screen value). Among all offspring with avail-able data, we also examined the relationship between offspring obesity in childhood and four metabolic markers of GDM. Three markers (maternal screening plasma glucose, triglyceride, and glucose tolerance) are indirect measures of the maternal metabolic substrate available to the fetus. The fourth marker, serum insulin from the offspring cord blood, is an indirect measure of the fetal hyperinsulinemia induced by the increased transplacental transfer of maternal glucose.29,30The OGTT results were summarized for
each mother as the area under the OGTT curve, with a larger area indicating greater glucose intolerance. The laboratory measure-ment of all specimens and the calculation of the area under the OGTT curve were described previously.16,17
Maternal obesity before pregnancy and paternal obesity at off-spring delivery were the covariates considered. Maternal prepreg-nant BMI was based on self-reported prepregprepreg-nant weight and the measured height, both recorded at the first prenatal visit. Paternal BMI at offspring delivery was estimated from the available height and weight measurements in the father’s GHC medical record. If paternal height was available in the medical record, then BMI points were calculated for the recorded paternal weight measure-ments. The paternal BMI on the day of offspring delivery was estimated by linear interpolation between paternal BMI points before and after the delivery date. Parent obesity was defined as a BMI$27.8 in fathers and$27.3 in mothers.31
Statistical Analysis
Rates of obesity and mean BMIzscores in GDM and control offspring were compared withx2and Wilcoxon rank sum tests,
respectively. Offspring were divided into quartiles by the value for each of the four metabolic markers of interest. We tested the association between quartiles of each metabolic marker and off-spring obesity using logistic regression with likelihood ratio tests. Multivariable logistic regression analyses of obesity rates also were performed, controlling for the effects of parental obesity.
RESULTS
Of the original 977 offspring, 524 (54%) met criteria
for follow-up. Figure 1 shows follow-up rates by
maternal GDM screening group. The majority of
those not followed-up had disenrolled from GHC
before 5 years of age (62%) or had no health care
visits to GHC after 5 years of age despite being
enrolled (16%). Fifty-one percent of the eligible
off-spring were boys, 94% were non-Hispanic whites,
and 93% were born to married mothers. Subjects had
a median of 2 BMI points recorded after 5 years of
age (range, 1 to 17 points), with the most recent BMI
point at a median age of 8.0 years. The age
distribu-tion of BMI points was similar in GDM and control
offspring (data not shown). Table 1 describes the
offspring and their parents. Twenty percent of the
children were obese between 5 and 10 years of age,
which is consistent with current US trends.
32The
obesity rate was higher in the fathers than in the
mothers.
The offspring of diet-treated mothers with GDM
tended to have lower obesity rates and BMI
z
scores
than offspring of control mothers, but neither
differ-ence was statistically significant (Table 2). Even
when we used a higher BMI cut-point to define
obesity (average BMI
z
score
$
1.645 or
approxi-mately the 95th percentile of BMI for age and sex),
there still was no significant difference in obesity
rates between GDM and control offspring (12.1% vs
11.7%;
P
5
.93). Three of the five offspring of
insulin-treated mothers were obese. When these five
off-spring were combined with the offoff-spring of
diet-treated mothers, there still was no increased risk of
obesity (or no higher mean BMI
z
score) in offspring
of mothers with GDM compared with offspring of
controls (22% vs 24%;
P
5
.75). The OGTT criteria for
the diagnosis of GDM, which were established by the
National Diabetes Data Group,
9are more stringent
than those we used. When these stricter criteria were
applied to our cohort, there were 37, rather than 58,
offspring of diet-treated mothers with GDM. The
rate of obesity in this group of 37 offspring of
moth-ers with GDM was 27% and still was not significantly
greater than the rate of 24% among controls (P
5
.70).
There was a significantly higher obesity rate in
children whose mothers or fathers were obese (Table
2). Because parent obesity is a strong risk factor for
childhood obesity,
33and because maternal obesity
also is a risk factor for GDM,
11we evaluated all
associations of childhood obesity and maternal GDM
status while controlling for parent obesity. In these
adjusted analyses, the risk of obesity was no higher
in the offspring of mothers with GDM than in
off-spring of control mothers. Offoff-spring of mothers with
a normal glucose screen (plasma glucose
,
7.77
mmol/L [140 mg/dL]) had a higher rate of obesity
than offspring of mothers with an abnormal screen
(controls). After adjusting for parent obesity,
how-ever, the difference in childhood obesity rates
be-TABLE 1. Characteristics of Study CohortMeasurement N Mean SD
Offspring childhood weight (age 5–10 years)
BMIzscore* 524 0.38 0.98
Obese† (%) 524 20
Offspring characteristics at birth
Birth weight (g) 524 3617 530
Birth length (cm) 519 50.9 2.2
Birth–weight ratio‡ 524 1.06 0.13
Gestational age§ (weeks) 524 39.6 1.6 Parental characteristics
Maternal age (years) 524 31.1 4.6
Maternal prepregnant BMI 517 22.8 3.9 Maternal obesity\(%) 517 11
Paternal age (years) 490 33.6 5.4
Paternal BMI 359 25.5 3.8
Paternal obesity\(%) 359 22 Pregnancy-related characteristics
Pregnancy weight gain¶ (kg) 514 15.7 4.85
Multiparous (%) 524 55
Metabolic markers of GDM
Maternal triglyceride (mmol/L)# 522 1.95 0.67 Maternal glucose (mmol/L)# 524 7.60 1.56 Maternal glucose tolerance**
(mmol/L)
217 22.4 3.4
Cord serum insulin (pmol/L) 352 111 95
* BMI 5body mass index (weight[kg]/height[m]2); see text for
method ofzscore calculation.
† Obese defined as average BMIzscore$1.036 between age 5 and 10 years.
‡ See text for method of calculation.
§ Gestational age calculated from first day of last menstrual pe-riod; eight offspring had gestational age,36 weeks.
\Parental obesity defined as BMI$27.3 for mothers and$27.8 for fathers.
¶ Based on the difference between self-reported prepregnant weight and the recorded weight at last prenatal visit.
# Plasma level 1 hour after 50-g, oral glucose load at 24 –32 weeks’ gestation.
tween these two groups was not statistically
signifi-cant.
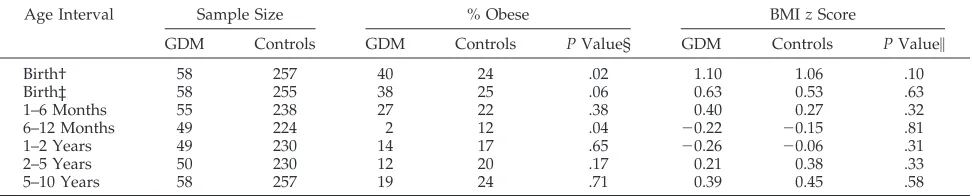
We also compared the offspring obesity rates and
BMI
z
scores before 5 years of age (Table 3).
Off-spring of mothers with GDM were larger at birth
with a greater proportion classified as large for
ges-tational age by birth–weight ratio (P
5
.02) or birth
BMI (P
5
.06). Between 6 and 12 months of age,
however, these differences not only disappeared, but
there was a suggestion that offspring of mothers with
GDM were leaner.
Women in the higher quartiles of screening
glu-cose level had offspring with lower obesity rates
(Table 4). However, after adjustment for parent
obe-sity, the differences in childhood obesity rates were
no longer statistically significant. There were no
sig-nificant differences in the rate of childhood obesity
across quartiles of maternal glucose tolerance,
mater-nal triglyceride, or cord serum insulin. When these
four metabolic measures were each examined as
con-tinuous variables and correlated to offspring BMI
z
scores, there were no significant correlations. The
five offspring with insulin-treated mothers were
ex-cluded from the analyses in Table 4, but the overall
results were unchanged when these five cases were
included.
Our sample size was adequate to detect a clinically
relevant association between maternal GDM and
off-spring obesity in childhood. Given the prevalence of
obesity in the control group (24%) and the number of
offspring available for follow-up (n
5
58 for GDM;
n
5
257 for controls), our study had 85% power (
a
5
0.05) to detect a relative risk of 1.8 for obesity in the
offspring of mothers with GDM.
We explored the possibility that differential
fol-low-up in the GDM and control groups masked an
association between GDM and offspring obesity
(Ta-ble 5). In the GDM group, those offspring
fol-lowed-up tended to have mothers with lower
prepregnancy BMI and obesity rates. In contrast, for
the control group, those offspring followed-up
tended to have mothers with higher prepregnancy
BMI and obesity rates. These differences could have
biased our results toward the finding of no difference
in obesity rates between offspring of control mothers
and offspring of mothers with GDM, but when we
controlled our analyses in Table 2 for maternal
obe-sity, our conclusions were unchanged.
DISCUSSION
We observed no increased risk of childhood
obe-sity in offspring of mothers with mild, diet-treated
GDM and found no association between the
meta-bolic markers of GDM and childhood obesity. Our
conclusions apply to the population we studied,
namely, the offspring of medically insured,
non-His-panic white mothers with diet-treated GDM. The
GDM prevalence in the HMO population from
TABLE 2. Comparison of Offspring BMIzScores and Obesity Rates at Age 5 to 10 Years by Maternal GDM Screening Group and Parent Obesity StatusMean BMIz
(SD)
No. Obese/No. Studied
% Obese Group Comparison
PValue* (AdjustedPValue)
GDM screening group
Controls 0.45 (0.93) 62/257 24
GDM (diet-treated) 0.39 (0.94) 11/58 19 vs controls .40 (.53)†
Abnormal screen, normal OGTT 0.24 (0.93) 22/159 14
Abnormal screen, no OGTT 0.34 (1.22) 7/45 16
All abnormal screens‡ 0.28 (0.98) 40/262 15 vs controls .01 (.26)†
Parental obesity‡
Mother nonobese 0.31 (0.95) 80/461 17
Mother obese 0.91 (0.99) 21/51 41 vs nonobese ,.001 (.006)§
Father nonobese 0.28 (0.91) 41/279 15
Father obese 0.71 (1.02) 25/78 32 vs nonobese ,.001 (.002)§
*Pvalues are for comparison of obesity rates between groups and are based onx2test.
† AdjustedPvalue controls for the effects of maternal and paternal obesity using logistic regression. ‡ Analysis excludes five insulin-treated mothers with GDM.
§ AdjustedPvalue controls for obesity of the other parent using logistic regression analysis and vice-versa.
TABLE 3. Comparison of GDM and Control Offspring BMIzScores and Obesity Rates by Age*
Age Interval Sample Size % Obese BMIzScore
GDM Controls GDM Controls PValue§ GDM Controls PValue\
Birth† 58 257 40 24 .02 1.10 1.06 .10
Birth‡ 58 255 38 25 .06 0.63 0.53 .63
1–6 Months 55 238 27 22 .38 0.40 0.27 .32
6–12 Months 49 224 2 12 .04 20.22 20.15 .81
1–2 Years 49 230 14 17 .65 20.26 20.06 .31
2–5 Years 50 230 12 20 .17 0.21 0.38 .33
5–10 Years 58 257 19 24 .71 0.39 0.45 .58
* Analysis excludes five offspring of insulin-treated GDM mothers.
† Fatness at birth assessed by birth–weight ratio with large for gestational age (or obese) defined as birth–weight ratio$1.15.
‡ Fatness at birth assessed by birth BMI with large for gestational age (or obese) defined as BMIzscore$1.036. At all other ages, fatness is assessed by average BMIzscore over the age interval with obesity defined as BMIzscore$1.036.
§Pvalue forx2tests.
which the study cohort was derived
16was very
sim-ilar to prevalence estimates in other populations of
non-Hispanic whites. However, the cohort may have
had less severe glucose intolerance at presentation or
after diagnosis than in populations with poorer
ac-cess to health care or higher rates of either GDM or
maternal obesity.
10,34It is possible that intrauterine
exposure to more severe maternal diabetes may
in-crease the risk of childhood obesity. Although
mean-ingful statistical comparisons cannot be made with
our subgroup of five insulin-treated mothers, these
five women represented a minority of the GDM cases
identified in the population-based sample of 2019
women who were screened.
All previous studies of childhood obesity in the
offspring of mothers with GDM also have included
mothers with known IDDM
12,14,15,35or NIDDM.
13A
Swedish study, the only to report results separately
for offspring of mothers with GDM, showed no
as-sociation between GDM and childhood obesity.
35The
other studies, grouping all mothers with diabetes,
reported an overall association between maternal
di-abetes during pregnancy and offspring obesity. In
one report from the Northwestern Diabetes in
Pregnancy Study, BMI in the offspring of mothers
with diabetes was compared with that in a control
group.
15Mean BMI values at an average age of 12
years were higher in the 88 offspring of mothers with
diabetes than in the 80 control offspring (22.8 vs
20.3). This finding is difficult to interpret, because the
offspring of mothers with GDM were not examined
separately; the control group was not matched on
markers of social status; and the BMI values were not
adjusted for age, sex, stage of sexual maturity, or
maternal BMI. Adjusting for maternal obesity is
nec-essary to determine whether the offspring obesity
risk is from the effects of an altered intrauterine
environment or from obesity genes inherited from
the mother. Effects from the intrauterine
environ-ment are potentially modifiable by interventions to
improve glucose control during pregnancy.
Pettitt and colleagues, studying the Pima Indians
in Arizona, compared obesity rates in a large cohort
of offspring from diabetic and nondiabetic
pregnan-cies.
13The risk of obesity (
.
140% of median weight
for height) was two to three times higher in
child-hood and adolescence among the offspring of
moth-ers with diabetes. This increased risk was present
independent of both maternal obesity and birth
weight.
36However, the high underlying genetic
pre-TABLE 4. Comparison of Offspring BMIzScore and Obesity Rates by Quartile of Metabolic Measures From Pregnancy and by Parental Obesity*Mean BMI Scorez No. Obese/No. Studied % Obese PValue† (Adjusted
PValue)‡
Maternal glucose
1st Quartile 0.42 27/129 21 .05 (.54)
2nd Quartile 0.48 35/128 27
3rd Quartile 0.32 19/127 15
4th Quartile 0.26 21/135 16
Maternal OGTT
1st Quartile 0.09 4/53 8 .22 (.30)
2nd Quartile 0.38 11/54 20
3rd Quartile 0.26 7/53 13
4th Quartile 0.34 10/54 19
Cord serum insulin
1st Quartile 0.41 17/86 20 .65 (.49)
2nd Quartile 0.33 12/78 15
3rd Quartile 0.25 16/89 18
4th Quartile 0.31 16/98 16
Maternal triglyceride
1st Quartile 0.34 20/129 16 .12 (.16)
2nd Quartile 0.33 20/128 16
3rd Quartile 0.34 29/128 23
4th Quartile 0.48 33/132 25
* Analysis excludes offspring of five insulin-treated mothers with GDM.
†Pvalues are from likelihood ratio tests for importance of the entire set of quartile indicator variables.
‡ AdjustedPvalues for associations with metabolic measures are calculated using logistic regression models controlling for maternal and paternal obesity.
TABLE 5. Comparison of GDM and Control Groups by Follow-up Status
GDM Followed Up
n558
GDM Not Followed Up
n537
P
Value
Controls Followed Up
n5257
Controls Not Followed Up
n5262
P
Value
Maternal BMI 23.2 24.8 .07 22.6 22.4 .08
Mother obese* (%) 7/57 (12.3) 8/36 (22.2) .18 22/255 (8.6) 19/260 (7.3) .58
Birth–weight ratio 1.10 1.09 .76 1.06 1.05 .22
Maternal triglyceride (mmol/L) 2.32 2.23 .70 1.89 1.84 .22
Maternal glucose (mmol/L) 9.48 9.57 .83 6.33 6.22 .07
Cord serum insulin (pmol/L) 167.4 122.2 .11 105.1 109.0 .33
disposition to obesity and diabetes in the Pima
37makes the findings from this population difficult to
generalize, and these reports do not indicate what
proportion of mothers with diabetes had known
NIDDM before pregnancy.
38Our study focused on obesity in children between
5 and 10 years of age. Data from the previous studies
suggest that it is not until after
;
5 years of age that
the weights of offspring of diabetic mothers begin to
differ from the growth reference
14,39or from
con-trols.
12Thus, differences between offspring of
moth-ers with GDM and offspring of control mothmoth-ers may
have been diminished in our study by averaging BMI
over the ages of 5 to 10 years. However, when only
those subjects with measurements between 8 and 10
years of age were compared (33 GDM vs 133 control
offspring), there still was no significant difference in
obesity rates (18% vs 19%;
P
5
.93) or in mean BMI
z
score (0.38 versus 0.30;
P
5
.80) at 8 to 10 years of age.
Our study provided an ideal control group. The
screening criteria used on the mothers to establish
GDM or control status were identical, and all
moth-ers were enrolled at the same time. Furthermore,
because the control mothers and mothers with GDM
were all insured by the same HMO, this minimized
differences in socioeconomic status and access to
medical care that may be related to both glucose
control in pregnancy and offspring obesity risk. Race
and ethnicity, which also are important factors in
both GDM risk
10and childhood obesity risk
40were
not confounding variables in this study. We had
incomplete follow-up of this cohort, but we were
able to adjust our analyses for baseline differences in
maternal obesity, and this adjustment did not affect
our conclusions.
Our findings indicate that mothers with mild,
diet-treated GDM do not have metabolic alterations that
affect the intrauterine environment sufficiently to
increase the risk of childhood obesity in their
off-spring. It is possible that any effects of GDM on the
intrauterine environment that increase childhood
obesity risk are obscured by the greater impacts of
diet and physical activity patterns during childhood.
Our results, together with those of previous studies,
suggest that the risk of childhood obesity in offspring
from diabetic pregnancies may depend on the form
and severity of maternal diabetes. Future studies
must examine separately mothers with IDDM,
NIDDM, and GDM. To delineate further the possible
relationship between diabetes during pregnancy and
offspring obesity, these studies must examine
pro-spectively fat and carbohydrate metabolism and
body fat distribution both in pregnant mothers and
in their offspring.
ACKNOWLEDGMENTS
This work was supported by the Generalist Physician Faculty Scholars Award from the Robert Wood Johnson Foundation, Princeton, NJ (R.W.), and by Grant DK35816 to the University of Washington Clinical Nutrition Research Unit from the National Institutes of Health (R.K.).
We thank Edward H. Wagner, MD, MPH, for facilitating this research at the Center for Health Studies at Group Health Coop-erative of Puget Sound, Seattle, WA; Richard L. Furman for careful abstraction of Group Health Cooperative medical records; and
Vicki Livengood for her assistance with the preparation of this manuscript.
REFERENCES
1. White P, Koshy P, Duckers J. The management of pregnancy compli-cating diabetes and of children of diabetic mothers.Med Clin North Am. 1953;37:1481–1496
2. Farquhar JW. Prognosis for babies born to diabetic mothers in Edin-burgh.Arch Dis Child.1969;44:36 – 47
3. Cummins M, Norrish M. Follow-up of diabetic mothers.Arch Dis Child. 1980;55:259 –264
4. Breidahl HD. The growth and development of children born to mothers with diabetes.Med J Aust.1966;1:268 –270
5. Hagbard L, Olow I, Reinand T. A follow-up study of 514 children of diabetic mothers.Acta Paediatr.1959;48:184 –197
6. Freinkel N. Banting Lecture 1980. Of pregnancy and progeny.Diabetes. 1980;29:1023–1035
7. Lucas A. Programming by early nutrition in man. In: Bock GR, Whelan J, eds.The Childhood Environment and Adult Disease. Chichester, NY: Wiley; 1991:38 –55
8. Whitaker RC, Dietz WH. The role of the prenatal environment in the development of obesity.J Pediatr. In press
9. National Diabetes Data Group. Classification and diagnosis of diabetes mellitus and other categories of glucose intolerance.Diabetes.1979;28: 1039 –1057
10. Dooley SL, Metzger BE, Cho N, Liu K. The influence of demographic and phenotypic heterogeneity on the prevalence of gestational diabetes mellitus.Int J Gynaecol Obstet.1991;35:13–18
11. Jacobson JD, Cousins L. A population-based study of maternal and perinatal outcome in patients with gestational diabetes.Am J Obstet
Gynecol.1989;161:981–986
12. Vohr BR, Lipsitt LP, Oh W. Somatic growth of children of diabetic mothers with reference to birth size.J Pediatr.1980;97:196 –199 13. Pettitt DJ, Baird HR, Aleck KA, Bennett PH, Knowler WC. Excessive
obesity in offspring of Pima Indian women with diabetes during preg-nancy.N Engl J Med.1983;308:242–245
14. Silverman BL, Rizzo T, Green OC, et al. Long-term prospective evalu-ation of offspring of diabetic mothers.Diabetes.1991;40(suppl 2):121–125 15. Silverman BL, Metzger BE, Cho NH, Loeb CA. Impaired glucose toler-ance in adolescent offspring of diabetic mothers: relationship to fetal hyperinsulinism.Diabetes Care.1995;18:611– 617
16. Magee MS, Walden CE, Benedetti TJ, Knopp RH. Influence of diagnostic criteria on the incidence of gestational diabetes and perinatal morbidity.
JAMA.1993;269:609 – 615
17. Knopp RH, Magee MS, Walden CE, Bonet B, Benedetti TJ. Prediction of infant birth weight by GDM screening tests: importance of plasma triglyceride.Diabetes Care.1992;15:1605–1613
18. Carpenter MW, Coustan DR. Criteria for screening tests for gestational diabetes.Am J Obstet Gynecol.1982;144:768 –773
19. Kraemer HC, Berkowitz RI, Hammer LD. Methodological difficulties in studies of obesity. I. Measurement issues. Ann Behav Med.1990;12: 112–118
20. Rolland-Cachera MF, Sempe M, Guilloud-Bataille M, Patois E, Pequignot-Guggenbuhl F, Fautrad V. Adiposity indices in children.
Am J Clin Nutr.1982;36:178 –184
21. Roche AF, Siervogel RM, Chumlea WC, Webb P. Grading body fatness from limited anthropometric data.Am J Clin Nutr.1981;34:2831–2838 22. Gutin B, Basch C, Shea S, et al. Blood pressure, fitness and fatness in
5-and 6-year-old children.JAMA.1990;264:1123–1127
23. Laskarzewski P, Morrison JA, Mellies MJ, et al. Relationships of mea-surements of body mass to plasma lipoproteins in schoolchildren and adults.Am J Epidemiol.1980;111:395– 406
24. Ronnemaa T, Knip M, Lautala P, et al. Serum insulin and other cardio-vascular risk indicators in children, adolescents and young adults.Ann Med.1991;23:67–72
25. Frisancho AR.Anthropometric Standards for the Assessment of Growth and
Nutritional Status.Ann Arbor, MI: University of Michigan Press; 1990
26. Robinson TN. Defining obesity in children and adolescents: clinical approaches.Crit Rev Food Sci Nutri.1993;33:313–320
27. Hamill PV, Drizd TA, Johnson CL, Reed RB, Roche AF, Moore WM. Physical growth: National Center for Health Statistics percentiles.Am J
Clin Nutr.1979;32:607– 629
28. Williams RL, Creasy RK, Cunningham GC, Hawes WE, Norris FD, Tashiro M. Fetal growth and perinatal viability in California.Obstet
Gynecol.1982;59:624 – 632
C-peptide levels with macrosomia and hypoglycemia. N Engl J Med. 1979;301:859 – 862
30. Metzger BE. Biphasic effects of maternal metabolism on fetal growth: quintessential expression of fuel-mediated teratogenesis.Diabetes.1991; 40(suppl 2):99 –105
31. National Institutes of Health Consensus Development Panel on the Health Implications of Obesity. Health implications of obesity: National Institutes of Health Consensus Development Conference Statement.
Ann Intern Med.1985;103:147–151
32. Troiano RP, Flegal KM, Kuczmarski RJ, Campbell SM, Johnson CL. Overweight prevalence and trends for children and adolescents: Na-tional Health and Nutrition Examination Surveys, 1963 to 1991.Arch
Pediatr Adolesc Med.1995;149:1085–1091
33. Garn SM, Clark DC. Trends in fatness and the origins of obesity.
Pediatrics.1976;57:443– 456
34. Dooley SL, Metzger BE, Cho NH. Gestational diabetes mellitus: influ-ence of race on disease prevalinflu-ence and perinatal outcome in a U.S. population.Diabetes.1991;40(suppl 2):25–29
35. Persson B, Gentz J, Moller E. Follow-up of children of insulin dependent
(type I) and gestational diabetic mothers.Acta Paediatr Scand.1984;73: 778 –784
36. Pettitt DJ, Knowler WC, Bennett PH, Aleck KA, Baird HR. Obesity in offspring of diabetic Pima Indian women despite normal birth weight.
Diabetes Care.1987;10:76 – 80
37. Knowler WC, Pettitt DJ, Saad MF, et al. Obesity in the Pima Indians: its magnitude and relationship with diabetes.Am J Clin Nutr.1991;53: 1543s–1551s
38. Pettitt DJ, Nelson RG, Saad MF, Bennett PH, Knowler WC. Diabetes and obesity in the offspring of Pima Indian women with diabetes during pregnancy.Diabetes Care.1993;16(suppl 1):310 –314
39. Silverman BL, Landsberg L, Metzger BE. Fetal hyperinsulinism in off-spring of diabetic mothers: association with the subsequent develop-ment of childhood obesity.Ann NY Acad Sci.1993;699:36 – 45 40. Campaigne BN, Morrison JA, Schumann BC, et al. Indexes of obesity