THE Unit was established in 1962 at Lincoln College with an annual grant from the Department of Scientific and Industrial Research. This general grant has been supplemented by grants from the Wool Research Organisation and other bodies for specific research projects.
The Unit has on hand a long-term programme of research in the fields of agricultural marketing and agricultural production, resource economics, and the relationship between agriculture and the general economy. The results of these research studies will in the future be published as Research Reports as projects are com
-pleted. In addition, technical papers, discussion papers, and re-prints of papers published or delivered elsewhere will be available on request. For a list of previous publications see inside back cover.
RESEARCH STAFF 1971 Director
J. D. Stewart, M.A(N.z.), Ph.D.(Rd'g.), Dip. V.F.M. Deputy Director
R. W. M. Johnson, M.Agr.Sc., B.Litt.(Oxon.), Ph.D.(Lond.) Research Economists
G. W. Kitson, B.Hort.Sc. T. R. O'Malley, B.Agr.Sc.
G. W. Lill, B.Agr.Sc.
UNIVERSITY LECfURING STAFF
W. O. McCarthy, MAgr.Sc., Ph.D.(Iowa) B. J. Ross, M.Agr.Sc.
A T. G. McArthur, B.Sc.(Agr.)(Lond.), M.Agr.Sc. R. G. Pilling, B.Comm.(N.z.), Dip.Tchg., AC.I.S.
L. D. Woods, BAgr.Sc.
FRESH
FRUIT
AND
VEGETABLES
by
G. W. Kitson
In this report, retail distribution costs for fresh
fruit and vegetables in Christchurch are examined from
both welfare and efficiency viewpoints. Retail prices
and margins on these products will interest both the
consumer and the grower while the efficiency analyses
will be of major concern to all the retailers involved.
The report is an abbreviated version of Mr Kitson's
Master of Horticultural Science thesis submitted to the
University of Canterbury in December 1970. The research
project, from which these results were derived, was
generously supported by the New Zealand Vegetable and
Produce Growers Federation and the New Zealand
1 •
2.
3.
4.
5.
CON TEN T S
INTRODUCTION
1 .1 O~tline
of Research Programme
RESULTS· OF SURVEYS OF RETAIL PRICES AND MARGINS
2.1 2.2
2.3
2.4
2.5
2.6
Introduction
Special Features of Analysis
Average Price Levels Between Retailers
Retail Margins
Procurement Cost Analysis
Quality Ratings
COST AND EFFICIENCY STUDIES
Total Store Operations
Cost Analysis
3.3
Fruit and Vegetable Operations Only
COMPARATIVE DISTRIBUTION COSTS FROM GROWER '1'0
RETAILER DIRECT AND THROUGH NORMAL WHOLESALE CHANNELS
4.1
Price Arrival in Direct Trading
SUMMARY
Major Results in Brief
DISTRIBUTION COSTS AND EFFICIENCY FOR FRESH
FRUIT AND VEGETABLES
1. INTRODUCTION
This study concerns the economics of a particular section of
the food distribution industry in New Zealand, namely that part
responsible for distributing fresh fruit and vegetables. Distribution
costs are measured as the difference between auction prices and retail
prices for produce except where direct buying from growers is practised.
Components of distribution costs include transport, handling, storage,
selling and wastage. Efficiency of distribution is measured in terms
of cost per unit of produce sold, sales per labour unit and sales per
unit of floor space. Distribution costs and efficiency ratios are
investigated and compared for supermarkets, superfruiterers, fruiterers
and grocers in the Christchurch areas.
The importance of the economics of distribution has already
been recognised in the United States where large sums of money have
been committed to research by the National Commission on Food Marketing.
Fast growth rates for the distribution sector have been noted both in
the United States and New Zealand. In New Zealand gross output of
the Trade, or Distribution sector has grown, in current value terms,
at a rate of about 11 per cent per year between 1960 and 1965.
It has also been noted that in the United States labour
product-ivity growth rates for distribution industries are among the lowest of
all sectors. Thus a disturbing situation has arisen that a low
2
States. For this reason efficiency studies in distribution are
bound to assume greater significance.
Interest in fruit and vegetable distribution in New Zealand
arises out of the unique role of the auction system in handling
the bulk of fruit and vegetable output. Under th~s system, supplies
of imported fruit are allocated to retail firms in proportion to the
value of other produce they buy through auction firms, thus ensuring
the dominant place of the auctions in the distribution system.
This system of distribution is defended by auction firms
and decried by a number of retail firms, especially supermarkets
who find that it induces a conflict between their desire to have
supplies of overseas fruit and their desire to achieve economies
of mass distribution by trading direct with growers. This study
is thus an attempt to provide a rational base on which decisions
about the future of fruit and vegetable distribution in New Zealand
can be made. In particular, the objective is to indicate which
sorts of retail outlets will provide the lowest cost distribution
channels. Special attention is given to supermarkets because
changes in the distribution system are likely to work in this
direction.
1. Outline of Research
The studies in distribution costs and efficiency were
based on a number of surveys of Christchurch fruit and vegetable
( 1 ) Supermarkets. This group consisted of stores selling
groceries~ meat and fruit and vegetables which had four
checkouts or more. It also included variety stores and department
stores which had~ as one department~ a supermarketo
Fruiterers. This group was classified according to the
same criteria as used by the New Zealand Statistics
Department. The requirement for this classification is simply
that the retailer himself decides whether or not he belongs to
this group.
Super fruiterers. This' group was separated arbitrarily
largely according to their size of operation and trading
characteristics. Their average fruit and vegetable sales are
about three tim~s that of conventional fruiterers and a high
proportion of their sales are in case lots. Because the group
is small their results need careful interpretation and the
implications for policy are limited.
(4)
Grocer/dairies. This group consisted of remaining foodretailers who sold fruit and vegetable items. They are
the major fruit and vegetable outlet in Christchurch with their
1967
wholesale purchases amounting to47
per cent of Chirstchurchistotal wholesale purchases.
The study included two surveys of retail prices, retail
margins and procurement costs. These surveys, each conducted
over a number of consecutive days, were at two different times
4
during August was to establish whether price and margin patterns
between retail types were similar between seasons.
While these prices and margins studies were being conducted
a sub sample were asked to record wastage losses of produce. This
cost was regarded by many retailers as very significant. Because
no factual data on loss rates was available, measures of this cost
required a survey.
Surveys were also conducted in order to ascertain levels of
costs and efficiency for retail distribution as a whole. These
were designed to provide information not only on fruit and vegetable
distribution costs but also on total store distribution costs where
products other than fruit and vegetables were also sold. The main
reason for noting overall costs was that a number of these had to be
allocated to individual product groups. In order to adopt a rational
approach to the problem of cost allocation and to provide an insight
to the detailed day to day f~nctioning of a .typical supermarket two~
one week detailed studies were made of the functioning of a Chr.istchurch
supermarket.
Finally, a comparative study was made of distribution.cos:t;s where
the retailer's wholesale source was the auction firm on the one hand
and the grower himself on the other. This was in order not only to
establish relative levels of these costs but also to establish how
growers fared under each type of distribution.
Thus the project provides factual data on relative retail
distribution costs internal to retail firms and distribution costs
auction firms and growers. The following sections will present the
6
2. RESULTS OF SURVEYS OF RETAIL PRICES AND MARGINS
2.1 Introduction
The objective of these surveys was to measure the levels of
retail prices for each type of retail outlet and since retail margins
can be regarded as the cost of performing the retail distribution
function, by relating retail prices to procurement costs further data on
distribution costs can be determined) i.e~ margins can be calculated.
The dimensions of the surveys of retail prices and margins
carried out in February and August 1969 are described by the table
below.
No. retailers of all groups
No. days recording
N" o. items recorded
February
82
14
15
August
42
3
12
Samples of outlets ~ere selected statistically using data on
overall percentage margins collected during the 1967 study as a base.
The following table shows the numbers of retailers of different
types in each survey.
Supermarkets
Fruiterers
Grocer/dairies
Super fruiterers
February
14
29
35
4
August
7
16
17
2
both the February and the August survey periods.
for the following nine items:
Carrots
Celery
Cabbage
Tomatoes
Grapefruit
Lettuce
Onions
Potatoes
Apples
This was possible
Apricots, peaches, plums and nectarines of the F8bru~ry
survey were replaced by kiwifruit, tamarillos, mandarins and lemons
in August. In addition during February a number of substitutions
were made within the survey period. In this way information was
recorded on 15 items. Two further items, case apricots and case
peaches were also included for short periods, the results being
analysed by hand rather than by computer like all other items.
2.2 Special Features of Analysis
Two features of this analysis warrant special mention.
These are:
(1) That allowance was made for differences in quality of
different items. A numerical scale awarding points for
ripeness, colour, defects and evenness of size was developed, and
points for quality were awarded to each item every time its price
was recorded. Items whose quality was high had their retail prices
lowered and items whose quality was low had this price increased.
8
there is no suggestion that this is a full allowance.
(2) Margins were calculated by matching the retail price recorded,
with the wholesale price for exactly the same items. This
procedure was more difficult for larger retailers although these
retailers, by indicating when produce had been bought made it possible
to still match retail prices with actual invoice prices.
2.3 Average Price Levels Between Retailers
Retail prices adjusted for quality are presented in detail in
A.E.R.U. Technical Paper Noo 12.
For easy comparison between retail groups results have been
aggregated in Table 1 into a shopping basket cost. This required
weighting items for each period by their relative importance in the
shopping basket. For February this was done using as a basis the
supermarket case study, which calculated sales of all items in
physical terms. Dividing these sales by the total fruit and
vegetable customer count during this period gave a figure which
indicated the average physical sales per customer 9 for each item.
Multiplying this figure by the quality weighted average retail
prices charged by each retail outlet9 gave figures in cents of
the average expenditure on each item per fruit and vegetable
customer. The aggregated expenditure figures for each retail
group are shown for each survey period in Table 1.
With one exception the results show the same pattern for
DeEartment Customer and Relative Cost of Market Basket Ao Februar;r
Sales per Customer Grocer/
in Normal Sales Dairies Fruiterers Supermarkets Super fruiterers
Item Units Units Cents Cents Cents Cents
Carrots 0029 lb 3.37 3~36 2.87 3.71
Celery 0.05 stk ' 1 .18 1.27 1.35 1.35
Cabbage 0.08 ea 1.05 1.07 0.95 0.97
Tomatoes 0.26 lb 5.95 5.72 5016 5.27
Lettuce 0.06 ea 0.8 0.79 0.70 0.70
Onions 0.38 lb 3.82 3.73 3.37 2085
Apricots 0008 lb 1.95 2.12 1.89 1.99
Peaches 0.04 lb 0.81 0.85 0.76 0 079
Nectarines 0001 lb 0.23 0.24 0.21 0.23
Plums 0.02 lb 0.41 0.50 0.43 0.47
Strawberries 0.02 pun 0.81 0.79 0.73 0.74
Grapefruit 0.05 lb 1.03 1.05 0.99 0096
Potatoes 1.46 lb 6.36 7.36 5.93 6.42 \..0
Apples 0.05 lb 0.95 0.96 0094 0086
Total Basket 28.00 29.81 26.28 27.31
B. August
Carrots 0.30 lb 1 .91 1.98 1.80 1.20
Celery 0002 stk 0.41 0.50 0.48 0.59
Cabbage 0.17 ea 2.99 3.24 2.75 2062
Tomatoes 0.02 lb 1.29 1.35 1 .18 1.21
Lettuce 0.03 ea 1.07 1.07 0.89 0.99
Onions 0.26 lb 1.56 1.48 1.30 0081
Potatoes 2.12 lb 9.22 8.65 8.45 5.57
Kiwifruit 0.03 lb 0.82 1.00 0.84 0065
Tamarillos 0.03 lb 0.81 0.83 0.75 0.73
Mandarins 0.01 lb 0.29 0.37 0.34 0.31
Lemons 0.02 lb 0.51 0.49 0.44 0.33
Grapefruit 0.03 lb 0.68 0.76 0.72 0045
Apples 0.45 lb 6.67 6.96 6.86 6.30
10
supermarkets show the lowest level of retail prices (adjusted for
quality), the grocer/dairy group is next, and the fruiterer group
highest, in each survey period. This result is also consistent
among individual fruit and vegetable items. Once again ignoring
the super fruiterer group, supermarkets had the lowest prices for
twelve of the fifteen items.
The distinction between the grocer/d-airy group and the
fruiterer group is less clear cut. If anything the quality
adjustment scale erred on the side of taking insufficient
recog-nit ion of quality. Complete adjustment for quality, if it were
possible, may have evened the basket costs in the two periods for
these groups. The costs for these two groups do not differ
greatly in the August period, although they are 1.81 cents higher
for fruiterers in the F~bruary peiiod.
The inconsistency in the super fruiterer group results between
purvey periods is
a
result of a sampling error.In the February survey a 100 per cent sample was taken of
this group. Because of limitations in sampling size (there are
only four retailers in the group) 9 the same sized sample should
have been taken in August. However because of the geographical
distribution of the group it was decided that the additional cost
of surveying all four rather than two of these outlets in August
was too great.
When only two of this group were surveyed in August, the
market basket cost was very markedly cheaper than that of
cheapest for
9
out of 13 items.In summary, supermarkets charged lowest prices in generalo
The grocer/dairy group and the fruiterer group both charged higher
prices. Fruiterers' prices9 after some adjustment has been made
for quality~ were slightly higher than those of grocer/dairies.
Some elements of the super fruiterer group charge notably lower
prices than all other groups (this was probably so even for February).
2.4 Retail Margin Analysis
Retail margins calculated are shown in detail in A.E.R.U.
Technical Paper No. 12. These tables show margins between the non
quality adjusted retail price and wholesale price.
In addition to auction margins, these tables show landed
margins (the margi,n between retail price and the price at the shop
door when the retailer did not d9 his own buying). Only the grocer/
dairy group and some ·fruiterers bought fruit and vegetables in this
way.
The margins have also been presented in the form of percentages
markups in Table 2.
This table shows that in both survey periods the super fruiterer
group had more of the survey items whose average auction margin was
lowest. The supermarket group had most items in second lowest
position while the fruiterer group most often had the highest or
•
second highest auction margin. The grocer/dairy group's rankingscof
highest position.
Items with lower wholesale prices (for normal sales units)
showed higher average markups. The overall average auction prices
for carrots, cabbage, lettuce, onions and potatoes were all less
than 10 cents per normal retail sales unit in February. These
items all show markups of greater than 100 per cent. However
differences do exist among them between different types of retail
outlet. For potatotes, in the case of supermarkets and super
fruiterers, the average markup was
41.3
per cent and53.8
per centrespectively, while for onions these markups were
57.5
per cent and150.8 per cent. For onions then, the super fruiterer group markup
was in the same range as the grocer/dairy and fruiterer group.
A similar pattern was exhibited during August. At this time
of the year only carrot, potato and onion wholesale prices were low
for normal retail sales units. Only these items had average markups
of greater than 100 per cent. Exceptions among retail outlets were
apparent for super fruiterers for potatoes, and supermarkets for
carrots.
Table 1 also shows that carrots, onions and potatoes were among
the major volume sellers at both times of the year. It would appear
from this evidence that supermarkets especially, and super fruiterers,
recognised their volume sellers and tailored their merchandising
policies to suit this, for despite the fact that wholesale prices
were low, the percentage markups were very significantly lower than
14
The pattern among other fruits and vegetable~ is less evident
but it could be said in general that these margins for grocer/dairies
and fruiterers appear to be at a slightly higher level than those of
supermarkets and super fruiterers.
A look at margins in absolute terms enables further comment
about the relative levels between items, since they should in a way,
be construed as reflecting relative costs of marketing. The auction
margins relate to the cost of buying, transporting to store, selling,
and recording a profit for any particular item.
In February, the most striking result is the level of stone
fruit margins. The average cost as defined above for apricots,
peaches, plums and nectarines was in the range of 10c/lb where these
fruits were sold loose. This makes an interesting comparison with
margins per case recorded for case lot sales of peaches and apricots
over the same period. These margins, in cents per half case, are
shown in the following table.
Case Fruit Margins (cents/half case)
Item
Peaches
Apricots
Fruiterers
45.44
40.00
Supermarkets
43.25
48.42
Super fruiterers
26.25
30.83
Two points arise from this table. The first is a comparison
between case lot margins and per pound margins. Given an overall margin
figure of about 40 cents per half case the margin per pound would be
only slightly greater than 2 cents~ a very significant reduction in
is a reflection partly of the effect of volume selling~ and the
reduction in risk of wastage which has been partly passed on to
the buyer.
The other point is that the margins for the super fruiterer
group are very much lower than for the other two outlets. Once
again this is partly a reflection of the volume of this business
done by this group.
also in case lots.
A very large proportion of their business is
The average level of margins for kiwifruit, tamarillos and
mandarins, like the stone fruit, i p around the 10c/lb mark, but
presumably without the same deterioration risk.
For items present in both surveys the margins for celery,
cabbage, onions, grapefruit and potatoes were about the same in
either period. The margins for tomatoes and lettuce were very
mugh higher in August. The margin for carrots was significantly
lower in August, while the margin for apples was slightly down.
The following table summarises average overall margins
between retail price and auction price in cents per normal retail
unit for each survey period. (Table on p.16).
2.5 Procurement Cost Analysis
The auction prices paid and/or the prices paid for survey
items at the shop door were observed in the retail price surveys.
From these auction prices, Table
3
has been produced showing the16
Overall Auction Margins (cents/unit)
Item February August
Carrots/lb
6.08
3.74
Celery
9.71
8.36
Cabbage
7.13
7.04
Tomatoes
8.59
18.21
Lettuce
6.75
9.46
Onions
4.62
3.47
Apricots
10.63
Peaches
9.17
Plums
9.21
Strawberries
11.17
Grapefruit
7.77
7.80
Carrots/bunch
6.13
Potatoes
2.33
2.36
Nectarines
10.25
Kiwifruit
9.75
Tamarillos
9.59
Mandarins
11.11
Lemons
10.79
the proportions indicated, by each retail outlet.
The relative proportions of items are by weight~ This
table shows proportions only among the survey items listed9 not
for all fruit and vegetable items sold. The most notable feature
of these proportions, is the dominance of potatoes as the major
product item in both survey periods.
The purpose of the analysis of procurement costs w~s to
investigate whether any particular retail group paid lower prices
at auction for their produce. In particular~ do larger buyers
buy at any advantage through the auction system? Both February and
August results suggest that this is so. The weighted expenditure ..
of the super fruiterer retailers was
12.5
per cent less than the next highest group in February(439
versus502)
and5.6
per centless during August
(435
versus467).
Before further comment on this advantage which the super
fruiter group have through their large volume of purchases (they
are larger buyers than supermarkets, with average weekly retail
1
sales in
1967
being$820
versus$515
for supermarkets), it wouldbe wise to see with which items their advantages lie. A glance
at potatoes shows that in February
38
units of their total63
units advantage over supermarkets lies with this item, and26
of their32
unit advantage over supermarkets in August lies with this item.1. This result came from the
1967
study, Fresh Vegetable Retailingin New Zealand - An Economic Survey. A.E.R.U. Rsearch Report
Tabl!L2
Relative. Extenditures at Auction b:z: Different Retail
Outlets .' Weighted b:z: Proportion of Purchases)
A.
Februar:r.
Perqentage of
Total purchases
Grocer/
Item
Unit
of Lis.t ed I
tems
-
Dairies
Fruiterers
Supermarkets
Super fruiterers
Carrots
. lb
10'.'2
46.1"
. 30.7
32.4
26.3
Celery
stk
1.8
26.1
27.0
28.0
28.3
Cabbage
ea
2.8
15.5
13.3
13.1
8.5
Tomatoes
lb
9.1
110.8
105.5
101.8
104.4
Lettuce
ea
2.1
11.8
10.7
10.7
9.2
Onions
lb
13.3
52.1
44.2
45.2
30.8
Apricots
lb
2.8
36.8
37.4
35.2
34.1
Peaches
lb
1.4
14.1
14.,5
14.9
14.4
Plums
lb
0'.7
7.3
8.8
8.9
9.,5
Apples
lb
1.8
22.4
22.7
21.9
22.0
Strawberries pun
0.7
19.4
19.0
18.5
17.4
Grapefruit
lb
1.8
21.2
22.1
21.6
22.1
Potatoes
lb
51.2
129.0
143.3
145.4
107.5
-.)Nectarines
lb
0.4
4.4
4.9
4.6
4.9
00Total
100.0
511.0
504.2
502.2
439.4
B.
Aus;ust
Carrots
lb
9.9
14.7
12.6
12.8
7.8
Oelery
stk
0.5
7.1
8.1
6.9
11.8
Cabbage
aa
11.;
114.9
127.1
105.5
107.6
Tomatoes
lb
0.5
23.9
23.4
21.2
23.2
Lettuce
aa
0.8
20.8
19.5
16.2
19.7
Onions
lb
6.8
11.4
11.5
8.8
7.5
Kiwifruit
Ib
0.8
12.4
19.3
15.1
15.5
Tamarillos
Ib
0.8
13.9
14.:;
14.1
14.8
Mandarins
Ib
0.:;
6.1
7.3
6.6
7.4
Apples
Ib
11.7
107.3
112.8
106.9
9B.2
Lemons
Ib
0.'
6.6
6.:;
6.4
,5.5
Grapefruit
lb
0.8
12.9
13.7
10.7
,8.4
Potatoes
lb
;;.2
121.4
103.'2
1:;6.:;
110.4
Their major advantage lies then~ in a commodity which is not
auctioned at all but sold by treaty. Of the remaining thriteen
items in February this group had a buyin~advantage over
super-markets for seven.
caAbage and onions.
The advantage was significant for carrots,
Of the twelve items, other than potatoes
in August, the super fruiterer group had a buying advantage over
supermarkets for only five. This advantage was significant for
carrots again", onions, less so than February, and apples for
which they had no advantage during February.
From this summary it would appear that the auction system
piice forming process gives no dis~ount to the large buyer, but
that large buyers do get an advantage on hard lines of fruits and
vegetables which commonly are sold on treaty rather than under the
hammer.
The buying advantage, which the super fruiterer group has,
was passed on in the case of potatoes in both survey periods where
their markups were relatively low. However for carrots in both
periods, cabbage in February, onions in both periods~ and apples
in.August, markups were high, indicating that this group formed
prices in relation to ruling retail prices rather than in relation
to wholesale prices.
The relative expenditures of the other three groups were
in total fairly similar. However, they did bear the same
relationship to each other, with the grocer/dairy group having
the highest expenditure in February~ next were fruiterers and
20
grocer/dairies and fruiterers was reversed, while supermarkets were
still the lowest.
Comparison of the average auction and landed prices sives
some indication of the cost of having produce bought and delivered
by agents who provide these services. Results of an analysis of
this cost will be presented in the costs and efficiency studies
later in this publication.
2.6 Quality Ratings
The following table shows the quality rating, averaged over
all items for each group, and for each survey period.
Average ~uality Ratings
Survey Grocer/ Fruiterers Super- Super
Period Dairies markets fruiterers
-February 14.86 15.37 15.30 15.25
August 15.49 15.89 15.81 16.06
The average quality ratings during February showed little
difference between fruiterers (highest), supermarkets, and super
fruiterers (lowest). However these three groups had very
notice-able higher quality items than the grocer/dairy group.
The pattern was roughly similar in August where again the
grocer/dairy group had a significantly lower average. In August
however, the reduced sample size of super fruiterers resulted "in
this group having the highest, rather than the lowest,quali ty
The general level of quality averages was notably higher in August than in February. This ~as prbbably a fun~tion of: (a) The better storage conditions climatically at this
time of the year.
(b) The different composition of the survey items in either
22
3.
COSTS AND EFFICIENCY STUDIES
The survey results of the costs and efficiency studies were analysed in two parts. Results for all retail groups will also be presented in these two parts which were:
(1) Total store operations
(2) Fruit and vegetable operations only
The total sample size for each study was
35.
constituted as follows:Supermarkets Fruiterers Grocer/dairies Super fruiterers
3.1 Total Store Operations
12
10
11
2
This was
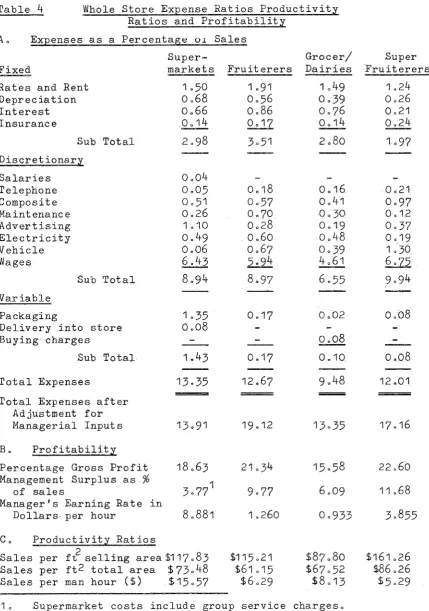
Table 4 Whole Store Expense Ratios Productivity Ratios and Profitability
Ao Expenses as a Percentage OI Sales
Fixed
Rates and Rent Depreciation Interest Insurance
Sub Total Discretionary Salaries Telephone Composite Maintenance Advertising Electricity Vehicle Wages Variable Packaging
Sub Total
Delivery into store Buying charges
Sub Total Total Expenses
Total Expenses after Adjustment for Managerial Inputs Bo Profitability
Super-markets 1.50 0068 0066 .0014 2098 0004 0005 0051 0026 1010 0049 0006 6043 8094
Percentage Gross Profit 18063 Management Surplus as
%
of sales 30771
Manager's Earning Rate in
Dollars· per hour 80881 Co Productivity Ratios
Sales per
ff
selling area$117083 Sales per ft2 total area $ 73048 Sales per man hour ($) $15057Fruiterers 1.91 0056 0086 0017 3051 0018 0057 0070. 0028 0060 0067 5094 8097 0.17 12067 19012 21034 10260 $115021 $61015 $6029 Grocer/ Dairies 1049 003~ 0076 0014 2080 0016 0041
0 030
0019 0048 0039 4061 6055 0008 0010. 9048 13035 $87080 $67052 $8013
'0
Supermarket costs include group service chargeso24
1 in Section A~ often at standard rates.
3.2 Costs Analysis
3.2.1 Total Fixed Costs. The first sub total in Table
4
is areflection of average fixed costs. These indicate that only
fruiterers have higher levels of average fixed costs than
super-markets. Even though the difference between supermarkets and
the outlets with lower average fixed costs may be discounted
somewhat because of higher site rental figures and better site
quality, these figures do nothing to indicate that supermarkets
achieve economies because they are larger than other outlets or
because they operate on a different production function. In
fact because supermarkets operate on a different production
function their average fixed cost load is likely to be greater
because many fixed. costs are associated with more intensive
capital usage.
The other major point of interest in discussing average
fixed costs is the relatively low level of fixed costs recorded
by super fruiterers. This is largely because of their lower levels
of capital in terms of both buildings, and plant and equipment, and
because of the relatively low levels of stocks required in a produce
operation.
1. A full description of standardisation procedures is to be
3.2.2 Discretionary Fixed Costs. The second major group of costs
for overall store operations are those costs which have been
described as discretionary fixed costs~ i.e. from salaries to wages
in Table
4.
The salaries recorded for supermarkets are payments to office
help only, and do not include payments to management.
The sub total for this group of costs shows average discre~
tionary costs to be highest for super fruiterers (Table
4).
Thencome fruiterers followed closely by supermarkets, while grocer/
dairies are substantially lower than all others.
The wages cost for super fruiterers and supermarkets is the
main cause of their higher costs. Over all retailers the average
wage cost as a percentage of discretionary fixed costs is
68.76
percent and as a percentage of all costs is
49.94
per cent. Withwages being of. such a magnitude it is desirable to investigate more
closely reasons for the differences between retail outlets.
3.2.2.1 Wages A major reason for the difference was found to
lie in the.average hourly wage rate. These rates were calculated
as follows:
Super- Gr.ocer/ Super
markets Fruiterers Dairies Fruiterers
Average hourly
1.00
0.78
0.69
0.64
wage rate ($)
If~ instead of using actual and imputed wage payments to
26
hours worked, including the manager's hours, at a standard rate of
seventy cents per hour, the wages percentages would change
substantially to the following figures.
Adjusted wages as a percentage of sales
Super-markets 4.57 Fruiterers 11 .11 Grocer/ Dairies
8.61
Super Fruiterers 13.23This adjustment works to the advantage of supermarkets ~or
two reasons. The first is a difference of thirty cents an hour
in the wage rate. The second is that a large proportion of
total hours worked, for fruiterers and grocer/dairies in particular,
had been excluded in order to impute a management surplus. The
inclusion of these hours meant that the labour costs for these
tWb groups was increased stibstantially~ If the adjustment allowed
for only the inclusion of managerial hours at the average wage rate
for the retail type (i.e. supermarket $1.00 per hour, fruiterers
78c/hour etc.), discretionary costs would be as follows:
Average discre-tionary fixed
costs after adjust-ment for managerial wages (cents/dollar of sales)
Super-markets 9.57 Fruiterers 15.42 Grocer/ Dairies 10.42 Super Fruiterers
This adjustment makes a very considerable difference to the
result. Now supermarkets have the lowest average labour cost even
highest retail groupo The only other change of significance is
that the average discretionary fixed costs of fruiterers is now
marginally greater than super fruiterers. The average discretionary
fixed cost for the grocer/dairy group has also increased substantially
although it remains considerably below that for fruiterers and super
fruiterers.
Other Discretionary Fixed Costs Other faGto~swhichare
notable among discretionary fixed costs are:
Advertising. For supermarkets this is substantially higher
than for any other outlet. Subsequent analysis of advertisinl
costs for supermarkets showed that higher advertising costs ~ere
associated both with higher margins and lower levels cftotal costs.
The interpretation put on this was that more advertising lowered
average total costs by encouraging greater utilisation of .facilities
by customers but that the benefits of these lower costs.accrued
largely to retailers in the form of higher margins.
(2) The low ratio for supermarkets of telephone costs by cdmparisol
with other outlets. This is noteworthy because it indicates
how overhead costs can be spread by producing large outputs.
(3)
The electricity cost ratio for super fruiterers issubstan-tially below that of other retail groups. This is very
likely an indication of the non'capital intensive nature of'their
28
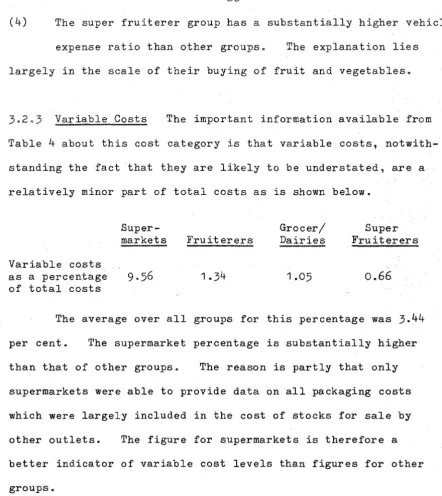
(4)
The super fruiterer group has a substantially higher vehicleexpense ratio than other groups. The explanation lies
largely in the scale of their buying of fruit and vegetables.
The important information available from
Table
4
about this cost category is that variable costs,notwith-standing the fact that they are likely to be understated~ are a
relatively minor part of total costs as is shown below.
Super- Grocer/ Super
markets Fruiterers Dairies Fruiterers
Variable costs
as a percentage
9.56
1.34
1.05
0.66
of total costs
The average over all groups for this percentage was
3.44
per cent. The supermarket percentage is substantially higher
than that of other groups. The reason is partly that only
supermarkets were able to provide data on all packaging costs
which were largely included in the cost of stocks for sale by
other outlets. The figure for supermarkets is therefore a
better indicator of variable cost levels than figures for other
groups.
3.2.4
Total Expense Ratios as Indicators of Efficiency Thetotal expense figures shown in Table
4
indicate that supermarketcosts as a percentage of sales are greater than for all other
costs~ this figure is misleading for it ignores the input of
managerial labour which is extremely significant for smaller
retail outlets. When managerial labour inputs are included at
the average wage rate for the relevant group, total costs as a
percentage of sales are as follows:
Total costs as a percentage of sales after adjustment
for managerial wages
Super-markets
13.91
Fruiterers
19.12
Grocer/ Dairies
13.35
Super Fruiterers
As with discretionary fixed costs, the adjustment for
managerial labour substantially changes the ranking of this
variable between different types of retail outlet. Now
fruiterers show higher costs as a percentage of sales than other
groups while the grocer/dairy group has the lowest tot~l expense
ratio, with supermarkets being only slightly higher. These total
expense ratios could be regarded as indicators of relative
efficiency only under the following conditions:
(1) where similar prices are paid for inputs of the same
quality by different retail types;
(2) where each retail type produces a similar quality
and mix of products;
(3)
where each retail type produces a similar quality andmix of services.
30
made that supermarkets pay considerably more for labour inputs
than other retail types. It is also notable that the quality o'f
labour used may be higher for supermarkets, but not as high as the
differential in wage rates would suggest. In this respect
super-market efficiency would have been understated.
A further feature of input costs noted in Table
4
is that packaging costs have been included largely for supermarkets onlY1other retail types including these in the cost of goods for sale.
If a figure of 0.1 per cent (similar to other retail groups) of sales only were included for supermarkets then a total cost ratio
of 12.80 would have been recorded for supermarkets, a figure lower than other groups (grocer/dairies are next highest at
13.35).
3.2.4.2
Product Quality and Mix The quality of grocery productscan be regarded as being similar for all types of retail outlets.
A can of beans is the same wherever it is bought. Differentials
in fruit and vegetable quality have been noted, the main point of
note being that the grocer/dairy group stocked fruit and vegetables
substantially lower in quality rating than the other three groups.
As only supermarkets have butchery departments no quality
comparisons are possible for meat. However this represents a
significant difference between retail groups in product mix.
invites the question; "in which direction would total costs be
biased because of the inclusion of costs associated with meat
This
the case study. This shows direct wage costs as a percentage of
sales for each of the four departments within the supermarket as:
Grocery Meat Produce Delicatessen
Direct wages as
a percentage of
5.4
10.7
1501
5.7
sales
This would indicate that the addition of meat to groceries
in the product mix would strongly bias distribution costs in an
upwards direction if only wage costs were considered, and this firm
were representative.
At the same time if the order of the wage ratios stated
above is consistent between stores, then because of the very high
wage percentage figure quoted for produce, it is likely that total
cost ratios for retailers more specialised in fruit and vegetable
retailing are biased upwards considerably compared to an enterprise
which handles only grocery goods.
The ultimate effect of differences in quality and product
mix then, if cost ratios are used as a measure of efficiency, would
be to reduce the ratios of super fruiterers, fruiterers and
super-markets relative to grocers. After allowing for this variable
supermarkets would have been proven more efficient than other retail
outlets.
3.2.4.3
Service Quality and Mix The question of quality and mix of services provided by different retail types is a vexed one,32
of retail outlet provides services unique in some way which help
to differentiate its product from that of other retailers.
It is not possible to say that costs, as indicators of
efficiency, should be weighted in any particular direction because
of differences in consumer services because in only a few cases
is it possible to put values on these serviceso The services
provided by different retailers are largely non quantifiable
aspects of a retailer's offer and should be assumed to have a
neutral effect on the use of relative costs as a measure of
efficiency.
3.205 ProductivitJ Ratios as Indicators of Efficiency If in
using relative cost levels as a measure of efficiency allowances
are made for differences in input prices, if data is standardised,
if allowances are made for differences in quality and mix of
products and services, then supermarkets would appear to be more
efficient than other retail outlets in the overall food retailing
function.
A more meaningful measure of the efficiency of retailers
of different types is a measure of physical output as a ratio of
physical inputs, usually labour and capital. A measure of
physical output for retailing is clearly not possible because of
the mUltiplicity of products which form the output.
In the present case output is measured as dollars of sales.
The best proxy available for physical capital is the floor area of
square foot total area are shown in Table
4.
A physical measure of labour is less difficult. Total man
hours of input is the common measure.
this analysis also.
This measure was used in
Table
4
indicates that the super fruiterer group is the most efficient user of capital, measured in both selling area and totalarea, with the supermarket group being next most efficient. It
also indicates that fruiterers are more efficient than grocer/dairies
in using capital measured in selling area but that the position is
reversed when capital is measured as total area.
In efficiency of labour use, supermarkets proved to be
substantially ahead of any other retail outlet, followed by grocer/
dairies, fruiterers, and super fruiterers in that order.
These results lend support to the results indica~ed when.
total costs were used to indicate the relative efficiency of different
types of retail outlet. Supermarkets, when efficiency is measured by
the productivity ratios above, also appear to be more efficient in
resource use than other retail outlets. Grocer/dairies, when
efficiency is measured on both scales would appear to be next most
efficient followed by the fruiterer group. The status of the
super-fruiterer group is less clear. This group is substantially more
efficient in capital usage than other retailers but least efficient
in labour usage. The average total cost of this group is lower
than fruiterers but substantially higher than the other two groups.
But as the case study results indicate that produce operations are
for differences in product "mix would improve the efficiency rating of
this group relative to the fruiterer group.
3.206 Profitability Ratios Table
4
also presents results of ananalysis of profitability ratios. The percentage gross profit
ratios show the grocer/dairy group to have the lowest figure and
the super fruiterer group the highest. Supermarkets have second
lowestgrQ.8sprofit ratios. These results are as would have been
expected
on
the basis of differences in output. The gross profitratios noted for different departments in the case study
super-market ~ere as follows:
Gross profit as a percentage of
sales
Grocery
15.9
Meat
25.2
Produce Delicatessen Total
33.3
18.8
19.6
From these figures it would be expected that outlets whose
output is biased towards hard grocery lines would have lower margins
and those biased towards produce items would have higher margins.
These figures are also in line with the major single cost
in retailing, labour. The greater the diversification from pure
grocery operations to produce operations the greater is the average
labour cost and the greater is the gross margin.
When management surplus is imputed as a residual it is its
absolute size which is significant rather than its ratio tosaleso
The average absolute management surplus figure was greatest for
dairies in that order.
Table
4
also shows that the substantial manager's surplusesfor supermarkets and super fruiterers are maint"ained on an hourly
basis but hourly returns for fruiterers and grocer/dairies were
substantially lower.
Summary of Analysis of Whole Store Operations The major
conclusion from this section of the study is that, when appropriate
allowances are made for differences in types of operation,
super-marketing performs well in terms of criteria of performance used.
These criteria indicate that supermarkets are the most efficient
users of most resources and have higher levels of profit than other
groups of retailers. On the same criteria of performance, grocer/
dairies and super fruiterers would rank next and fruiterers would
be ranked lowest.
3.3
Fruit and Vegetable Operations OnlyFor stores which stocked items other than fruit and vegetables
the calculation of fruit and vegetable costs required allocation of
some costs shared by the whole store. The techniques used to allocate
costs are described in greater detail elsewhere.1 These techniques
were based partly on a detailed study conducted in the case study
supermarket and each cost was allocated in a way which seemed to best
1. "The Economics of Retailing Fresh Fruit and Vegetables with
Special Reference to Supermarkets," A.E.R.U. Technical Paper
36
reflect relative resource usageo For example rental charges were
allocated in proportion to floor area used, depreciation in proportion
to plant and fittings value~ and advertising in proportion to
news-paper space used. A very small proportion of costs was allocated
using proportion of sales as a baseo The major cost, wages, was in
most cases calculated directly for fruit and vegetable operations.
Where estimation or allocation of costs is required, resultant
c6stswill be less than perfect indicators of resource usage by fruit
and vegetable operations. However, the background of the case study
and the skill of managers in assessing resource usage would assist
in ~inimising errors. Nevertheless the results of the study of fruit
and vegetable operating costs cannot be viewed with the same confidence
as reStllts of total store cost analysis.
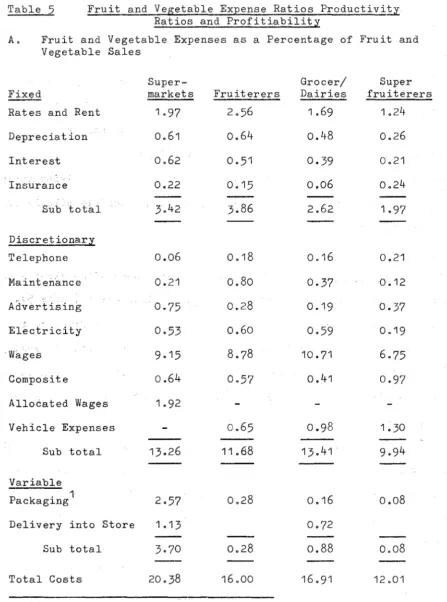
3.301
Results for Fruit and Vegetable Operations Onl~ These results presented in Table5,
are almost analagous to those presented in Table4
for whole store operations. Major points of differences are:(1) The management surplus for all but supermarkets and super
fruiterers is not a meaningful concept for fruit and vegetable
operations alone,because with other groups some estimates of labour
costs were needed and to be realistic these estimates required the
inclusion of managerial labour. Hence calculation of a managerial
surplus is not possible. For this reason profitability ratios also
list estimated net profit as a percentage of sales. For this
calculation estimates of the store manager's contribution to fruit
super fruiterers.
(2) Included in productivity ratios in Table
5
are estimatedbuying and delivery costs for produce. These were analysed
in a standard form separate from expense ratios and include actual
payments to resources employed outside the firm to perform these
functions, and times and mileages calculated out at standard rates
where these resources were internal to the firm.
(3)
Estimated packaging costs included under productivity ratios,represent. physical usage of packaging materials calculated
out at standard rates.
3.3.2
Fixed Costs For fruit and vegetable operations alo~e super-markets exhibi t t h e second highest. level of fixed; costs : (Table 5) 0Only fruiterers have higher average fixed costs. The fixed cost
level of s.upermarkets reflects largely the greater capital intensity
of supermarket fruit and vegetable operations. This is a result of
expensive cool storage facilities, sophisticated produce display stands
and packaging equipment, as well as machines for waste disposal.
The average fixed cost noted for super fruiterers is almost
half that of supermarkets despite the fact that they have more plant
and equipment than the average supermarket. This is because their
fruit and vegetable sales levels are substantially h~gher than the
average supermarket.
Both fruiterers and grocer/dairies have higher average fixed
Table
5
Fruit and Vegetable Expense Ratios Productivi!z Ratios and ProfitiabilityA. Fruit and Vegetable Expenses as a Percentage of Fruit and Vegetable Sales
Fixed
Rates and Rent Depreciation Interest .. Insurance . Subtotal Discretionary Telephone Maintenance Electricity ·Wages Composite Super-markets
0.22
3.42
0.06
0.21
0.75
0·53
9.15
0.64
Allocated Wages
1.92
Vehicle ExpensesSub total Variable
Packaging1
Delivery into Store Sub total Total Costs
1.13
3.70
20.38
Fruiterers0.51
0.15
3.86
0.18
0.80
0.28
0.60
0.65
11.68
0.28
0.28
Grocer/ Dairies1.69
0.48
0.39
0.06
2.62
0016
0.37
0.19
0.59
10.71
0.41
0.16
0.72
0.88
16.91
Super fruiterers1.24
0.26
0.21
0.24
1.97
0.21
0.12
0.37
0.19
6.75
0.97
0.08
0008
12.01
Table
5
(cont'd)B. Profitiability of Fruit and Vegetable Operations
Percentage Gross Profit
Management Surplus as
%
of Sales Estimated Net Profitas
%
of SalesSuper-markets 24.69 2.011 Fruiterers 29.94 13.88 C. Productivity as a Percentage of Sales
2
Produce Sales/ft Selling Area
2
Produce Sales/ft Total Area Produce Sales per
$112.09 $57.68
man hour $10.84
(in-store hrs only) Estimated Buying and
Delivery Cost as
%
2~62of Sales (Produce) Estimates Packaging
Costs as
%
of sales 2.51 (Produce) $133.18 $11.81 2.89 3.08 Grocer/ Dairies 27.10 10.50 $97.97 $65.40 $7.64 2.65 Super fruiterers 23.7 11.68 9.50 $161.27 $86.24 $10.85 2.051. Group service charges are included in expenses for management surplus calculation for supermarkets.
40
Fruiterers have higher average costs for all components of fixed
costs than grocer/dairies, a reflection of greater capital intensity.
The average fruiterer has about $1~700 worth of fruit and vegetable
plant and equipment and the average grocer/dairy about
$330.
3.3.3
Discretionary Fixed CostsSupermarkets have higher average levels of cost in this
category also. This is largely because of the level of labour
costs for this group. In addition to direct labour costs of 9.15
cents per dollar of sales, which is second only to grocer/dairies
with 10.71 cents, supermarkets have a further 1.92 cents labour
cost per dollar of sales. This is the produce department's share
of the cost of operating checkout and carryout services. Further,
distinct from the other three groups, supermarkets do not show a
share of the input of the store manager's labour. Nor does it
include any group administration charges for chain stores.
deficiencies are rectified in the profitability analysis.
These
However supermarket labour charges are not the only labour
charges understated. Most grocer/dairies buy produce without
using any internal labour resources. Their equivalent costs are
usually included in the cost of the goods, for which they can
there-fore be expected to pay more than other groups. No allowance for
the extra cost of goods is made in the cost analysis as all buying
and delivery costs have been analysed separately. The buying costs
for this group will be reflected in the profitability analysis.
understated is evident from the buying cost analysis. This shows
that it costs this group
6.58
cents per dollar of sales to buy fruit and vegetables, more than double the next highest buying costoThe average discretionary fixed cost level for both fruiterers
and super fruiterers is substantially lower than that for the other
two groupsr even before any corrections for the latter have been made
(adjustments would increase these costs). The major difference is
in the wage cost per dollar of sales, with super fruiterer~ wages
being only
6.75
cents per dollar of sales (Table5).
As with the total costs analysis discretionary costs other than
wages are comparatively minor and vary little between retail groups as
is shown below:
Average Discretionary fixed costs other than labour costs
Super-markets
2.44
Fruiterers
2.90
Grocer/ Dairies
2.70
Super Fruiterers
3.19
The largest of these other discretionary fixed costs were
supermarket advertising and super fruiterers vehicle running costs.
3.3.4
Total Costs and Efficiency The analysis of fruit and vegetable costs alone means that iriterpretation of total averagecosts as an indicator of effioiency of resource use, is not
complic-ated by gross differences in the type of produce handle~. Differences
within the fruit and vegetable group do exist, however, for although
42
the range of produce handled by supermarkets~ super fruiterers and
fruiterers did not vary greatly~ the grocer/dairy group had a
substantially poorer range. The differential effect on costs of
the limite~ range of fruit and vegetable items handled by grocer/
dairies is likely to be biased in favour of this group for they
stock predominantly less perishable items requiring a minimum of
handling. A fuller range of produce items stocked by this group
is therefore likely to increase their average costs.
It has also been noted that grocer/dairies stock poorer
average quality fruit and vegetables. For this reason als09
treatment of average costs as a measure of efficiency introduces
a bias in favour of this group.
Other introductions of bias have already been noted. These
include the understatement of supermarket labour costs because the
store manager I s labour has been excluded, the exc.lusion of group
administration charges for supermarkets, the non-allowance for
buying costs for grocer/dairies, and the inclusion of all packaging
materials costs for supermarkets only.
A further difference in the mix of products exists due to
closer grading of some items by some groups • This would introduce
. a bias against fruiterers and super fruiterers who offer many items
of the same sort at a range of different prices.
Perhaps the most important factor to consider however~ when
costs are used to approximate efficiency, is the assumption that
estimation or allocation techniques reflect resource usage by
were able to give little guide as to labour usage in selling fruit
and vegetables when items other than these were sold at the same
time. A good portion of labour usage for these groups was
neces-sarily based on estimates of only a few members of each group. Were
labour not such an important single cost, this would not present such
a problem.
3.3.5
Productivity Ratios After allowing for ambiguities in thepresentation of results and for the effects of differences in quality
and mix of produce and services, there is likely to be little
difference between supermarkets and grocer/dairies as the least
efficient retailers of fruit and vegetables when this is measured by
average total cost levels. On this score super fruiter~rs are
clearly the most efficient fruit and vegetable retailers. The
latter conclusion is confirmed when the productivity ratios in ~able
5
are examined. Of the five ratios considered super fruiterers fail
to record best results on only one occasion. The fruiterer group
is the most efficient user of labour, which for productivity
calcul-ations excludes buying time. Supermarkets, although, only marginally
less efficient in labour use than super fruiterers, are clearly
inferior to these groups in capital usage where this is indicated by
sales per square foot. Grocer/~airies are the least efficient users
of selling space. Their higher ranking on the score of total fruit