Themed Section: Engineering and Technology
Performance Evaluation of Composite Network Security Situation Assessment
Using HRCAL Approach
Ankita Patil1, Mr. Vijay Prakash2
1,2 Dept. of CSE SVITS, Sanver Road, Indore (M.P), India
ABSTRACT
Internet attacks area unit on the increase and create serious security threats to enterprise networks, industrial websites and to the lots of home web users. Web attacks have become less assailable and complicated with time. Network traffic visualization tools have with successfully enabled security analysts to know the character of traffic gift in a very network. Conversely, these tools believe principally on human experience to get anomalies in traffic and attack patterns. Human capability to grasp large amounts of time-varying data is proscribed and network visualization tools want additional visual aid to extract attention-grabbing patters from such massive and complicated knowledge sets [1]. By visualizing a group of straightforward graph patterns, analysts will place along visual items of knowledge sent by these smaller patterns and might find out about larger and a lot of complicated patterns.Powerful and versatile specification will work on the limitation of un-uniform pattern specification formats existing within the current tools. Therefore, our approach gives way to an iterative visual investigation and allows fast discovery of a lot of subtle attack patterns and abnormal options that area unit otherwise undetectable by normal network traffic visualization tools. [2]
Keywords
HRCAL (Host, Route, Configuration and Attack Level Analysis), Visualization, Forecasting, makeover.
I. INTRODUCTION
In this process it works as a decision making method which has the prediction of attack vulnerability on a selected device. The forecast shows that the attack pattern is totally matched by previously keep values and its impact is analysed. in line with known knowledge the choice ought to be taken to inform the other nodes, by Associate in alert message. Thus, by the on top of method it's measured analytically that the attack vulnerability are going to be detected additional accurately in real time. Here the protection scenario of current communication and networked operations are analysed on the premise of previous participation's and vulnerability measuring. For proving the usefulness of the approach a dummy attack is
generated and inserted during this system [3]. The system is capable of distinctive the changes performed by the attack to the system. the proportion of modification can provide the vulnerability values whose image achieved by suing attack graphs. Alerting mechanism can build the system updated regarding this attack incidence and forecast their behaviors in a close to future by that their defensive mechanism may be drafted. analysis of work on some preliminary analytical parameters can show that the approach is proving its sturdy presence in terms of effective and correct detection of unsure conditions
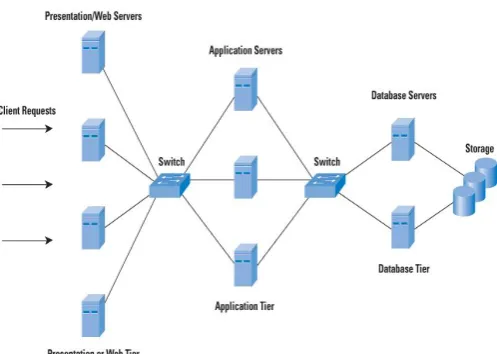
Figure 1: Network infrastructure using client request
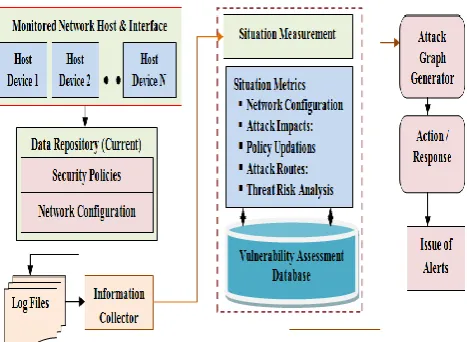
Network data visualization has successfully enabled security initially the node or network element performs an everyday operation or practicality whose final product for the instructed approach is data. The elements often generate a data in an exceedingly specific format taken from log files. This log can work as information taking module. Principally the log contains two categorical data: Security Policies and Network Configurations that square measure wont to discover the deflections from desired conditions [4]. This information is tool generated and is totally different from different tool and wish to be structured in exceedingly given formats that justify the utilization of metrics for transformations. This work takes the input in five classes of metrics: Network, Host, Attack Impact, Routes and Specific Patterns. It expresses the worth on behalf qualitative analysis (risk analysis) and converts them to sure quantitative measuring. From this completely different values attack graph is generated to ascertain the attack impact chance and also the values square measure hold on into information.
Types of user attributes:
Consumers It provides support to the network for the interchanging of data between two devices. Provider: This network supports the any connections between different nodes so that they can easily communicate.
Individuals: All the devices which have the capability of sensing, calculation and networking. Secure network combines the power of all three of them.
Figure 2: User Attribute Detail
Related Study
program. At the same time, a method allows a quite effective implementation of the improved assessment method.
The unusual behaviour by measurement the response mechanism for a network and identifies the mitigation of cyber-attacks and their harms. A grey theory, inverse function based model is conferred that is capable of distinctive the frequency of attack occurrences and supports the early warning wants. The approach is measurement the time interval between the operations and models with a dodging factors exactitude [6]. It counsel a unique model SIEM (Security info and Event Management) for attack evaluations. The development measures the behaviour of existing attacks and therefore the generating nodes for correct analysis through a standard attack graph generator. It uses numerous security metrics for providing correct risk analysis throughout attack modelling security part (AMSEC) execution phase. The paper conjointly presents associate epitome model for result analysis.
An analytical intrusion detection framework (AIDF) exploitation probabilistic determination theory is planned. The approach is created by two basic steps; a likelihood model discovery approach, and probabilistic abstract thought mechanism for generating the foremost probable attack occurrence factors. The ideas are much enforced exploitation associate open source tool Snort for network .[7]
Later, on some more analysis based mostly tools are given, like Silk. The tool is highly-scalable, low-data capture and analysis system applied within the space of network forensics, worm behaviour, and vulnerability exploits, distinctive artefacts of intrusions etc. Another connected related visualization tools and their structured analysis is given in. [8] These are NVisionIP and VisFlowConnect-IP used for large volume, advanced data transparently to system administrators in easy intuitive visual interfaces that support human psychological feature processes
needed to require the vulnerability decisions. The tools are effective in their visualization orientations and conjointly the generated data analysis is extremely effective and applies time saving approaches. The visualization makes the user simply perceive the particular read of the network. NVisionIP and VisFlowConnect-IP are often used singly or in unison for correlating events. This work is distinguished from others therein these are the primary web security visualization tools to be freely accessible on the web and deployed in massive production environments.
Multi visualization design is being planned over the previous few years to reinforce the flexibility of associate administrator to observe and investigate abnormal traffic between a local network and external domains. [9] Central to the planning could be a parallel axes view that displays Net Flow records as links between two machines or domains whereas using a spread of visual cues to assist the user. The tools have many filtering options that can be used to cover uninteresting or innocuous traffic specified the user can focus his or her attention on the more unusual network flows. Such effective coming up with resolves numerous runtime configuration and management problems through real time administrative controls.
numerous simulation experiments, it proves that the planned methodology has blessings over Wavelet Neural Network (WNN) methodology and Back Propagation Neural Network (BPNN) methodology with an equivalent design in convergence speed, functional approximation and prediction accuracy.
A visual analysis with a declarative knowledge illustration supported first-order logic. Although the declarative language used makes pattern specification a lot of versatile as compared to it in and will capture some temporal relations, however since it involves mounted range of predicate overflow variables (individual flow records), it's not as powerful or intuitive as our sub graph pattern specification. The utilization of first-order declarative language conjointly makes the pattern specification cumbersome and drawn-out for analysts. [11] For even easy patterns, the specification tends to involve several clauses and is so quite difficult.
Visual data processing (VDM) focuses on exploitation visualization to explain the information and patterns created by data mining algorithms. [12] The visualization permits the user to find a lot of patterns within the data, evaluate this patterns then re-run the data mining algorithms with totally different inputs. The goals of VDM are the same as ours, however whereas they specialize in modifying the working of a data mining algorithmic rule, we tend to specialize in highlight the user-defined patterns to facilitate the discovery of more complex pattern.
II. METHODS AND MATERIAL
2.1Problem Domain
The information processing is based on fusion of network factors and parameters which is used to make the preventive assessment of the situation. Aim is to detect the unusual patterns and from this predict the future effects of the attacks on mentioned devices. After studying the various
existing approach in the different areas of the network used for predictions and forecasting, this work had identify that analyst have to know the patterns in a restricted manner and the detection is totally based on logical capabilities of few of those. Thus, some automation is required for better understanding of vulnerabilities and effects of attacks. Here are the some identified issues in existing approaches for resolving the issues of vulnerability analysis.
Problem 1: All the existing system will consider vulnerability in a qualitative aspect rather than some quantitative aspects which mislead the analyst’s.
Problem 2: Real time measurement is not given by which losses are comparatively larger than others.
Problem 3: Massive data processing some time generates false alarm and incorrect predictions thus prediction accuracy needs to be considered as primary parameters for the work.
Problem 4: The assessment used to classify network state and the level of information required for optimal illustration is not complete always which misguide the prediction. Thus the transformation of such information with certain attributes is not provided by any of the existing mechanisms [13].
position coordinates (pair of comma separated real numbers.
2.2Proposed HRCAL Approach & Algorithm
HRCAL is effective quantitative analysis of various network situation. This can be taken as core component in network security situational awareness (NSSA) work in presence of which the data fetching and their processing is not compromised by the kind of changes occurring in the network. The work aims to identify the changes for detection of certain unusual behaviours which is been strictly followed by attack previously. Detection is not feasible in single or double data entries. For these thousands of records needs to be processed this evaluates the values on the basis of various metrics used for data transformations. These records and the generated data from different devices will show the misleading configuration information and exchanges. The work aims to identify the information required for measuring and assessing the probability of occurrence of attack on certain specific devices [15].
Security is the means of achieving confidentiality and privacy with robust data transmission and availability. For effective communication over the network, it could be treated as critical factor and must be monitored continuously. Network is a big working environment made from collection of various devices, protocols, servers and host parallel generating thousands of records per unit time. Processing of such huge amount of data is a complicated task and requires more efforts in terms of time and cost. Thus, this paper provides an alternative way of handling security by vulnerability assessment. According to the approach, network components are analysed on their previous activities and changes accommodated. These factors should be permitted or rejected accordingly to their probability of attack vulnerable values called as assessment values .
Higher be the generated value larges be the attack occurrence probability and smaller be the value less
probable to attack. Representation of component for this network pattern analysis based vulnerability measurement is given by attack graph. There are some benefits of using the metrics in this work given here as:
1) Improved performance and protection level of the system
2) Monitoring model which compares the current values with ideal values after which validation of operations and changes is measured.
3) Contribute to the enhancement of the existing security practices and to the integration of information security to its business processes values.
Figure 3 : hrcal based network situation awareness
Algorithm
Here we use the following modules for implementing our system:
1. Evaluate Packet dataset Step 0: Initiate
Step 1: Get the outclass Dataset
Step 2: Evaluate all the rows and column and set in the array.
Step 3: After that assign all individual packet information in a line.
Step 4: Stop
2. Create an alert object Step 0: Initiate
Step 2: Examine srcip, dstip, srcport, dstport, type, time from the line for each packet information. Step 3: Form an alert object
Step 4: Stop
3. Time and Space limit Analysis (TSLA) Step 0: Initiate
Step 1: Get each and every alerts
Step 2: It is used for all alert which are critical and manic check the condition if(sip(AI)=sip(AJ) and dip(AI)=dip(AJ) and time(AJ)<time(AI) and time(AJ)-time(AI)<TW) if yes then goto step 6 otherwise go to step 2.
Step 5: Set (AI,AJ)in alert pair. Step 6: Stop
4. Uniform attack Graph Generation Step 0: Initiate
Step 1: Get the set of alert pair.
Step 2: Generate a node set N which consists of AI of each alert brace.
Step 3: Create a frame set E which consists of (AI, AJ) of all alert brace.
Step 4: For each edge (Ni, NJ) check the condition of an circumlocutory path Ni, NK, NJ then delete (Ni, NJ) from the frame set E and return graph G (N,E).
Step 5: Stop
5. Generation of Alert Device Evaluation Matrix Step 0: Initiate
Step 1: Acquire Number of devices and alerts. Step 2: For every alert in rows create a set E such that E (AI, DJ).
Step 3: Accumulate it in a hash set matrix. Step 4: Stop.
6. Computation of Unit Risk Evaluation (URE) Step 0: Initiate
Step 1: Find a exacting device and its alert set E from the matrix of module 5.
Step 2: Find alert level l(A) and device level l(D). Step 3: Determine EAD= 5l(A)-1 * 5l(D)-1. Were A
refers to the alert generate by IDS for
corresponding attack; D represents the device which is attacked; l (a) and l (d) represent the levels of the alert and the particular device.
Step 4: Stop
7. Evaluation of Attack Risk Evaluation (ARE) Step 1: Initiate
Step 2: Obtain all the URE of all the devices. Step 3: For each URE Calculate, EA = EA + EADI. Step 4: Stop
8. Calculation of Device Risk Evaluation (DRE) Step 0: Initiate
Step 1: Obtain all the URE of all the devices. Step 2 : For each URE calculate, ED = ED + EAJD Step 3 : Stop.
9. Calculation of Network Risk Evaluation (NRE) Step 0: Initiate
Step 1: Obtain all the URE of all the devices. Step 2: For each URE calculate, EN = EN + EAJ OR EN = EN +EDI
Step 3: Stop.
III.RESULTS AND DISCUSSION
Logging table
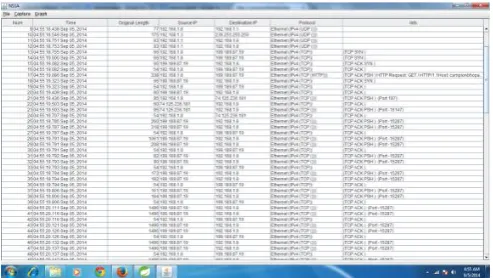
This table provides the uniform approach for data enter in the network with information about time,Source IP,Destination IP,Server information all this field comes under this table approach.
Figure 4: Logging network detail
Network graph Description
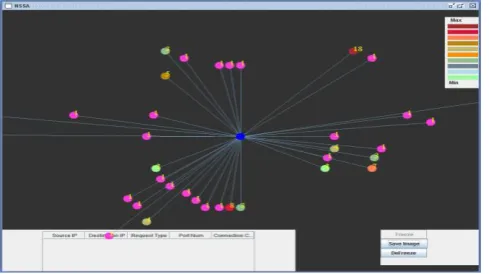
Figure 5: Network graph with different colour
Node detail graph
This graph shows details of different nodes in a loop,it provides information on IP Address from where it originated,it also provides information about the packet size and on which protocol it is based
Figure 5: Node detail graph
Showing Node detail Saved: In this graph it shows details of different nodes and saved the image on the basis of node location.
IV. CONCLUSION AND FUTURE WORK
Conclusion
In visualizing a set of simple graph patterns, analysts can put together visual pieces of information conveyed by these smaller patterns and can learn about larger and more complex patterns. Theatrical performance of network traffic pattern in graphic language is visually intuitive, powerful and flexible specification and overcomes the limitation of poor pattern specification formats existing in the current tools. Therefore, our approach gives way to an iterative visual investigation and enables rapid discovery of more sophisticated attack patterns and anomalous features which are otherwise undetectable by standard network traffic visualization tools. We have presented a network traffic analysis system that supports graph pattern matching and visualization. Graphical language is a highly intuitive, flexible and general pattern specification format that captures temporal and spatial events in network traffic. By putting together visual pieces of information conveyed by smaller patterns, security analysts can discover more complex and sophisticated attack patterns [14]. Our approach is to search and highlight user-specified graph patterns in network traffic logs.
Future Work
V. ACKNOWLEDGMENT
This research work is self-financed but recommended from the institute so as to improve the HRCALwith current techniques in network security using this method. Thus, the authors thank the anonymous reviewers for their valuable remarks, which strengthened the paper. The authors also wish to acknowledge institute administration for their support & motivation during this research. They also like to give thanks to Mr. Vijay Prakash & Mr. Rajiv Vishwakarmafor discussion regarding the situational awareness system & for producing the approach adapted for this paper.
VI. REFERENCES
[1] Rongrong Xi, Shuyuan Jin, Xiaochun Yun and Yongzheng Zhang, “CNSSA: A Comprehensive Network Security Situation Awareness System”, in International Joint Conference of IEEE TrustCom, ISSN: 978-0-7695-4600-1/11, doi: 10.1109/TrustCom.2011.62, 2011.
[2] Endsley, M. , "Toward a theory of situation awareness in dynamic systems, " Human Factors, Vol. 37, No. 1, pp. 32-64, 2005.
[3] Lai Jibao, Wang Huiqiang, and Zhu Liang, "Study of Network Security Situation Awareness Model Based on Simple Additive Weight and Grey Theory," 2006.
[4] Liu Mixi, Yu Dongmei and Zhang Qiuyu et aI. , "Network Security Situation Assessment Based on Data Fusion, " 2008 Workshop on Knowledge Discovery and Data Mining, 2008. [5] Yu Dong and Frincke, D. , "Alert Confidence
Fusion in Intrusion Detection Systems with Extended Dempster-Shafer Theory, " 43rd ACM Southeast Conference, March 18-20, 2005.
[6] Wang Huiqiang, Lai Jibao, and Ying Liang, "Network Security Situation Awareness Based on Heterogeneous Multi-Sensor Data Fusion and Neural Network, " Second International
Multisymposium on Computer and
Computational Sciences, 2007.
[7] Stefanos Manganaris, Marvin Christensen, Dan Zerkle, et al. A data mining analysis of RTID alarms. Computer Networks, 2000, 34(4):571-577
[8] Bass, T. and Robichaux, R. , "Defense-in-depth revisited: qualitative risk analysis methodology for complex network-centric operations," Proceedings of IEEE Military Communications Conference, vol. 1, pp. 64-70, 200 I.
[9] Zhang Yong, Tan Xiaobin and Xi Hongsheng, "A Novel Approach to Network Security Situation Awareness Based on MUlti-perspective Analysis, " IEEE 2007 International Conference on Computational Intelligence and Security, 2007.
[10] Chen XZ, Zheng QH and Guan XH et aI. , "Quantitative hierarchical threat evaluation model for network security, " Journal of Software, Vol. 17 , No. 4, pp. 885-897, April 2006, http://www. jos. org. cn/lOOO- 9825/17/885. htm, Accessed on Jun 2008. [11] J Hall, J Pei, Y Yin. Mining frequent
patterns without candidate generation. 2000 ACM. SIGMOD int'I Conf on Management of Data (SIGMOD'OO), DallaS, TX, 2000
[12] Mika Klemettinen. A knowledge discovery methodology for telecommunication network alarm databases. [Ph 0 dissertation]. Helsinki: University of Helsinki, Finland, 1999
[13] Haines JW, Lippmann RP, Fried OJ, Tran E, Boswell S, Zissman MA. DARPA intrusion detection system evaluation: Design and procedures. Technical Report 1062, Lexington: MIT Lincoln Laboratory, 1999.
[14] Lang F, Wang C, Gouqing M. " A Framework for network security situation awareness based on knowledge discovery" 2010 2nd International conference on computer Engineering and Technology.
[15] Ankita Patil, Vijay Prakash “A Novel Framework for Composite Network Security
Situation Assessment Using HRCAL