A G R I C U L T U R A L
E C O N O M I C S
R E S E A R C H U N I T
Lincoln College
CONSUMER DEMAND FOR BEEF
IN THE E.E.C.
by
A.C. Hannah
Technical Paper No.
11
THE AGRICULTURAL ECONOMICS RESEARCH UNIT
The Unit was established in 1962 at Lincoln College with an annual grant from the Department of Scientific and Industrial Research. This general grant has been supplemented by grants from the Wool Research Organisation and other bodies for specific research projects.
The Unit has on hand a long-term. programme of research
in the fields of agricultural marketing and agricultural production, resource economics, and the relationship between agriculture and the general economy. The results of these research studies will in the future be published as Research Reports as projects are completed. In addition, technical papers, discussion papers, and reprints of papers published or delivered elsewhere will be available on request. For a list of previous publications see inside back cover.
RESEARCH STAFF : 1970
DIRECTOR
B. P. Philpott, M. Com., M.A. (Leeds), A.R.A.N.Z.
RESEARCH ECONOMISTS
R.W.M. Johnson, M.Agr.Sc., B.Litt.(Oxon.), Ph.D.(Lond.) T.W. Francis, B.A.
G.W. Kitson, B.Hort.Sc. A.D. Meister, B.Agr. Sc. T.R. O’Malley, B.Agr. Sc. H.J. Plunkett, B.Agr. Sc.
G.W. Lill, B.Agr. Sc.
UNIVERSITY LECTURING STAFF
A.T.G. McArthur, B.Sc.(Agr.)(Lond.) M.Agr.Sc.
B.J. Ross, M.Agr.Sc.
R.G. Pilling, B.Comm.(N.Z.), Dip.Tchg., A.C.I.S.
CONSUMER DEMAND FOR BEEF
IN THE E. E. C.
by
A. C. Hannah
In the negotiations connected with Britain ' s entry into
the E. E. C., New Zealand possesses very little true bargaining
power. The only weapon we can use is to be better informed
than the other side about the structure and economics of the
E. E. C. market for products with which we are vitally concerned.
This is the rationale underlying the decision by the Research Unit to initiate some work on consumer dern.and for
beef in the E. E. C. and the present paper by Mr A. C. Hannah is the result.
Apart from. presenting detailed results for a num.ber of econometric models relating to each of the five m.ain E. E. C.
countries, Mr Hannah also gives a large amount of inforrn.ation on the market structure for m.eat in each of the countries;
and he has also brought together all the relevant m.eat production, consum.ption and price data, and for this reason alone we hope the paper will prove useful for reference purposes.
Lincoln College November 1970.
LIST OF TABLES
LIST OF FIGURES
INTRODUCTION
CHAPTER I
"
"
"
II II
"
CHAPTER II
BEEF PRODUCTION 9 CONSUMPTION AND TRADE IN
THE E.EoC.
1e1e1 Production
1.1.2 Comparison with other Meats
1.1.3 Production of Beef and Other Meats in the Individual Countries of the EeE.C.
1 02 Consumption
1
03
Trade104
10301 Detailed Analysis of Imports and Exports of Beef and Veal for 1968.
EoEoC. Market Regulations for Beef and Veal
1.4.1 Brief History of the Common Agricultural Policy
1 0402 Regulations for Beef and Veal
A REVIEW OF SOME PREVIOUS ECONOMETRIC ANALYSES OF DEMAND FOR BEEF9 WITH PARTICULAR REFER-ENCE TO THE E.E.C. COUNTRIES
PAGE
1
3
CHAPTER II
"
II
"
"
CHAPTER III
"
"
"
CHAPTER IV
"
"
2.1 A. Weber (1960)
2.2 H. Fau~e (1967)
2.3 B. Calicis (1969)
2.4 Kettunen (1968)
2.5 Summary
MARKET STRUCTURE AND CONSUMPTION TRENDS FOR BEEF IN THE E.E.C.
3.1 Northern Europe
3.101 The Marketing Chain
3.1.2 Margins
3.1 03 Consumption Trends and Habits
3.2 France
3.2.1 The Marketing Chain
3.2.2 Margins
3.2.3 Consumption Habits and Trends
3.3.1 The Marketing Chain
3.3.2 Margins
3.3.3 Consumption Trends and Habits
A DISCUSSION OF THE MODELS AND DATA TO BE USED IN THE ANALYSIS
4.1 Specification of the Model
·4.1.1 Statistical Tests
4.2 A General Note on the Data
i i
PAGE
47
PAGE
CHAPTER ."V ANALYSIS OF THE DEMAND FOR BEEF AND
VEAL IN GERMANY 79
II,
5 .. 1 The Data
5.1 .1 Price
5 .. 1 .2 Income
5~103 Consumption
"
5.2 Results5.2.1 Results of the Monthly Analysis
" 5.2 .. 2 Results of the Quarterly Analysis
5.2 .. 3 Results of the Annual Analysis
CHAPTER VI ANALYSIS OF THE DEMAND FOR BEEF AND VEAL
IN THE NETHERLANDS 96
II 6.1 Th~ Data
"
6.2 Results6.201 Results of the Quarterly
Analysis
6.2.2 Results of the Annual Analysis
"
603 Summary of ResultsCHAPTER VII ANALYSIS OF THE DEMAND FOR BEEF AND VEAL
IN BELGIUM 106
"
7.1 The Data7.2 Results
7.2 .. 1 Resul ts of the Quarterly Analysis
7.2.2 Results of the Annual Analysis
iv
PAGE
CHAPTER VII I ANALYSIS OF THE DEMAND FOR BEEF AND VEAL
IN FRANCE 118
"
8.1 The Data8.1 .1 Price
8.1.2 Income
801 •. 3 Consumption
"
8.2 Analysis of Demand and Results8.2.1 Results of the Monthly Analysis
8.2.2 Results of the Quarterly Analysis
8.2.3 Results of the Annual Analysis
"
8.3 Summary of ResultsCHAPTER IX ANAL YSIS OF THE DEMAND FOR BEEF AND VEAL
IN ITALY 147
11 9.1 The Data
"
9.2 Results9.2.1 Results of the Quarterly Analysis
9.2.2 Results of the Annual Analysis
"
9.3 Summary of ResultsCHAPTER X SUMMARY AND CONCLUSION 155
ACKNOWLEDGEMENTS 159
REFERENCES 160
APPENDIX' AI German Data
APPENDIX C
APPENDIX D
APPENDIX E
Belgium Data
French Data
Italian Data
TABLE 1 ,,1 1.2 1.4 1.5 1.6 1.7 1.8 1.9 1.10 1 .11 1 .12 1.13 1.14 3.1
LIST OF TABLES
DESCRIPTION
Numbers of Meat Producing Animals in the EoEoCo
Net Production of Meat in the EoE.C. by Category
Numbers of Meat Animals in the Countries of the E"EoC"
Gross Production (Before Trade) of Meat in the E.E.C o Countries
Percentage of Total Meat Production for each Type in 1968, by Country
Consumption of Meat in the E.EoC.
Per Caput Consumption of Meat in the E.E.C.
Percentage of Total Meat Consumption for Each Type in 1967/68, by Country
Degree of Self-sufficiency of the EoEoCo in Meat
Trade in Meatg by Country and by Clas~ in the
E.EoC.
1968 Imports and Exports of Beef and Veal, by Country of Origin
Percentage of Contribution to Fund
E.A.G.G.F. Expenditure during First three Financial Years
Marketing of Beef Cattle in West Germany 9 as a
Percentage of Producer Sales
TABLE
3.6
3.8
3.10
5.3
5.4
5.5
5.6
6.1
6.2
6.3
DESCRIPTIONTrading and Preparation Margins for West German Beef
Person Responsible for Food Buying
Frequency of Buying Meat
Per Caput Consumption of Beef and Veal According to Occupation of Head of Household
Per Caput Consumption of Beef and Veal According to Demographic Area
Per Caput Consumption of Beef and Veal According to Geographic Region
Percentage Sales of Beef and Veal According to Type of Retail Outlet
Income Elasticities Associated with Different Income Groups
Income Elasticities Associated with Different Demographic Groups
Percentage of Meat Bought at Different Retail Outlets in Italy
Results of German Monthly Demand Model I
Results of German Monthly Demand Model I -with Chicken as an Additional Explanatory Variable
Results of German Quarterly Demand Model I
German Quarterly Demand Model I with one and two years deleted
Results of German Annual Model I
Results of German Annual Model II
Results of Netherlands Quarterly Model I
Results of Netherlands Quarterly Model II
Resul ts of Netherlands Annual Model I
TABLE
8.2
8.3
8 .. 4
8.5
8.68.7
8.8 8.10 8.11 DESCRIPTIONResults of Netherlands Annual Model II
Results of Belgium Quarterly Demand Model I
Results of Belgium Quarterly Demand Model II
Results of Quarterly Belgium Demand Model II when Pb2 Replaces Phi as the Dependent Variable in the Estlmated Equations
Results of German Annual Demand Model I
Results of German Annual Demand Model II
Factors used to Correct French Production for Fraud
Purchases of SoIoEoBoVo and Wholesale Beef Price Compared 1960 - 630
Salesg Purchase and Stocks of Beef in France 1960 - 640
Results of Monthly Demand Model I - France
Results of Monthly Demand Model
Ip
with the addition of Chicken and Veal Prices as Independent VariablesResults of Quarterly Demand Model I - France
Results of Quarterly Demand Model I - with addition of Chicken and Veal Price
Variables 0
Results of Quarterly Demand Model II
Structural Elasticities for Equations 802029 and 802030
Results of Annual Demand Model I
Results of Estimating Annual Demand Model II
Results of Quarterly Demand Model I - Italy
Simple Correlations for Equations 90201 and
TABLE DESCRIPTION PAGE
9 .. 3 Results of Annual Demand Model I - Italy 152
9.4 Simple Correlations for Equation 90203 151
9.5 Results of Annual Demand Model II - Italy 152
10 01 Summary of Elasticities obtained in the
FlGURE
EIST OF FIGURES
DESCRIPTION
Marketing Chain for Beef in Germany? The Netherlands~ and Belgium
Meat Marketing Channels in France
Reference Map of France
Marketing Channels for Beef in Italy
German Quarterly Beef Consumption
German Beef Consumption per Head
German Deflated Beef Price
Netherlands Quarterly Beef Consumption
Netherlands Annual Beef Consumption
Belgian Quarterly Beef Consumption
Belgian Annual Beef Consumption
Deflated Belgian Annual Beef and Pork Prices
French Monthly Beef Consumption
French Quarterly Beef Consumption
French Annual Beef Consumption
Deflated Beef Price - France
Italian Quarterly Beef Consumption
PAGE
49
57
59
65
90
93
93
99
103
111
112
113
129
137
143
144
Recent measures to increase beef production in New Zealand have
directed interest towards potential markets. An O.E.C.D. (1) study
predicts that the area with the second largest net requirement for
beef by 1985 will be the E.E.C. countries (The United States has the
largest requirement) with net imports of 970,000 metric tons. This is
a very large quantity of beef - about triple New Zealand's total
pro-duction - and implies that the E.E.C. could become a market for New
Zealand beef. However much political considerations make this
unlike-ly. Western Europe is an area in which New Zealand should now, because
of the negotiations on Britain's entry into the E.E.C., take an interest.
Projections such as the one mentioned above have used income as the
main determinant of future demand" modifying the estimates when they
thought the price structure might change. The object of this study.
has been to try and quantify the relative effects of price and income
on E.E.C. demand for beef in order to yield coefficients which might
be used in later projection work.
Chapter I is a discussion of past and present trends in E.E.C.
meat production, consumption and trade, with special reference to beef.
Chapter II reviews previous studies of beef demand in Europe, and the
---
.. -".~...
E.E.C. in particular. Chapter III describes the meat markets in the
E.E.C. countries while Chapter IV develops the models and discusses
the data to be used.
Chapters V through IX give the results of the analysis country
by country and Chapter X is the summary and conclusion.
BEEF P1WDUCTION. CONSUMPTION AND TRADE IN THE E.E.C 0
1.1.1 Prqduction (1)
Beef is one of the two important meats produced in the E.E.C.
Most is produced jointly with milk on small farms (the average size of
holdings in the E.EoC. countries is between 6 and 10 hectares) from dual
purpose breeds of cattleo Only in France and Italy are there sizeable
numbers of pure beef breeds~ and even in these two countries they account for only about 2Cffo of production. Feed-lot fattening is rate, but in the Nethedands tr.ere is a IHtle joint production, unWol'Keq· dairy
calves being sold as young stores either for finishing in winter yards
or on summer grass.
Beef production in the EoE.Co fits into four main categories.
(1) Vealer calves of 100 - 150 kg (2-)cwt) live-weight reared
on milk (whole or skim) plus concentratesg or 200 kg
(4
cwt) if rearedto six months with a little roughage. Production of this type of calf
is typical of the smaller type of dairy farm.
(2) "Baby-beef
l'
intensively reared on cereals.(3) 18 - 20 month old cattle of up to 500 kg (10 cwt) reared on
non-concentrate feed such as silage and finished off on grass.
(4) Two to four year old beasts of between 500 and 700 kg
(10-14 cwt) produced on non-dairy farms~ Often a long store period on
grass and a final winter fattening in yardso
Finally, barren dairy cows are an important source of beef in
the E.E.C. countries 0
1.1.2 Comparison of Beef with other Meats
Measured on the basis of number of animals, beef would appear to
be the most important meat in the E.E.C., however in terms of total
production it is less important than pig-meat. These two meats dominate
the scene, other types of meat such as sheep and poultry being of
rela-t i ve ly minor importance 0
Table 1,,1
Numbers of Meat Producing Animals in E.E.C. (1000 head)
1950 1960 1964 1968
Cattle 40,213 48,126 48,522 52,020
Pigs 26,464 33,357 37,979 44,092
Sheep 19,655 18,655 17,881 19,048
Goats 5,032 2,909 2,422 2.036
Horses 5,239 3,178 2,238 1,517
Hens 240,000 302,000 350,000 365,000
Source: Statistique Agricole
Despite a slowdown in the early sixties it can be seen that
numbers of cattle and pigs have increased substantially in the periods
1950-60 and 1960-68. Sheep numbers, after a steady decline, have only
just regained their 1950 level and as would be expected numbers of
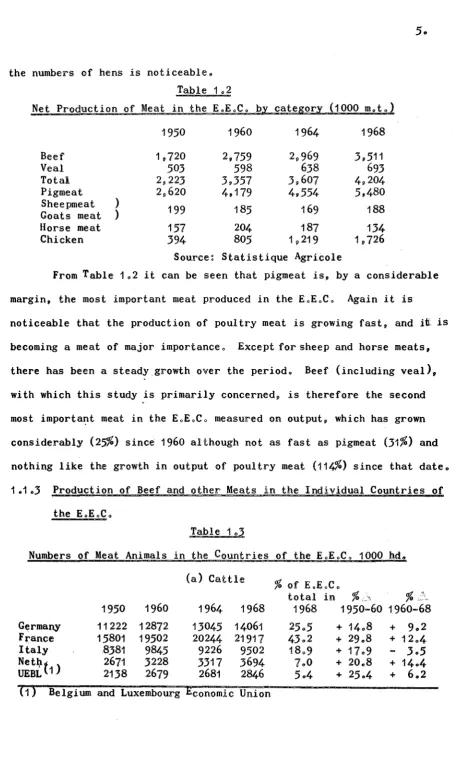
Net Production of Meat in the EoEoCo by category
(1000
mot.)1950
1960
1964
1968
Beef
1
~720
2,759
29969
3,511
Veal
503
598
638
693
Total
2,223
3,357
39 607
4,204
Pigmeat
2
9620
4,179
4,554
5,480
Sheepmeat )
199
185
169
188
Goats meat )
Horse meat
157
204
187
134
Chicken
394
805
1921 9
1
p726
Source~ Statistique Agricole
From Table
1.2
i t can be seen that pigmeat is, by a considerablemargin, the most important meat produced in the EoEoC o Again it is
noticeable that the production of poultry meat is growing fast, and i~ is
becoming a meat of major importance 0 Except for sheep and horse meats,
there has been a steady growth over the periodQ Beef (including veal),
with which this study is primarily concerned, is therefore the second
most importa~t meat in the EoEoCo measured on output, which has grown considerably
(25%)
since1960
although not as fast as pigmeat(31%)
andnothing like the growth in output of poultry meat (114%) since that date ..
1
01.3
Production of Beef and other Meats in the Individual Countries ofthe E.EoCo
Table
103
Numbers of Meat Animals in the Countries of the EoEoC o
1000
hdo(a) Cattle
%
of EoEoCototal in
% .. ,
%
1950
1960
1964
1968
1968
1950-60 1960-68
Germany
11222 12872
1.3045 14061
2505
+1408
+9 .. 2
France15801 19502
202« 21917
4302
+2908
+1204
Italy
8381
9845
9226
9502
1809 +1709
-
3,,5
Net~t )
2671
3228
3317
3694
7.0
+20.,8
+1404
UEBL
1.
2138
2679
2681
2846
5 .. 4
+25.4
+6 .. 2
Germany Fll"'anc:e Italy Netho UEBL Germany France Italy Netho UEBL Germany France Italy Netho UEBL Germany France Italy Netho UEBL
(1) Change
1950
11969
6824
4055
2274
1342
(b)1960
15787
8603
4335
2934
1698
Pigs1964
18146
9043
5409
3525
1856
1968
18732
10584
7298
4861
2617
%
of EoEoCo total in1968
4203
2400
1605
11 01 601
+
32
00+ 2505 + 608
+
2900
+
49
00+
18
06
+
2300
+
68
05
+
6509
+
54
00(c) Poultll"'Y
(1000
hd)1950
1960
48609 60234
85000 103000
75000 90000
15600 32995
15400
15700 .
1950
1960
1651
7510
10142 234118
1036
9863
8231
263 621968
77563 89104
105000 107000
11
0000 11 0000
39196
NoAo14900 14700
1964
1968
841
88217866
28667
830
9564
8206360
88%
of EoE oC 0total in
%
~%
.i~1968
1950=60 1960=68
2406
2900
30
041109
401
+ 2400 +
4705
+ 2102 + 309 + 2000 + 2202
+11002 NoAo
+
109
~301
%
of EoEoCototal in
%
6,
%
1<.').'1968
1950=60
1960~68403
4905
4401
107
00
4
=
307
= 1901 + 2005
+ 505= 1809
+ 1204 +
3607
=
5400
+ 4200SOUll"'ce~ Statistique Agricole
Table 104
Gross Production (Befoll"'e Trade) of Meat in
the EoEoCo Countries (1000 IDotJ
(a) Bed
1950
579
1011291
133137
1960
9391357
456239
212
1964
1090 1400467
236
197
19681206
1648
590
296227
%
@f EoEoCototal in
%
D
%
b.1968
1950=60
1960~6830
044105
1408
705
508+
79
00 + 2805+ 3400 +
2104
+
56
09
+ 2904+ 8100 + 2308
(b) Pigmteat
%
I()f EoEoCo%~
%
l.\
total in
1950 1960 1964 1968 1968 1950=60 1960~68
Germany 1023 1827 2174 2504 4600 + 7800 +3607
France 853 1169 1177 1344-
2406
+37
00
+ 1409Italy 267 417 466 528
9 .. 6
+ 5600 +26 05
Netho 243 449 456 648
1108
+ 8409 +4405
UEBL 203 260 252 423 800 + 28 .. 0 + 6207
Cd
Poultry meat%
I()f EoEoCototal in
%
L.).%6
1950 1960 1964 1968 1968 1950~60 1960~6B
Germany 52 100 142 210 1203 + 9
205
+110 00France 250 394 550
6BO
3805
+5705
+7209
Italy 58 173 310 532
3105
+198 00 +207 00Netho 7 77 128 213 1202 +1000.0 +176,,4
UEBL 27 61 89 91
505
+12600 + 4905(d) Sheep meat (including goatsmeat)
%
of EoEoCototal .i1l1
% '\
W %~1950 1960 1964 1968 1968 1950~60 1960~6B
Germany 136 19 16 11 509
- 4702
= 4201France 100 117 103 116 6200 + 17
-
00B5Italy 50 49 37 37
1908
-
200 = 2405Neth" 10 9 6 9 4,,6 ~ 10 00
UEBL 2 2 1 2 107
SOUlrce~ Statlstique Agricole
Table 105
Percentage of Total Meat Production for each
type in 19689 ~y countr~
Beef Pigmeat Sheep HI())!"se Poultry Others Offalo Total
& Goats Meat Meat
Veal Meat
Germany 2900 5900 003 001 5,,1 0.,7
508
100France 3605 3009
206
1,,2140B
5068
04
100Italy 3407 25 08 200 006
2703
401
505 100Holland 25 .. 2 51 03
O"B
0,,3 17,,8406
100U.E.B.L. 30.8
47 08
004 1 001201
104
605
100EoE.Co 32.3 4204 104 006
1307
300 606 100Tables
103
through 105 show France has the greater number ofcattle
(4302.%
in1968)
and also the largest share of prcd~ction(4105%)
followed by Germany
(2505%
of numbers and3004%
of prod~ction)g Italy1809
and1408.%)p
Netherlands(7
00 and70$%>
and UoEoBoLo{504
and508%)0
Veal production is only important in France9 where it represented 24% of
all beef animal production in
1968
p the Netherlands where it has grown from16%
of all beef animal production in 19509 and 18% in 19609 to 28% in1968
0 (which shows the emphasis put on the veal trade by Dutch farmers)s>and UoEoBoLo where it is around
10%0
The position is reversed with regard to pigmeatp Germany
accounting for nearly half of outputs> while France and Italy dominate
poultry meat productiono Sheep numbers and output are very low~ they are shown here only for comparisono They are concentrated in France and
Italy, but have been declining steadily over the period showno
The figures in the last two columns of tables
103
and104
givethe percentage increase or decrease over the decade
1950-60
9 and the8
years from 1960~680 It should be noted that in1950
all thesecountries were still suffering the effe~ts of the
1939=45
wary whi©h will account for some of the large gains made in the 1950=60 periodoCattle numbers and Beef production rose quickly up until
1960
9 and hasrisen steadily there after = an annual (compound) growth rate of
3%
for France and between 3~ and
4%
for Germanyp Italy and the Nether=lands in output of Beef since
19600
It is noticeable thatp almostwithout exceptionp Beef output rose considerably faster than cattle
numbers - from 1960 to
1968
a decline of305%
in cattle numbers gave anover the period ..
Pigmeat production has, except for France and ItalY9 risen faster
than Beef productiong thus retaining its position as the most important
meat in the EoE.Co; whilst poultry meat production has risen largelyp
doubling between
1950
and1960
(for the E.E.Co as a whole) and doublingagain between
1960
and1968
to reach1307%
of total meat production.The biggest increases have been in Italy, with
207%
from1960
to1968
(acompound growth rate of 17% poao)g Netherlands
17604% 1960=68
(15% poao)pand Germany
110%
1960~68(11%
poao)o Even the lowestp U.E.BoLo grew at a'lnodest"6%
poaoThe decline in sheep numbers and production was almost as dram~ atic as the increase in the importance of poultrY9 only France p the major
producer (62,% of the total EoEoCo production) managed to hold product=
ion steady"
FinallYg from Table
1059
it should be noted that only in Franceand Italy is Beef production greater than pigmeat productiong which in
Germany and the Netherlands accounts for more than half total output ..
102
ConsumptionGermany France Italy Neth .. UoEoB.Lo EoE.C.
Table 106
Consumption of Meat in the EoEoCo
(1000
moto)(a) Beef and Veal
1955/56(1)1959/60
1967/68
878
1048
1349
1249
1224
1472
482
662
1174
188
201
275
198
219
257
2995
3354
4521
%
of EoEoCo total illl1967/68
2908
3206
2600
6
01
505
100
00
( 1 )
In all cases June years.%
D,
1959/60= 1967/68
+
28
05
+
20,,2
+
77
00
+
3609
+ 1703
100
Table 1,,6 (b) Pigmeat
1955/56 1959/60 1967/68
%
of E.E.Co%
~ 1959/60total in
-
1967/681967/68
Germany 1681 1920 2531 48,,0 + 31 .. 8
France 1100 1179 1505 2805 + 27<>5
Italy 336 428 566 10.,7 + 3100
Netho 237 269 363 609 + 3409
U.EGB.Lo 224 237 311 509 + 3101
E.E.C o 3578 4033 5276 10000 + 31 00
(c) Poultry Meat
1955/56 1959/60 1967/68
%
of E.EoC.%
U 1959/60total in - 1967/68
1967/68
Germany 89 217 429 246 + 97,,5
France 310 383 639 3606 + 6700
Italy 81 162 542 3101 + 23400
Netherlands 5 18 65 307 + 26100
UoE.B.L. 40 57 69 400 + 2100
EoE.Co 525 837 1744 10000 + 10900
(d) Sheep meat (including goatsmeat)
1955/56 1959/60 1967/68
%
of EoE.C.%
6
1959/60total in - 1967/68
1967/68
Germany 17 17 13 602
-
2305France 111 115 137 6506 + 17 .. 8
Italy 42 42 51 2404 + 2104
Netherlands 1 5 3 104
-
4000UoEoBoL. 2 4
5
204 + 25.0EoEoCo 173 183 209 10000 + 1402
Source: Statistique Agricole
Table jeZ
Per CaEuto Consumetion of-Meat in the E.E.C. ~kg)
(a) Beef and Veal
1955/56 1959/60 1967/68
%
A 1959/60- 1967/68
Germany 17 .. 0 19 .. 0 2205 + 18,,4
France 28,,0 2609 29 .. 4 + 9 .. 3
Table 107 (a) contd ..
1955/56 1959/60 1967/68
%
A
1959/60- 1967/68
Netherlands 1704 17,,6 21 .. 8 + 2309
UoE.BoL .. 2105 2302 2502 + 8 06
EoEoC" 1802 1906 2404 + 2405
(b) Pigmeat
1955/56 1959/60 1967/68
%
A
1959/60- 1967/68
Germany 32,,5 34,,8 4202 + 2102
France 24,,7 2509 3001 + 16 02
Italy 700 807 1007 + 23 00
Netherlands 2109 2306 2807 + 21 06
UoEoBoLo 2403 2501 3103 + 24 06
EoEoC 0 2108 2306 2804 + 20 .. 3
(c) Poultry meat
1955/56 1959/60 1967/68
%
6
1959/60- 1967/68
Germany 1,,7 4 .. 0 7 .. 2 + 80 00
France 6 .. 9 8 .. 4 1208 + 5204
Italy 1..7 303 1002 + 210 00
Netherlands 0 .. 5 1 06 5 .. 2 + 22500
UoEoBoL. 403 6 .. 0 609 + 1500
EoEoCo 302 409 9 .. 4 + 91 08
(d) Sheepmeat (including goatsmeat)
1955/56 1959/60 1967/68
%
A 1959/60- 1967/68
Germany 003 003 .0 02
-
3303France 2 .. 5 205 208 + 1109
Italy 0,,9 009 009
Netherlands 001 0 .. 5 0.,2 ~ 60 .. 0
UoEoBoLo 0 .. 2 0.,4 005 + 2000
EoEoCo 1 .. 1 1 00 1 .. 1 + 10 .. 0
12 ..
Table 108
PeK"lCtentas:e of Total Meat ConsumEtion fcr each TXEe in
in 1967/68 by Country
Beef Pigmeat Sheep Horse Poultry Others Offal Total
&
glOat Meat Meat meatGermany 29 .. 1 5406 0.,3 001 902 009 5,,8 100 00
France 32 .. 5 3303 3 00 109
1401
506
9,,6 10000Italy 4503 2109 200 105 20.,9 303 501 100,,0 Netho 3503 46,,5 004 208 80
3
607 100,,0UoEeBoL~ 33,,9 42,,0 007 4,,2
903
106
803
10000EoEoCo
3401
39,,7 1.,6 104 13,,1 3 00 701 100,,0Source: Statistique Agricole
On a tonnage basis the consumption cf beef has made, as would
be expected from the trends in production, a steady gain over the
period considered, particularly in Italy, the Netherlands and Germany"
However it is more important to consider the per caputo figures which
allow for increases in populationo Measured in these terms consumption,
during the period from 1959/60 to 1967/689 increased from 19 06 kg/hd to
2404
kg/hd, or 24 ..5%
(a compound growth rate of nearly 3% POa.,) Thelonges.t contributing factor for this change was a large increase in Beef
consumption in Italy, where there was a rise of
6508%
(9%
poao) overthe periodp representing an absolute increase in consumption of 5129000 metric tons in 8 years 0 The French are the EoEoCo's biggest consumers
of beef, both on a tonnage and a per caput basis, followed by Germany,
Italy, Netherlands and U.EoBoLo (tonnage) or UoEoBoLo9 Germany 9 Italy
and Netherlands (per caput), in that ordero
Except for Italy, more pigmeat than beef was consumed per head
in all E.EoC o countries in 1967/68p although this was the first year
l'
slower for the whole E.EoC. - ~ poa. for
1959/60
to1967/680
In1967/68
pigmeat represented3907.%
of total consumption in the E.EoCo 9and Beef 3401%0
During the period
1959/60
to1967/68
poultry meat increasedgreatly its share of the market~ from 80
7%
to1301%9
representing anannual growth rate of nearly
9%
or an increase in amount consumed of9079000
metric tons (more than doubling the1959/60
figure)o Allcountries except U.E.BoL. contributed to this massive increaseg with
ItalY9 where poultry now accounts for over 20% of consumptiong showing
the greatest increaseo
Sheep meat is of minor significance, exhibiting wide fluctuat=
ions within its limited range. It is interesting to note from Table
1.8
that Horse=meat has almost as great a share of the market
(104%
to 106%)
and is much more important in two areas = U.EoBoLo and the Netherlands.
103 Trade
The E"EoCo is a net importer of all the major types of meat, andv
as Table 109 showsp has tended to be increasingly less self=sufficient
over the last fifteen yearso
Table
10'
Degree of Self-sufficiency of EoEoCo in Meat
1955/56
1959/60
1966/67
All Meat
97,,9
950)
9201Beef and Veal
9507
93008702
Pigmeat
101
06
100,,0
98
02
Poultry meat
9701
90
02
9707
Source~ Statistique Agricole
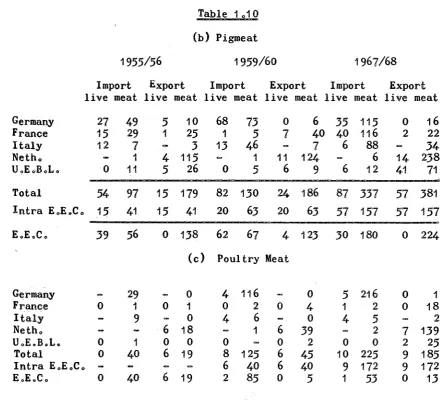
140
pigmeatg
203%
of its poultry meatp org nearly8.%
of the total quantityconsumed
0
When it is remembered that in1966/67 12036
million metrictons of meat were consumed in the EoEoCo9 it can be seen that trade in
meat is very importanto
Table 1010
Trade in Meat, by country and by Classg in the EoEoC o (1000 moto)
(a) Beef and Veal
1955/56
1959/60
1967/68
Import Export Import Export Import Export live meat live meat live meat live meat live meat live meat
Germany France Italy Netho UoEoBoLo
94 44
o
118
53
7
11
2
9
Total 121 118
Intra EoEoCo
12
24
10994 203
4
1 101062
5
53
0 34o
62 145
2 29 10
19
1 3 1 13
12
12
96 173 273
24
28
89
o
72 145 184
72
329
4
38
40157
23
57
033
2 186 310
1
51
12
56
2
8
27
45
14
2926 132
o
3
2 88
5
33
30 156 265
60147 285
28
89
43217
43217
2
67 222 884
69
6064 68
72
Trade in Beef and Veal in the EoEoC o is characterized by the large
numbers of live animals involvedo Table 1010(a) gives a breakdown of
trade by country for both live animals and meat for the June years
1955/56
p 1959/60 and1967/680
Total imports and exports for bothclasses are broken down in the last two rows into intra EoEoC o trade,
and that with third countrieso As the Table showsg there are some
,rather clear cut divisionso Italy and Germany are both large net
im-porters of Beef and Vealp with Belgium becoming an important importerg while France and the Netherlands are net exporterso Italy has
-In
1955/56
more Beef and Veal was imported as live animalspbut by
1959/60
meat was predominantp and the trend has continuedpalthough large numbers of live animals
(3229000
mto of meat equivalentin
1967/68)
still cross the frontierso Although intra=EoEoC" trade in=creased considerably during the period -
225%
between1955/56
and1959/60
and 122% between
1959/60
and1967/68
= imports from outside the E.E.Coalso showed gains of
63%
for the period1955/56
=1959/60
and84%
for1959/60
=1967/68
9 up to a total of606poo
metric tons in1967/68
0Exports were static over the periodo
Table
1010
(b) Pigmeat
1955/56
1959/60
1967/68
Import Export Import Export Import Export live meat live meat live meat live meat live meat live meat
Germany France Italy Netno U.Eo,BoL. Total
27
49
15
29
12
7
1
o
1154
Intra EoE.Co 15
97
41
39
56
Germany
France 0
Italy Netho
UoE.BoL$ 0
Total 0
Intra EoEoC"
-EoEoCo 0
29
1 9 140
40
5
10
1
25
34
1155
26
15 179
15
41
68
73
1 5
13
46
1
o
5
82 130
20
63
o
6
35 115
7
40 40 116
7 6
88
11 124
6
6 9 6 12
24
186
20
63
87 337
57 157
o
138
62
67
4
123
30 180
(c) Poultry Meat
o
o
1o
6
18
o
06 19
6 19
4
116
0o
2 0 44 6 0
1
6
39
o
0 28 125
6
45
6
40
6
40
2
85
0
5
5
216
1 2
4 5
2
o
010 225
9 172
1
53
o
16
2 22
34
14 238
41
71
57 381
57 157
o
224o
1o
18
2
7 139
2
25
9 185
9
172
(d) Sheepmeat (including goats meat)
Germany 1 3 1 1 0 0 0
4
1 1Franc~ 6 6 0 0 0
4
2 14
16 0 0Italy 0 0 0 0 2 0
7
5
0Netho 0
4
0 0 6 0 1 07
UoEoBoLo 0 0 0 0 0 2 0 0 1 3 0 1
Total 6 7 3
5
0 9 2 7 12 29 1 9Intra EoEoC. 0
4
04
0 6 0 6 1 9 1 9EoEoCo 6 3 3 1 0 3 2 1 11 20 0 0
Table 1010 (b) shows that pigmeat trade both intra and extra
EoEoCo has increased considerably over the period. Germany and France
becoming quite large importers, and the Netherlands more than doubling
her exportso
Germany and the Netherlands account for almost all of the
poultry=meat trade. Since 1959/60 Germany has increased her exports of
poultry=meat 100pOOOmetric tons to 216poOO m.t.p and the Netherlands
has increased its exports by a similar quantity to 1399000 metric tonso
In both pig~meat and poultry~meatp the live animal trade is relatively unimportant.
Sheep meat trade is once again given only for comparative pur=
poses. Th~ tradep particularly extra~E.E.C. tradep has in fact grown
considerably over the period (bearing in mind its low base level)p
France and Germany and Italy doing some importingv with the Nether=
lands the only exporter of any (relative) size. The imports from out~
side the E.E.C. come from the U.K. and Eastern Canada (live animals) and
for meat from Ireland, Argentine, Englandp Yugoslavia, New Zealand and
Bulgaria in that order o
10301 Detailed Analxsis of Imports and Exports of Beef and Veal for 1968
Beef and Veal trade in the EoEoC.g by further breaking down the trade
by country of origin and class of meat for the year 19680 These are
given in Table 10110 As only major suppliers (or recipients) are shown
(ioeo those involving quantities greater than 1000 mto) the sub-totals
and totals given will not necessarily agreeo
Table 1011
1968 Imports and Exports of Beef and Veal? by
Country of Origin and Type of Meat
Origin France U.EoBoL o Netho Germany EoEoCo Ireland Austria Yugoslav Eo Germany
Poland Czechoslo
Hungary Roumania Bulgaria extra E oE oC"
France Germany
EoEoCo
14 .. 9
7
08
3 .. 0 2504
5101 102
6
05
11 .. 1 206 801
4
06
303 202 404 4502 2500 207. in.tra EoEoC028 02 Denmark 307 Austria 108 Czechoslo
708
Hungary 2503 extra EEC 4006
France
009 003
1,,2
Imports (1000 moto)
(i) Calves
U"E"BoL o Netho 1 01
100 1 ,,1
0.,3 0 04
206 105
003 Germany 207 0 09 306 0 09 002
(ii) Bulls9 non reproductive
206 00
7
206
102 108 0 07
100 001 0 01
0 02
505 703 1204
001 8 08 906 1303
Italy
1306 302 00
6
2407 4202
6
03
1101 206 801
405 :l~3 202 404 4205 2107 207
2408
005
7
06180
(iii) Cows (non-breeding)
Origin EoEoC .. France UeE.BoLe Netho Germany Italy
FranICe 1301 1205 001 002 003
DoE.BoLo 201 1.9 001
;ll.llltlra EEC
16 09
007 1206 200 006 1 00Ireland
301
104107
Dlenmrurk 69 08 605 5 .. 5 57 .. 8
Austria 13 .. 7 007 103 509
506
Yugoslav 1.9 108
HungalrY 10,,6 200 302 503
Rumania 402 2,,0 102 0 09
extlra EEC 10503 0 07 1308 1202 6902 9,,4
(iv) Other beef animals
France 3809 601 002 32,,6
UoEoB.Lo 109 006 005 008
Netho 5 .. 2 209 0.2 0.1 109
Germany 8.0 002 7,,7
intra EEC 5400 3.2 603 002 0 08 4300
Denmark 1.6 0.7 006 0.,2
Austria 2203 0 .. 1 2,,3 1909
Yugoslav 1505 1504
Eo Germany 21 06 2106
Poland 2502
2502
Czechoslo 1609
16 09
Hungary
5506
007 200 5008Rumania 1404 0.3 0.2
1309
Bulgaria 1202 1202
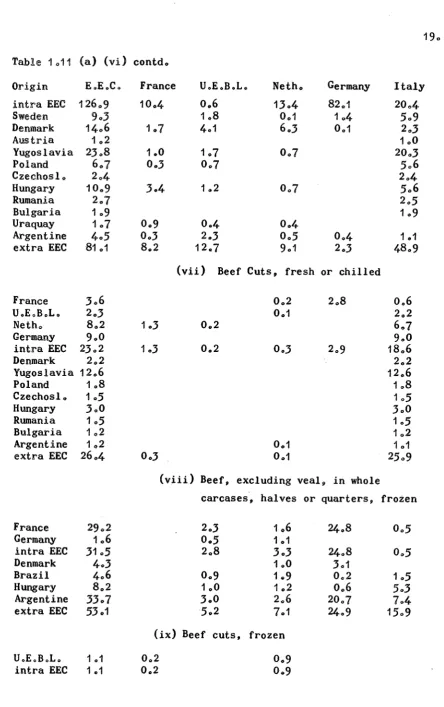
Extra EEe 18401 109 4 08 17608
(v) Vealg Fresh or chilled
France 7.3 5.7
106
Neth .. 60.7 208 107
2308
3203
intra EEe
6901
301 107 29 083405
Denmark 4502 003 2,,0 0.,8 402
3808
Yugoslav
403
003309
Czechoslo 500 003 4 .. 6
Rumania 3.5 003 302
Bulgaria 104 104
extra EEe 6003 007 2 .. 1 0 .. 8 409 51.8
(vi) Beef, excluding vealp in whole carcasses, halves or quarters, fresh or chilled.
France 90 02
5 .. 7
75.7 8.7UoEoBoL. 13 .. 3 003 7 .. 7 400
102
Netho 607
106
004 200 207Table 1011 (a) (vi) contdo
Origin E.EoC. France U.EoBoLo Neth o Germany Italy
intra EEC 12609 10 .. 4 0 .. 6 1.3.4 82 01 2004
Sweden
9.3
1 .. 8 0.1 1.4 509Denmark 1406 1.7 4,,1 6 0.3 0 .. 1 2 .. .3
Austria 102 1 00
Yugoslavia 2.3,,8 1.0 107 007 20 0.3
Poland 60
7
0".3 0 .. 75
06
Czechosl .. 204 204
Hungary 10.,9 .304 1 .. 2 0 07 506
Rumania 207 205
Bulgaria 1 09 109
Uraquay 107 0 09 0 04 0.4
Argentine 405 0 0.3 20.3 0,,5 0 04 1 .. 1
extra EEC 81 01 8 .. 2 12 .. 7 901 2 .. .3 48 09
(vii) Beef Cuts, fresh or chilled
France .306 0 02 208 0 .. 6
UoEoBoLo 20.3 0.1 202
Neth" 8,,2 1 • .3 0.2 6 ..
7
Germany 900 9,,0
intra EEC 2.3 .. 2 1 .. .3 0 02 00.3 209 1806
Denmark 2 .. 2 2,,2
Yugoslavia 1206 12 .. 6
Poland 108 108
Czechoslo 105 105
Hungary .300 .3 .. 0
Rumania 105 105
Bulgaria 102 102
Argentine 1 .. 2 0 01 101
extra EEC 2604 0 0.3 0.1 2509
(viii ) Beef, excluding veal,., in whole
carcases, halves or quarters, frozen
France 2902 20.3 1 .. 6 2408 0 05
Germany 1 06 0 05 1.1
intra EEC .3105 2,,8 .30.3 2408 005
Denmark 4 .. .3 1 00 .3 .. 1
Brazil 4 06 0.9 1 .. 9 0 .. 2 105
Hungary 8 02 1 00 1.2 0 06 503
Argentine .3.307 .3.0 206 2007 704
extra EEC 5.3 01 502 701 2409 1509
(Ix) Beef cuts, frozen
UoEoBoL. 1 .. 1 0 02 0,,9
20.
Table 1,,11 (a) (ix) contdo
Origin E.E.C. France U.E.B.L. Neth. Germany Italy
Rumania 7.7 707
Madagascar 102 102
Brazil
709
200 102 407Hungary 401 004 004 108 105
Argentine 4507
6
08 803 1303 1702extra EEC 6905 808 1007 16.4 0.5 3301
Source: Commerce exterieur: Tableaux analytiques
(Nimexe), Volume A = Produits agricoles
Column 1 gives the country of origin, column 2 gives the
total imports by the EoEoC. from that country, while columns 3 = 7 show
how much of this went to each individual country of the EoEoCo Nine
classes are represented, four for live animals = calves, steers, cows and
others - and five for meat ~ fresh and chilled veal, fresh and chilled beef (both carcass and cuts), and frozen beef (carcass and cuts).
The trade in calves, which amounts to 18.% of the live
animal trade, is almost totally directed into Italy. France and Germany
are the only major exporters within the E.E.C.p and they sell the bulk
of their calves to Italy. Apart from Austria (and to a limited extent
Ireland) all extra E.E.C. imports come from the East European communist
countries, especially Yugoslavia and Polandp exporting to Italyo The only major exporter within the EoE.C. of non-breeding
bulls (13% of live trade) is France, again selling mainly to Italy, but
UeE.BeLop the Netherlands, Germany, and Italy all buy similar quantities from outside the E.E.C., most of it from Hungary and Czeckoslavakia with
Denmark and Austria supplying smaller amounts.
Non-breeding cows, which surprisingly account for 23% of
mark is the major exporter to the EoE.Cop selling mainly to Germany
(579800 out of 699800 mit. in 1968) with UoEoBoLo and the Netherlands
accepting smaller amounts o Austria and Hungary also supply some cowsp
mainly to Germanyo
The fourth live animal category given includes all other
classes not previously included (ioe. steers of various ages) and the
table shows that Italy is again the major marketg only minor quantities
going to any of the other four areas. France is the only importer
within the EoE.Co and East Europe plus Austria account for most of Italy's
extra EoEoCo imports; especially Hungary~ Poland and East Ger'manyo
Trade in fresh or' chilled veal, almost a quarter of the total
meat tradeg is dominated by two countries, the Netherlands and
Den-mark. In 1968 the Netherlands sold large quantities to Italy and Ger=
manyp while Denmark sold mainly to Italy with smaller amounts to
Germany 0
The most important class of beef in terms of trade is fresh or
chilled carcases of beefp accounting for
38%
of the total meat trade. The most important supplier within the EoEoCo is Franceg selling mostto Germanyo Extra=EoEoCo h'ade in this class is less important; with
Eastern Europe and Denmark supplying mosto Fr'esh or chilled cuts are
not important (only
9%
of trade in 1968) Yugoslavia being the onlynotable supplier in 19680
Frozen beefp in carcasses and cuts, represented 28% of the
total meat trade in 19680 Apart from Franceg the main suppliers were
outside the EoE oCo9 South America being particularly importanto
France sold only carcass meatg mainly to Germa~p Awgentine and Uraguay
22"
and Germany9 and cuts to ItalY9 the Netherlands, UoEoBoL o and Franceo
In summarY9 using 1968 as a typical year, the principal
ex-porters of live animals to the EoE.Co are Denmark, Austria and the
Eastern European countries especially Yugoslavia9 Hungary and
Czeckeslovakia. Denmark dominates the veal trade and shares the
chilled meat trade with Eastern Europeo Frozen meat imports are mostly
from South Americap particularly Argentine and Uraguayo The main
recipient is Italyg with Germany also receiving substantial quantities.
U.EoB.Lo is also a net importer, France and the Netherlands are net
exportersp but receive lesser quantities of meatp both chilled and
frozen.
Within the EoE.C.s France and the Netherlands (especially in
the case of veal) do most of the selling, and Italy and Germany most
of the buyingo
104 EoEoCo Market Regulations for Beef and Veal o
Although it is not within the scope of this study to examine
quantitatively the effects of the EoE.C. common agricultural policy
and its associated trade regulations, on the production, trade and
consumption of Beef and Veal within the areap a brief description is
included so that they may be borne in mind during the analysis to
follow ..
1.4.1 Brief History of the Common Agricultural Poiicy
The Tr.eatyof Rome was signed in 1957 and its Agricultural
Policy was implemented from the 1 January 1959 with the aim of
tween member countriesp the gradual introduction of a common customs
tariff, the abolition of quantitative restrictions between member
statesp co=ordination in improvement of agricultural structure and the
establishment of common price levelso
So that the attainment of common prices for commodities would not
disrupt unduly the internal markets of members a system of "variable
levies" was adopted; in which an amount is levied which will
compen-sate for the difference between the price ruling in the member country
and the price on the world market, or the price of another member
countryc During this t.ransitional period prices are equalizedp thus
dispensing with the levies in intra=community tradep and leaving
uni-form levies on imports from third countrieso Prices are equalized by
the setting of "target" pricesp which set levels for national prices to
aim forg and which leadg over the transitional period to unificationo
Howeverp these ittargets~1 may not be easily attained, and so "threshold"
prices were set at a percentage of the target price, usually based on
market conditions9 and the amount of protection required for the
commodity = they are the practical steps in attaining the goal which is
eventually complete unificationo
An "interventionl
! plrice is also set at some percentage of the
threshold price (or target price)p usually 90=95%p at which approved
purchasing agencies enter and support the markeio
Imports from third countries (and at first intrao EeEoCo trade)
are subject to variable levies which make up the difference between the
on the basis of the best overseas terms available) and the threshold
pric~ (o~ the guide price after achievement of unification)~ Howeverg
if the internal price rises too high the levy is not appliedp and
cheaper imports may enter the countryo
"Export restitutions" can be made to "enable the EoEDCo
countries to meet competition, either on the world market or on the
markets of other E.E.Co countrieso" These restitutions are simply an
export subsidy ..
Finance is handled by the European Agricultural Guidance and
Guarantee Fund (E.A.GoG.Fo) the Guarantee section of which finances the
common organisation of marketsg restitution on exports and intervention
on domestic markets; while the Guidance Section can finance with capital
grants any approved project which seeks to improve the structure of
agriculture in a member country; especially in its backward regions.
Originally an arbitrary scale was laid down to decide who
contributed what to the fundp but this has been gradually replaced by
a scale based on the net imports of member nationso
Table 1012
Percentase of Contribution to Fund
1965/66 1966/67
Belgium
7095
7095
Germany 31~67 30083
France 32058 29026
Italy 18 000 22000
Luxembourg 0022 0022
Table 101:2
EoA.G.G.F. Expenditure during 1st Three Financial Yealrs
jn 1000 Units of Account
(UoS.
$)
Guarantee Section 1962/63 1963/64 1964/65
Ao Restitutions on exports
to 3lrd countries ..
Cereals 21,496 419990 1129208
Pigmeat 50 19710 71)665
Eggs 551 968 15)210
Poultry 164 700 19 250
Dairy Products 179 867
Rice 769
Total A 2211 261 45,368 1409969
Bo Intervention on
home market ..
39241 39 267 711196
Dairy Products 79350
Other 39 220 59 625 711410
-Total B 6p461 89892 2111956
Total for Gualrantee Section 28,722 549 260 1629925
. Guidance Section 91)574 189087 549308
Grand Total 38p296 729347 21711233
This was allocated to members as followso (1000 VoA.p
260
Table 1014
1962/63 1963/64 1964/65
Germany 1790 (603) 2637(407) 8896(4)
Belgium 305 (1 QO) 382(0 06) 1974( 1,,4)
France 24479(86) 45569(85) 122014(67)
Italy 1281(302) 705(103) 5211(606)
Luxembourg 3
5
15Netherlands 864(303) 4962(7,,4) 2481 (21 )
28722 54260 162925
It is interesting to compare the above percentages with those of
Table 10120
10402 Regulations for Beef and Veal
Beef and Veal (which includes live non-breeding cattle~ fresh,
chilledp frozeng dried9 smoked, plus offal and fat) became financed
under C.AoPo on the 29th July, 19680 Member countries ,keep 10% of the
levy revenue plus the receipts from customs duties, 90% of the levies
go to E.AoGoGoFG which pays the cost of intervention and export
resti-tutiono
For Beef and veal, a "guide" price replaced the usual target
priceo It is not tied to the price of feed grains, as other live stock
product target prices are, but is the price whichg it is considered,
producers ought to get under normal marketconditionso The guide price
for cattle and calves is fixed before the 1st October each year, taking
into account production and consumption trendsg and the milk and dairy
product situation ..
The other two components of the price system are the (EoEoCo)
support system is describedo
(a) Market Price: This is a single price constructed from weekly
recordings of market prices throughout the Communityo For each
indi-vidual country with more than one representative market the prices are
averaged arithmetically and then the country averages are weighted
according to the following proportions to produce a single EoEoCo
Market priceo
%
Belgium 502
Germany
2705
France 4008
Italy 1809
Netherlands 703
Luxembourg 003
10000
These weights are based on productiono
(b) Import Priceg Weekly prices for fat cattle in Austriap Denmarkg
England and Ireland are used to calculate the import priceo This is
done using the following weights:
%
Austria 15
Denmark 50
England
&
Wales 25Ireland 10
An adjustment is then made to take account of transport costs o
The import price for calves is calculated with reference to
the Danish market onlyo
CoAoPo acts in two ways to ensure that the producer price
stays as close as possible to the guide priceo
(i) . Interventiono. When the malrketprice falls below 98% of the
guide price member states may intervene (buy) at their discretion per
medium of national agencieso Intervention is compulsory when the
market price falls below 9.3% of the guide priceo Intelrvention does not
apply to calves or veal 0
(ii) Protection against Importso This is done by a combination of
customs duty and a variable levyo The duty is permanently applied on
an ad valorem basis as
follows:-16% for live animalsg
20% for meat and edible offalsg fresh chilled or frozenp
24%
for meat and edible offals~ salted in brineg dried orsmokedg
26% for other preparations of meat or offalg
8o~ for fatsg rendered or on renderedo
The levy is the difference, fOIr each weekg between the impolrt
price, plus the ad valorem dutY9 and the Community guide priceo The
levy is not always applied in full - the rate of application depends on
the relationship between the guide price set for that particular year
and actual price prevailing at the time ~ the market price ~ according to the
market price 1 02-1 04% guide price = ~ levy
market price 104=106% guide price
- 34
levymarket price :~ 106% guide price - no levy
This system gives adequate (price) protection when prices are
low (and quantity~ presumablyp high) but allows beef and veal to enter
with only the duty to overcome when prices are high within the
Community 0
Meat is subject to the same basic regulations as the live
animalsg except for frozen meat which was recognized as having rather
different market relationshipso
Beef and vealp other than frozenp are first subject to an ad
valorem duty of 20% and then a levyp which is proportionate to the
levy applied to calves and fat cattle at that time (the duty is 24%
if the meat is driedp smokedg salted or in brine)o The coefficientsg
which represent the normal relationship between the fat cattle or
calf prices and the appropriate meat price, are listed below:
Product
(a) of calves
1 0
20
Carcasses or sides
Forequarters, joined or separated
Hindquarters p joined or separated
(b) of fat cattle
1 0
20
Carcasses, sides or paired quarters
Forequarters
Hindquarters
Product
(c) Other forms of 'meat from calves or fat cattle
1 • Un~boned pieces Boned pieces
(d) Edible meat from domestic bovine animals, salted or
in brinep dried or smokedg
1 • Un-boned
Boned
Coefficient
2.85
3.40
Frozen beef was recognized as different largely because the
markets used to calculate the import price for fat cattleg which in
turn was used to calculate, by the coefficients above, the levies on
fresh, chilled or preserved meat, namely the markets of Austria,
Denmark, England and Ireland, bore little relation to prices in markets
of the main source of frozen meat - South America. The position was
further complicated by the need to ensure adequate supplies for the
food processing industries of the Communityo After the application
of the duty (20%) a levy is imposed which represents the difference
between the guide price, multiplied by a coefficient derived from the
ratio between the price of fresh beef of comparable type and the fat
cattle price, and the "world" price for frozen beef. The world price
is one which is representative of the market in the exporting
countries, and for the same quality of beef as that offered on the
world market. Depending on the conditions prevailing, the levy on meat
destined for processing industry can be wholly or partly suspended at
the discretion of the Commission. To qualify manufacturers must
guaran-tee that the imported beef will be used solely for processed meat, and
A REVIEW OF SOME PREVIOUS ECONOMETRIC ANALYSES OF DEMAND FOR
BEEF~ WITH PARTICULAR REFERENCE TO THE E.E.C. COUNTRIES
In this chapter, previous econometric studies are reviewed as
a basis of comparison for the analysis to followo This is by no means
an exhaustive list, the main limitation being availability in New
Zealand.
2.1 A. Weber (1) (1960)
As part of a comprehensive study of the EoE.Co meat market
Weber estimated demand elasticities for beef~ veal and pigmeat for
the five main European countrieso For all the estimates he used a
relationship of the form:=
C
=
per caput consumption of the particular meatP1~ P
2
=
deflated retail price of beef or veal and pigmeat Y=
per caput meat income.The equations were estimated in double log form = for two
reasonsg one technical (ioeo it was easier) and because no flattening
(1) Weber A: Structurund Dynamik des Fleischverbrauchs in den Landern der Europaischen Wirt$chafts gemeinschaftp
of the demand curve had been observed = the time period was from
1950 to 1958 using annual observations.
The analysis had many defectsp readily admitted by Weber, but
is the most comprehensive available and made much of the limited
inform-ation available. Because of the low number of observinform-ations (n
=
9)standard errors are not calculated, but the figures given are a
judge-ment of the allowability of the estimates.
~
Many of Weber's problems revolved around the data, especially
because the period studied, 1950-58, was a recovery period for the area
from the rigours of war.
(a) Income. Weber rejected the usual source, Gross or Net National
Product, because of the influence of fluctuating levels of investmentp
and used instead estimates of private consumption per caput in constant
(1964) priceso On this basis he found income increased more sharply
1950-58 in Germany, with increases average in France and Italy, and low
in Belgium and Holland. The elasticities obtained using this method
were found to be significant enough.
(b) Pricese Acceptable data for prices was found to be much more
difficult to obtain than for income. Representative prices
(i.e.
theretail price of a certain cut is taken as typical and therefore
re-presentative of price trends for the meat group as a whole) and
weighted averages were considered, but lack of good data caused many
estimates to be non-significant.
(c) Consumption. No country gave a breakdown of consumption into