Sprinkled Heat Exchangers in Evaporation Mode
P. Kracik1, L. Snajdarek1 and J. Pospisil1
1
Institute of Power Engineering, Brno University of Technology, Faculty of Mechanical Engineering, Technická 2896/2, 616 69 Brno, The Czech Republic
Abstract. The paper presents research on the heat transfer at sprinkled tube bundles situated in a test chamber at atmospheric pressure and low-pressure. Dynamic effects of physical quantities influencing the heat transfer coefficient during boiling are examined experimentally. Experimental results were achieved by means of balance measuring using thermocouple probes and by analysis of thermal diagrams created during operation periods.
1 Introduction
The increasing human emphasis on the comfort of the environment where people live, work and relax dynamically affects the development of coolness consumption. Coolness is also an indispensable aspect in the food, chemical or engineering industries. There are two predominant technologies of coolness production. The first method utilizes compressor cooling devices which are, however, very heavy on electric power. Absorption circulation represents their feasible alternative. Although being larger and more expensive, it consumes approximately one fifth of the electric power. With absorption unit, the energy is supplied into the cycle in the form of heat by either direct combustion of fuel in the absorption unit (typically carried out by gas burners) or indirectly from any heat carrying agent of suitable temperature (for instance with steam from heating power stations where it is no longer technically favourable or economical to expand it in a turbine or from solar collectors). The only rotary component in the absorption circulation is a circulating pump (or multiple pumps, depending on the connection type), where no special requirements are made unlike in the case of a compressor in a compressor cooling device.
The basic element of a single-stage absorption circulation consists of two exchangers operating in a low-pressure environment – the absorber and the desorber. The heat carrying agent's steam is cooled in the absorber, absorbed into an absorbent; excess heat must be conducted away properly. In a simplified way, it is a sprinkled exchanger on the surface of which the water steam condensates. The primary heat is supplied to the cycle in desorber, so the heat is provided to the sprinkled liquid and water boils on the tubes' surface. The article focuses on these processes.
2 Sprinkle Mode Theory
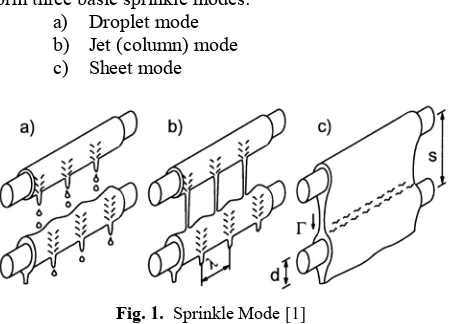
The water flowing on the horizontal tube bundle may form three basic sprinkle modes:
a) Droplet mode b) Jet (column) mode c) Sheet mode
Fig Sprinkle Mode>@
These modes are depicted in figure 1. The transition from the Droplet and Jet mode is defined by at least one stable water column in between the droplets. The transition from the Jet and Sheet mode is defined by the columns' connections and their creation of small triangular sheets. In this mode, columns and sheets exist side by side.
These modes were described mathematically for various liquids at atmospheric pressure and stable artificial environmental conditions by e.g. R. Armbruster, J. Mitrovic (1998) [1] or G. Ribatski and A. Jacobi (2005) [2]. They related the measured values to criterial equations of heat transfer theory, i.e. to the criterion of water motion caused by gravitation (Galileo number which is a reciprocal of "Kapitsa number")
1
∙ σ∙ ρ
1
This is an Open Access article distributed under the terms of the Creative Commons Attribution License 2 0 , which . permits unrestricted use, distributi and reproduction in any medium, provided the original work is properly cited.
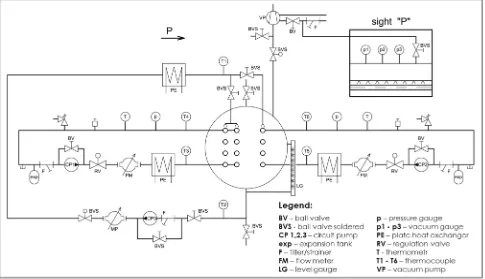
Fig. 2The low-pressure stand connection diagram
and hydrodynamic flow mode (Reynolds number)
∙ 2
where "A" and "n" are coefficients of various measured liquids in sources mentioned above, "σ" surface tension, "η" dynamic viscosity and "ρ" density. Reynolds number can also be calculated from the total mass flow ("Γ") related to one meter of the length of the sprinkled tube.
4 ∙ Γ
3
The calculation of the heat transfer coefficient in this paper is based on the balance according to the law of conservation of energy, the Newton's law of heat transfer and the Fourier's law of heat conduction.
3 Test Apparatus
For the purposes of examination of the heat transfer at sprinkled tube bundles a test apparatus has been constructed; see the diagram at figure 2. The tube bundle at which both boiling and condensation can be simulated is placed in a vessel where low-pressure is created by an exhauster through an ejector.
The low-pressure stand chamber is a cylindrical vessel of 1.2 m length with three apertures in which the tube bundle of the examined length 940 mm is inserted. Three closed loops are connected to the chamber. The two side loops are designed for overpressure up to 1.0 MPa and function as cooling/heating liquid conveyors. The third (middle) loop functions as sprinkling liquid conveyor. There is a pump, a governing valve, a flow rate meter and a plate exchanger attached to each loop. The
plate exchanger can be connected to a boiler or gas boiler with hot water designated for liquid heating-up or cooling water in case of cooling. Besides, expansion vessels and safety and vent valves are fixed to the overpressure loops. In order to enable visual control the loops also include a manometer and a thermometer.
The thermal status in individual loops is measured by wrapped earthed T-type thermocouples on the input and output of agents from the vessel. In order to approximate the spread of heat in the tube bundle, two thermocouples are placed inside each loop. The situation inside of the vessel is monitored by two thermocouples; the first one located directly below the surface of the liquid collected at the lower part of the chamber monitors the temperature of the sprinkling liquid and the second one monitors the inside chamber environment above the tube bundle. The
fitting plate of the tube bundles is divided into two halves with apertures of various spans drilled into each of them enabling thus a high variability of the tubes' arrangement. The tube bundle consists of copper tubes of the 12 mm diameter. The distribution tube located above the tube bundle has apertures of the 1.0 mm diameter with the 9.2 mm span along the length of 940 mm.
There are three vacuum gauges measuring the low-pressure. The first vacuum gauge is designed for visual control and it is a mercury meter, the second one is digital and enables measuring within the whole desired low-pressure range, but it is less accurate with lower low-pressure values. In order to achieve accurate measuring within the low range in between 2.0 kPa and 0 Pa, the third digital vacuum gauge is used.
)LJTime chart of the "sprinkling liquid flow rate alteration"
)LJ4Projection of temperatures and heat transfer coefficient dependent on sprinkling liquid flow rate
transducers scanned by measuring cards DAQ 56 with the scan frequency of 0.703 Hz.
4 Experiment
The objective of the experiment described in this paper was to evaluate the effects of dynamic alterations of two physical quantities influencing the heat transfer coefficient at the outer tube surface in the evaporation mode, i.e. in the mode when hot water flows inside the tubes from the lower part of the bundle upwards and is cooled by the sprinkling liquid. The first monitored and altered variable is the sprinkling liquid flow rate and the second altered variable is the absolute pressure in the chamber. Both types of the experiment have been carried out at the right loop of the tube bundle where there are seven smooth tubes (including the distribution one) with
the 25 mm span in two rows shifted by 10 mm. However, the calculation takes into account one row only as the flow rate is undivided and gradual from the bottom upwards.
4.1 The Sprinkling Liquid Flow Rate Alteration
)LJ6Time chart of the "chamber pressure alteration"
The temperature and the sprinkling liquid volume flow are shown at the left vertical axis while the right vertical axis represents the heat transfer coefficient at the outer surface of the tube. Looking at the shape of the sprinkling liquid flow rate curve and the heat transfer coefficient curve, a certain time lag is evident. This lag is caused among other factors by the increasing amount of water in the distribution tube and also by the evaporation and steam release from the vessel during the first drops' falling in the upper part of the bundle, which is also evident from the temperature 6 (thermocouple at the output from the tube bundle). Between the 18th and 25th second the desired temperature was stabilized (5) at the input into the tube bundle.
Projecting the values in relation to the sprinkling liquid flow rate at figure 4 makes the observation more interesting. The bottom horizontal axis represents the volume flow rate of liquid inside the loop and relates to temperatures (going with the left vertical axis) and the diagram's top horizontal axis (the same flow rate, but in a different scale) relates to the heat transfer coefficient (going with the right vertical axis). The heat transfer coefficient slowly rises when the desired flow rate is being gradually approached. When the flow rate is achieved, there is an increase and a slow stabilization and with the rapid decrease there is a gradual fall corresponding with the trend, with a certain degree of inaccuracy compared to the stably measured points.
As mentioned in the introduction to this chapter, the vessel was not completely closed and the generated steam escaped freely through the middle look-through neck where the thermal imaging camera FLIR SC 660 was fixed. The whole sprinkling sequence was recorded with the resolution of 640x420 pixels and the frequency of 30 Hz. The analysis of the sequence can be found in figure 5. The top section of the figure depicts the waveform of temperatures scanned in seven points (marked with letters "a" to "g") during the sprinkling start-up and the beginning of the thermal gradient stabilization, i.e. approx. the first 38 seconds. The first point is situated in the area of the sprinkling liquid's outlet from the distribution tube and the other points are situated at the front part of the tube bundle successively from the top to the bottom. All the points are marked at
the images below the diagram which were extracted from the sequence record. These images also show the expanding steam cushion that was progressively getting larger. There are also three straight lines (marked with numbers "1" to "3") where the temperature was scanned along their whole length, which also represents the total length of the "x" axis in the diagrams below the images where the temperature is depicted in relation to the particular time duration specified at the legend.
4.2 Chamber Pressure Alteration
generated steam transferred its heat to the sprinkling liquid as well which caused the heat transfer coefficient's increase. After the vessel had been closed, the absolute pressure inside increased by 0.8 kPa.
5 Conclusion
The introduction of the paper describes the topicality of the research on sprinkled exchangers for absorption circulations and the types of sprinkle modes. The sprinkled tube bundles placed in test apparatus at atmospheric pressure are currently in focus all over the world. The effects of various liquids, tubes' surfaces and insertions for the purposes of increasing the Reynolds number in tubes are examined. The paper outlined the effects of two physical quantities on the heat transfer coefficient. The data published by us were compared using similarity coefficients measured at atmospheric pressure by other authors, given the number of our own figures we decided not to publish these diagrams, but our measured values were within 15% error tolerance band.
The main part of the paper was devoted to testing the influence of sprinkling liquid flow rate alteration on the heat transfer coefficient; the effects corresponded with our expectations. The tests included a long-term measuring of several points with a constant sprinkling liquid flow rate and the generated curve copied the trend during the dynamic decrease of the flow rate, while the dispersion variance of the points determined by the long-term measuring was 8%.
The second part of the experiment consisted of measuring at the pressure fall in the vessel and monitoring the effects. According to our expectations, the heat transfer coefficient was rising until the boiling occurred at the tubes' surface. After the exhauster had been removed, the pressure was still slightly falling, but only by the moment when the vessel had been filled with sufficient amount of steam. Afterwards the increase of the examined heat transfer coefficient occurred. In order to monitor the heat transfer coefficient's development in longer time intervals the measuring apparatus would have to be adjusted.
Acknowledgement
This work has been financially supported by the Czech science foundation under the grant P101/10/1669.
References
1. R. ARMBRUSTER, J. MITROVIC. Experimental thermal and fluid science: ETF science, 3, 18, 183– 194 (1998)