The Internal Carbon Emissions Reduction
Efficiency Of The South African Banking
Sector: A Data Envelopment Analysis
Alfred Bimha, University of South Africa, South AfricaABSTRACT
In this study, a BCC/CCR1Data Envelopment Analysis (DEA) Input-Oriented model is employed to measure the carbon reduction efficiency of the four major banks in South Africa (ABSA, Standard Bank, First National Bank, and Nedbank). Specifically, the Banxia Frontier Analysis DEA software is utilized to make two runs on publicly available data. In the first run, number of employees and operating costs are treated as inputs and carbon emissions as the output. In the second run, again, the number of employees and operating costs are treated as inputs, but electricity usage, paper usage, and business travel are treated as outputs. Results are opposite to those generated by the DEA input-oriented model; firms distant from the efficiency frontier are deemed efficient in terms of reducing carbon emissions and firms lying on the efficiency frontier are deemed inefficient. The first run reveals one bank (ABSA) to be inefficient and the second run demonstrates two banks (ABSA and Standard Bank) to be inefficient. Taken in sum, the current research study seeks to facilitate the measurement of carbon reduction efficiency within the banking sector.
Keywords: Data Envelopment Analysis; Carbon Emissions; South Africa; Banking
INTRODUCTION
ue to the nature of their industrial activities, most service industries are not regarded as heavy polluters. Nevertheless, many of their activities are indirectly supported by firms characterized by heavy carbon emissions (i.e., the aviation industry, energy providers, and the paper industry). As a result of this reliance on heavily polluting support firms within many South African industries, the International Energy Information Administration (IEIA, 2009) estimates that South Africa is the 12th highest emitter of carbon dioxide globally. The IEIA estimates that, in total, South Africa was responsible for 1.49% of total global emissions in 2009. In addition, South Africa exceeds the average global emissions per capita. Whereas 4.49 tons of CO2e are generated per capita worldwide, South Africa generates 9.18 CO2e per capita. This makes South Africa the largest producer of emissions in Africa, contributing about 40% of carbon emissions on the continent. Egypt is the second-leading producer of carbon emissions in Africa and contributes only 17% (IEIA, 2009).
In order to achieve environmental sustainability, most companies have initiated activities of measuring their carbon emissions and have also instituted various initiatives to reduce these carbon emissions as well. One of these activities is a process of voluntary reporting of their carbon reductions to independent institutions like the Carbon Disclosure Project (CDP), Global Reporting Initiative (GRI), and the Dow Jones Sustainability Index (DJSI). In South Africa, most companies do this to fulfill the King III Integrated reporting requirements which, when followed, give the companies a good reputation among its stakeholders as being transparent, fair and promoting a sustainable earth through their activities. The CDP report (2011) indicates that South African companies (specifically the JSE - Johannesburg Stock Exchange - Top 100 [JSE100]) are the top respondents among the BRICS companies, with 83% of the JSE100 responding to the CDP reporting requirements. Compared to their
1See Methodology section for full explanation of these abbreviations.
counterparts in the BRICS - Brazil Top 80 at 67%, India Top 200 at 28%, China Top 100 at 11%, and Russia Top 50 at 8% - more South African companies are disclosing their emissions. South Africa has also the second highest number of companies reporting carbon emissions globally after the Europe 300 which stands at 91%. Of note is the low response from emerging countries, like China and India, who have emerged as the 21st century workshops of the world and are heavily industrialized.
Released in 2011 in South Africa, the National Climate Change Response White paper recommended the establishment of carbon budgets for activities that emit high amounts of greenhouse gases (GHG), and the introduction of carbon taxes and compulsory GHG reporting regulations. In the National Climate Change Response White paper, it is suggested that entities that (a) emit more than 100,000 tons of CO2e per year (Scope 1 emissions)2or (b) consume electricity in excess of 100,000 tons of CO2e (Scope 2 emissions) will be required to report their emission output. Though most banks in South Africa are characterized by low amounts of Scope 1 emissions, their Scope 2 emissions exceed the proposed threshold of 100,000 tons of CO2e per year. Therefore, it is imperative that banks in South Africa move beyond merely measuring and disclosing their carbon emissions. Instead, it is critical that they also measure the extent to which their carbon reduction activities and processes are efficient. In this paper, a new perspective is offered that can be of use for South African firms to measure the effectiveness of their carbon reducing activities, thereby providing them with the means to avoid proposed regulations related to carbon emissions.
In essence, this study is intended to propose and implement a strategy for moving beyond the mere measurement and disclosure of carbon emissions, such that the efficiency with which a firm is efficiently reducing its carbon emissions can be gauged. In this vein, the remainder of this paper is structured as a series of interrelated sections. The following section reviews relevant literature on carbon emissions; then the methodology section describes the methodology and data used for the study; followed by the analysis of results and the discussion thereof. Finally, some concluding remarks and directions for future scholarship in this domain are presented.
LITERATURE REVIEW
Most extant studies have measured companies’ environmental sustainability performance, but not the degree to which they have reduced their carbon emissions. Continued emphasis on corporate sustainability has motivated firms to pursue three pillars of sustainability through their operations - economic, social, and environmental. These three pillars are often informally referred to as profit, people, and planet (Elkington, 1998). Some have advocated a holistic approach of looking at these three concepts (that is, in concert with each other) to promote sustainability as advocated for by the Brutland Commission which defines sustainability as ‘development that meets the needs of the present without compromising the ability of the future generations to meet their own needs’(Brutland, 1987). According to the Royal Society Report (2010) and the fourth Assessment Report produced by the Intergovernmental Panel on Climate Change (IPCC, 2007), global warming is largely the result of human activity, including the burning of fossil fuels, changes in the ways in which land is used, and deforestation.
Given this, there exists a need to determine how institutions reduce carbon emissions in their production of goods and services. Ditz and Ranganathan (1997) identified four key elements of corporate environmental performance that relate to carbon emissions - materials use, energy consumption, non-product output, and pollutant releases. Materials use pertains to the quantity, resource inputs, composition, source, and types of materials used in the performance of the company’s operations. Energy consumption refers to the quantity and types of energy used or generated by the company. For example, banking firms must establish the sources from which they derive their energy and the proportion of that energy that is gas, electricity, and diesel power. Non-product output refers to the quantity and types of waste created prior to recycling, treatment, or disposal. Most critically, however, firms must possess the ability to distinguish production efficiency from end-of-pipeline pollution. Pollutant releases are the quantity and types of pollutants released into the natural environment. These include toxic chemicals, GHGs, solid wastes, and types of pollutants.
2GHG protocol divides GHG emission into three types of scope. Scope 1 refers to all direct GHG emissions; Scope 2 refers to indirect GHG
Imeson and Sim (2010) identified three ways which banking institutions are using to combat climate change. Firstly, they adapt to the effects of climate change by not locating facilities in areas prone to serious flooding and bushveld fires and having robust disaster recovery plans to cope with extreme weather events or other catastrophes. In addition, they take business interruption insurance as a result of such events. Taken together, these steps are referred to as rendering the firm “climate proof.” Second, banking institutions mitigate the environmental impact of their activities by becoming “climate friendly.” This involves the reduction of energy use in their daily business activities that, in turn, reduces the carbon emissions the firm generates. Third, banking institutions exploit commercial opportunities related to climate change by lending to, and investing in, energy saving equipment and materials, as well as industrial activities that reduce toxic waste and pollution, create renewable energy, and any other process that reduces the firm’s carbon footprint. Banks also invest in, and trade, carbon emissions allowances and climate change funds. They refer to this third category of activity as “climate profitability.”
Imeson and Sim (2010) further indicate that although banking institutions have made substantial progress in reporting data on their environmental sustainability, this data is often tracked inefficiently by multiple operational systems or rudimentary accounting systems. It is thus imperative to go beyond reporting and disclosure, by exploring how the environmental performance of banking institutions can be measured. The authors propose that banks invest in data and analytical frameworks in order to assist them in understanding correlations among key environmental performance indicators and to be able to identify areas for further analysis and improvement. Most banks have established environmental management systems based on ISO14000/14001 certification, which ensures conformance to environmental laws and regulations. In spite of this positive step, there remains a need for systems that can track and demonstrate not only environmental compliance, but also environmental performance.
In a study of six German/Swiss financial institutions, Juecken and Bouma (1999) showed that measuring and comparing environmental performance among banks remains difficult. Specifically, the authors used a method developed by VfU3to standardize the measurement of environmental pollution within banks. Each bank employed the VfU approach to evaluate their internal activities as a means to compare the respective degrees to which they negatively affect the environment. However, Juecken and Bouma (1999) found that the VfU method was unable to account for the size or specific operations of organizations, which led to some anomalies. For example, firm size affects the amount of paper a firm uses and the amount of travel in which it engages. This was determined to have affected the ways in which a bank’s pollution was measured, making it difficult to standardize these measures when comparing small banks with multinational financial institutions. In the current study, however, Data Envelopment Analysis (DEA) is employed to evaluate these issues. In contrast to the VfU method, DEA is able to account for scale of operations in its calculations (the characteristics of DEA will be explored in greater detail in the methodology section). Kuosmanen and Kortelainen (2008) agreed that DEA is capable of aggregating various positive and negative effects of production into a single efficiency index. Moreover, DEA does not require a priori weights for different environmental variables.
To the best of the researcher’s knowledge, there has been no measurement developed to evaluate efficiency in reducing carbon emissions exclusively in the banking sector. Further, literature related to comparable measures is limited. A study by Zhou et al. (2008b) showed how DEA can be used to construct composite sustainability indicators. The authors assert that sustainability indicators can be classified as economic, environmental/ecological, and socio-political. They further discuss various extant indicators for sustainability. One of these indicators - the Environmental Sustainability Index - is important to this paper because (a) the Environmental Sustainability Index was derived from an aggregation of a set of individual indicators that measure multi-dimensional concepts, but usually do not have common units of measurement, and (b) the primary aim of this study is to measure different sources and generators of carbon emissions, which are similarly measured in different units. Zhou and colleagues (2008b) concur that DEA is suitable for performing an analysis in which multiple decision criteria must be considered in the construction of composite sustainability indexes. They also demonstrate how the DEA model can be tailored to construct an Environmental Performance Index. The underlying construct of this model uses production theory and sub-divides the indicators into inputs, desirable outputs, and undesirable outputs.
3VfU stands for VereinfürUmweltmanagement in Banken, Sparkassen und Versicherungen. In English, this means Association for Environmental
Similarly, Chang et al. (2011) used DEA to measure changes in corporate sustainability performance in 311 companies over several industries. Using economic, social, and environmental tenets of corporate sustainability as classifications, the authors identified environmental performance (eco-efficiency), environmental policy/management, and environmental reporting as important components of corporate sustainability. Through the identification of these components, Chang et al. (2011) effectively measured changes in corporate sustainability performance. Moreover, the study used sustainability scores developed by Sustainability Asset Management (SAM) to measure the relative efficiency of various companies in terms of their corporate sustainability performance.
A study performed by Tyteca (1997), relating to the measurement of environmental performance using linear programming, laid the foundation for the use of DEA in measuring environmental performance at the firm, industry, and even country level. Tyteca (1997) categorically stated that a variety of linear programming approaches (particularly DEA approaches) have contributed to the formulation of two categories of factors (inputs and outputs) for use in environmental performance index. Tyteca additionally identified a third factor for inclusion in environmental performance indices - pollutants or undesirable outputs. However, Haynes et al. (1994) recommended the use of a DEA model that measures the most efficient firm in environmental terms by categorizing pollutants as inputs and air and water as outputs. Despite their contributions, Tyteca (1998) and Haynes et al. (1994) focused primarily on the measurement of environmental performance among electricity-generating plants. Thus, some of the inputs used in their models were not entirely applicable to the service industry as a whole. In spite of their limitations, however, the two studies were crucial in the models they proposed to aid in measuring environmental efficiency. In this paper, water pollution is not considered. Instead, the focus is on banking-related activities that affect the air. Stated another way, this study focuses on carbon emissions.
Several empirical studies have shown that within the service industry, reductions in energy consumption are essential for reducing the effect of carbon emissions on the environment. Mortimer et al. (1998) showed that carbon reductions are possible through the adoption of cost effective energy efficiency measures that involve the installation and operation of energy-saving building services plants and appliances and the use of low-energy equipment, including computers and other accessories. In this vein, Aranda et al. (2012) used regression analysis to analyze energy consumption in the Spanish banking sector. Though the authors did not seek to link energy savings to reduced carbon emissions, they validated essential variables for reducing carbon emission in the service industry. The most noteworthy outcome of the study was the identification of a correlation between number of employees, number of automated teller machines, summer climatic severity, office surface area, age, and annual energy consumption. Specifically, Aranda et al. (2012) found that a firm’s total number of employees was highly correlated to the rest of the variables.
However, a concern arises when one seeks to measure carbon reduction efficiency. Although the generation of carbon emissions is an output of conducting business, it is an undesirable one. Because the mainstream DEA model measures desirable outputs, a number of studies have employed it as such. However, Dyckhoff and Allen (2001) proposed a DEA model that incorporates both positive and negative ecological outputs. Holger (2001) demonstrated the need to incorporate undesirable outputs into the product model measured by DEA. Seiford and Zhu (2002) also showed how the standard DEA model can be used to improve the performance of decision-making units (DMUs) by increasing desirable outputs and decreasing undesirable outputs, all while preserving the linearity and convexity of DEA. In this way, these studies developed a more theoretical approach to measuring and benchmarking ecological efficiency among DMUs.
At the industry level, Zhou and Ang (2008a) showed that DEA has been widely used in the benchmarking of electricity utilities accounts and in the modeling of environmental performance and energy efficiency. The authors found that the Constant Returns to Scale (CRS) reference technology and the radial efficiency measures were the most widely used specifications. They also found that desirable outputs and undesirable outputs were simultaneously considered and further recommended the incorporation of environmental DEA technology with the Directional Distance Function (DDF) measure of efficiency.
On the basis of the literature outlined above, it is evident that few studies have attempted to measure carbon emissions in the financial services industry. Therefore, it is sought to explain the concept of data envelopment analysis and the model construct to redress this gap in the literature.
DATA AND METHODOLOGY
Data Envelopment Analysis
DEA (Data Envelopment Analysis) is a powerful linear programming tool used to assess the efficiency of organizations or DMUs that provide similar services (Julnes, 2008). The DMUs evaluated in this study are four South African banks - ABSA, Standard Bank, Firstrand, and Nedbank. The DEA approach applies linear programming to measure the efficiency of any organization (DMU) as the maximum ratio of weighted outputs to inputs. Further, this generalized optimization technique measures the relative performance of different decision-making entities that have multiple input structures. The DEA model estimates relative efficiency, which is in reference to the best performing DMU or DMUs (if multiple DMUs are equal in terms of optimal efficiency). The DEA allocates an efficiency score of 100% to the most efficient unit, with the lower-performing DMUs being evaluated from 0-100% in relation to the most efficient unit.
To develop a DEA model, n DMUs are considered and the following variables are defined:
j = 1,2,…,n (DMU variable) i = 1,2,…,m (inputs variable) r = 1,2,…,s (outputs variable)
Therefore, each DMUj, j = 1,2,…,n, uses the following variable factors:
xij – amount of input i for the unit j, i = 1,2,…,m and j = 1,2,…,n. yrj – amount of output r for the unit j, r = 1,2,…,s and j = 1,2,…,n. ur – weight assigned to the output r, r = 1,2,…,s.
vi – weight assigned to the input i, i = 1,2,…,m.
The next step is to form the virtual input and output of each DMU using the weights (to be determined) vi and ur:
1
virtual output =
m
r rj i
y
u
where j = 1, 2,…,n (DMU variable). This is done to determine the weights using linear programming so as to maximize the ratio:
Virtual Ouput
Virtual Input
1
virtual input =
m
i ij
i
v x
However, in this study, the relative efficiency approach is employed to determine the most efficient DMU in reducing carbon emissions. This is determined by the following equation:
weighted sum of outputs
Efficiency =
weighted sum of inputs
1 1 2 2
1 1 2 2
...
Efficiency of unit j =
...
j j
j j
y
y
u
u
v x
v x
where
U1 = the weight given to output 1 Y1j = amount of output 1 from unit j V1 = weight given to input 1 X1j = amount of input 1 to unit j
Because the aim is to identify the DMU that most efficiently reduces its carbon emissions, an input-orientation DEA model is used. In an input-oriented model, the level of all outputs remains constant and technical efficiency score θ measures the minimal radial contraction of the inputs.
Mathematical Theory behind the DEA Model
Sherman and Zhu (2006) proposed the following DEA mathematical model:
Maximize the efficiency score for DMUo.
This is subject to a constraint such that when the same set of u and v coefficients is applied to all other DMUs being compared, no DMU will be more than 100% efficient. This is demonstrated as follows:
u1… us >0, v1…vm≥0
To perform DEA on a standard linear program package, the fractional forms above are algebraically reformulated as:
Additionally, the fractional forms above are subject to the constraints:
The above equation is reduced to:
Thus, the fractional forms above can be calculated as:
and is subject to:
Where, ur,vi≥ 0
To identify the DMU (bank) that is most efficient at reducing carbon emissions, the dual linear program must be applied to Equation 1. That is,
Min θ:
j = number of DMUs being compared in the DEA analysis DMUj = Decision-making Unit j
θ = efficiency score of the DMU being evaluated by DEA
yrj = amount of output r used by DMUj xij = amount of input i used by DMUj
i = number of inputs used by the DMUs
r = number of outputs generated by the DMUs
ur = coefficient or weight assigned by DEA to output r vi. = coefficient or weight assigned by DEA to input i
This model is known as the Charnes, Cooper, and Rhodes (CCR) Model and assumes constant returns to scale (CRS; Charnes et al., 1978). Still, variable returns to scale (VRS) can be incorporated into this model by adding the following constraint:
1
1
n
j
e
j
The resulting model is called the Banker, Charnes, and Cooper (BCC) Model (1984). In the BCC model, a DMU’s scaled efficiency is determined to be the ratio of CCR efficiency to BCC efficiency. As noted by Azadeh et al. (2008), in input-oriented models, the efficiency of a DMU’s VRS is always greater than or equal to its CRS efficiency. Therefore, the scale efficiency of a DMU is equal to 1 if the DMU is operating at its most productive scale size; otherwise, the scale efficiency will be less than 1.
Sources and Description of the Data
According to the CDP Report 2010 (Incite Sustainability, 2010), in the financial sector, carbon emissions are primarily generated from paper usage, electricity usage, and business travel. To determine the efficiency with which the banking sector in South Africa (including Standard Bank, Nedbank, ABSA, and Firstrand) reduces carbon emissions, the banks’ paper usage, electricity usage, business travel, total carbon emissions, number of employees, and operating expenses are extracted from the banks’ annual and sustainability reports. The four banks included in the dataset were chosen on the basis of their locality (the aim of the study was to analyze only locally owned South African banks), their reporting practices, and their control of 84% of the financial market in June of 2010 (The Banking Association South Africa, 2010). Two of the banks began reporting their emissions in 2007 and the other two began reporting in 2010. As such, it was justifiable to use carbon emissions data reported by the banks in their 2010 annual reports.
Methodology and Analysis Framework
The Banxia Frontier Analyst DEA software was used to apply the model parameters outlined by the equations above. The banks’ respective efficiencies in reducing carbon emissions through their internal activities were tested by running the same model with different variables. The first run incorporated number of employees and operating costs as the inputs and total carbon emissions as the output. The second run similarly included number of employees and operating costs as inputs, but used electricity usage, paper usage, and business travel as outputs. By constructing these two models, it is intended to identify the sustainable level of operating costs and number of employees that characterize an efficient carbon reducing DMU within the South African banking sector. In this study, the interpretation of the model’s findings is in reverse of the normal DEA results. The normal interpretation of the DEA results is that a DMU with an efficiency score of 1 is the most efficient and a DMU with a score of 0 is the least efficient. In the case of this study, the DMU with an efficiency of 0 - or closer to zero - is deemed as the most efficient DMU that has successfully reduced its carbon emissions. On the other, the DMU with a score of 1 is deemed as least efficient DMU in reducing its carbon emissions.
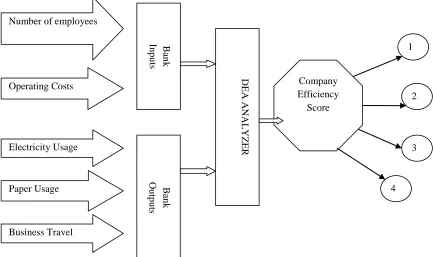
performance or relative efficiency measure to identify the most efficient DMU is being suggested, an envelopment model is adopted, which establishes relationships among DMUs or peers. Figures 1 and 2 illustrate the decision support systems using DEA methodology. These models will be used to assess the performance of each company in the first and second runs, respectively.
Figure 1: Process Flow for Measuring Carbon Reduction Efficiency - First Run
Figure 2: Process Flow for Measuring Carbon Reduction Efficiency - Second Run
The process flow depicted in Figures 1 and 2 treats the number of employees a bank has and the banks’ operating costs as input variables. Carbon emissions is the output variable as shown in Figure 1 whilst paper usage, electricity usage, and business travel mileage are used as output variables to calculate efficiency scores for each bank in Figure 2. An evaluation of each bank against the other banks is performed using similar inputs and outputs that are established for both performing and non-performing banks. By incorporating the variables associated with the above processes into the fractional forms in the methodology section, the following remains:
No. of employees
Operating Costs B an k In p u ts Carbon Emissions B an k Ou tp u ts DE A ANAL Y Z ER Company Efficiency Score 1 2 3 4
Number of employees
Table 1 summarizes the data used to analyze the banks’ performance in terms of carbon emissions reduction.
Table 1: The Banks’ Data Used for the DEA Analysis Operating
Costs (ZAR)
No. of Employers
Carbon Emissions (Mt CO2)
Electricity Usage (Kwh)
Paper Usage (Tons)
Business Travel (Km) ABSA 24,949,000,000 43,239 415,000.00 469,000,000 2,377 140,000,000
Standard
Bank 21,441,000,000 30,396 177,289.00 145,015,178 2,755 94,741,060 Nedbank 16,598,000,000 27,525 213,148.70 83,341,702 1,917 40,776,723
Firstrand4 38,817,000,000 38,657 311,371.00 330,952,560 1,747 69,357,196
RESULTS AND DISCUSSION
It would have been useful to perform a time series analysis of carbon emissions reduction for all the banks in the sample, but the banks began reporting data related to emissions in different years. In addition, most banks began measuring the degree to which they reduced carbon emissions in 2009. Figure 3 illustrates each bank’s reported carbon emissions.
Figure 3: Reported Carbon Emissions from 2007 to 2010 (Source: CDP Reports, 2007, 2008, 2009, 2010)
Figure 3 demonstrates that whereas Standard Bank and Nedbank have been reporting their carbon emissions since 2007, ABSA and Firstrand only started reporting theirs in 2009. This makes a balanced comparative time series analysis impossible due to different base reporting years. A two-year comparative trend analysis will not provide a fair representation of the bank in terms of its success in reducing its carbon emissions. The data show,
4Because Firstrand’s Sustainability Report did not provide data related to raw electricity usage, paper usage, these values were deduced by
converting them from carbon emission into their respective units of measurement.
415,000 177,289
213,149
311,371
391,000 154,358
211,641
403,724
168,824 134,061
122,884 128,540
ABSA Standard Bank Nedbank Firstrand
2007
2008
2009
however, that over the two years in which it reported its emissions, Firstrand successfully reduced its carbon emissions between 2009 and 2010. The carbon emissions data for 2009 for ABSA were taken from the CDP report of 2009 and they are not present in their Sustainability report of 2009. However, ABSA indicated that the data were incomplete, and could therefore not be incorporated into the 2009 sustainability report, and was used for comparison basis. Because all banks have different base years for measuring their carbon emissions, a simple measure of carbon emissions emitted per employee for each bank is present. This measure facilitates a determination of which firms have been successful in reducing carbon emissions per employee (see Figure 4).
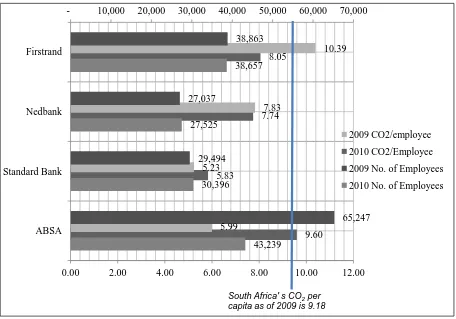
Figure 4: Carbon Emission per Employee
Figure 4 demonstrates that banks which experience big changes in the number of workers they employ have similarly experienced a large change in carbon emissions per employee (i.e., ABSA and Firstrand). As of 2010, ABSA was the only bank that produced more CO2 per employee than South Africa’s CO2 per capita in 2009 (9.18). In addition, those banks that have been reporting since 2007 (i.e., Standard bank and Nedbank) have reduced their carbon emissions and maintained only small fluctuations in the number of workers they employ and CO2 emissions per employee. From this, it can be concluded that CO2 per employee indicates the optimum number of employees that each bank should have to minimize its negative influence on the environment.
However, there exist a number of factors that must be considered when attempting to determine which banks are successful in reducing their carbon emissions. Using the DEA approach, a relative efficiency score for each of the four banks using a scale from 0 to 1 (or 0% to 100%) is calculated. In this study, however, a bank that operates at 100% efficiency minimizes inputs, but maximizes carbon emissions. Whereas a traditional DEA would consider this bank efficient, it is deemed inefficient as per this study due to its impact on the environment. In other words, the company that minimizes inputs and experiences a corresponding reduction in outputs is deemed as being efficient.
9.60 5.83
7.74 8.05
5.99 5.23
7.83
10.39
43,239 30,396
27,525
38,657
65,247 29,494
27,037
38,863
- 10,000 20,000 30,000 40,000 50,000 60,000 70,000
0.00 2.00 4.00 6.00 8.00 10.00 12.00
ABSA Standard Bank Nedbank Firstrand
2009 CO2/employee
2010 CO2/Employee
2009 No. of Employees
2010 No. of Employees
In the first run, the DEA input-oriented model with a CRS is applied. CRS refers to a one-to-one relationship between inputs and outputs; doubling inputs would similarly double outputs. This first run seeks to analyze the degree to which banks are being cost effective in reducing carbon emissions. The inputs in this analysis are the bank’s number of employees and operating costs; the output is carbon emissions. Efficiency scores for this first run are shown in Table 2.
Table 2: Efficiency Scores for the First Perspective - Carbon Emissions as Output Input-Oriented CRS
Sum of Lambdas RTS Optimal Lambdas With Benchmarks DMU No. DMU Name Efficiency
1 ABSA 1.00000 1.000 Constant 1.000 ABSA
2 Standard Bank 0.60771 0.427 Increasing 0.427 ABSA
3 Nedbank 0.80683 0.514 Increasing 0.514 ABSA
4 Firstrand 0.83922 0.750 Increasing 0.750 ABSA
In this case, ABSA is the only bank that demonstrates an increase in carbon emissions rather than a reduction. It is the benchmark DMU in terms of increasing carbon emissions instead of reducing them. Therefore, as a contrast, Standard Bank is 60.77% efficient in reducing its carbon emissions in relation to ABSA. Standard Banks lambda value of 0.427 indicates that Standard Bank will need to achieve 42.7% of the capacity ABSA for it to become inefficient in reducing its emissions. The slack values in Table 3 indicate which variables should be adjusted for each back to be as ineffective as ABSA in reducing emissions. Standard Bank, for example, would need to increase its operating costs by ZAR 2.4 billion to increase its carbon emissions in relation to ABSA. However, it should be noted that greater expenditure on reducing carbon emissions typically yields greater efficiency. For example, Standard Bank has experienced a significant decrease in its operating costs and number of employees from the period 2009 to 2010, as shown in Figure 4, to become the most efficient DMU in reducing its carbon emissions. This can be observed from the amount of costs it incurs related to carbon emissions. Some companies have low operating costs but generate high levels of carbon emissions. This indicates that the cost structure involves no spending related to reducing carbon emissions.
Table 3: Slack Values for the First Run - Carbon Emissions as Output
DMU No. DMU Name Input Slacks Output Slacks
Operating Costs (ZAR) No. Of Employers Carbon Emissions
1 ABSA 0.14 0.00 -
2 Standard Bank 2,371,532,674.70 - -
3 Nedbank 577,702,125.58 - -
4 Firstrand 13,857,108,483.06 0.00 -
For the second run, carbon reduction efficiency, as a function of the actual sources of carbon emissions, is evaluated. This is referred as to the operational efficiency of the banks to effectively reduce carbon emissions at the sources or at points were carbon emissions are generated. For this run, the inputs remain the same as the first model, but outputs are paper usage, electricity usage, and business travel. The results for the second run are summarized in Table 4.
Table 4: Efficiency Scores for the Second Run - Resource Usage as Outputs Input-Oriented CRS Sum of
Lambdas RTS Optimal Lambdas With Benchmarks DMU No. DMU Name Efficiency
1 ABSA 1.00000 1.000 Constant 1.000 ABSA
2 Standard Bank 1.00000 1.000 Constant 1.000 Standard Bank 3 Nedbank 0.89886 0.696 Increasing 0.696 Standard Bank
4 Firstrand 0.80448 0.729 Increasing 0.695 ABSA 0.034 Standard Bank
paper usage, and business travel). It is interesting to note that Standard Bank was deemed efficient in the first run, but ABSA was found to be inefficient in both runs. Nedbank and Firstrand were found to be efficient in both runs. Moreover, Firstrand’s lambda values suggest that the firm must achieve 69.5% of ABSA’s production capacity (or 3.4% of Standard Bank’s capacity) to reach the inefficiency frontier of not reducing carbon emissions.
The slack values in Table 5 demonstrate the extent by which the efficient banks (i.e., Nedbank and Firstrand) must worsen so as to become inefficient in reducing their carbon emissions. Nedbank will need to increase its number of employees by 3,600, its electricity usage by 17,564,000 kilowatt hours, and its business travel by 25,150,000 kilometers to increase the carbon emissions from their present level to be at the same level as Standard Bank.
Table 5: Slack Values for the Second Run - Resource Usage Values as Outputs
DMU
No. DMU Name
Input Slacks Output Slacks
Operating Costs No. Of Employees Electricity Usage Paper Usage Business Travel
1 ABSA 0.10 - - - -
2 Standard Bank - 0.00 - - -
3 Nedbank 0.01 3,590.67 17,563,596.09 - 25,146,548.05
4 Firstrand 13,148,945,141.19 - - - 31,208,852.55
This means that the second run has shown ABSA and Standard Bank to be the most inefficient among the sample banks. However, Firstrand has about ZAR13.15 billion in operating costs, part of which is geared toward reducing carbon emissions. By reducing the operating costs that reduce carbon emissions, Firstrand risks becoming as inefficient as ABSA. The scores attained in this analysis corroborate ratings provided by the CDP Report of 2010 (see Table 6). Nedbank is ranked second in all instances and seems to maintain a steady performance with regard to reducing carbon emissions by balancing operating costs and number of employees.
Table 6: CDP Report 2010 Scores
Nedbank Standard Bank FNB ABSA
Performance Band A B B C
Disclosure Score 88% 74% 93% 64%
GHG Target in place Yes Yes Yes Yes
GHG Emission Verified Yes No Yes Yes
Carbon Disclosure Leadership Index Ranking 3 17 1 24
The results reported above indicate that Firstrand is the most efficient bank in terms of reducing emissions. Nedbank is second-most efficient, followed by Standard Bank. ABSA is the least efficient in this regard. Despite being ranked second in these analyses, however, Nedbank has been graded in band A, indicating that compared to its peers, it has more robust initiatives in place to control its production of generators of carbon emissions. This is also seen in its slack values of operating efficiency. Since 2007, Nedbank has been efficient in its generation of carbon emissions. In turn, the firm has maintained low operating costs and a low number of employees.
CONCLUSION
The primary drawback of these analyses relates to DEA’s inability to calculate absolute efficiency. Still, the benchmarking process is able to identify the company with the best practices. In the current study, the company with the best practices is the one that is the most efficient in reducing carbon emissions. The panel data of 2010 that use Data Envelopment Analysis show Firstrand to be the most efficient of the four banks, followed by Nedbank, Standard Bank, and ABSA, respectively. One limitation associated with my development of a robust measure for gauging carbon emissions reductions efficiency relates to the number of firms in the sample. A greater number of DMUs in the sample would yield a more robust measure of efficiency performance. In the current study, the focus to local banks (of which there are only 11 in South Africa) was limited. Out of these eleven banks, only six reported their generation of carbon emissions. Of the remaining six banks, two were excluded from the analysis because their activities were of a different type than the banks included. Investec is a specialist bank that concentrates on wealth management and investment banking, and African Bank focuses primarily on credit and is not a deposit-taking institution.
The DEA approach utilized in this study was simplistic given the variables available. With more accurate measurements, a greater amount of data, and increased reporting on carbon emissions by other financial institutions, future studies can more comprehensively evaluate the environmental performance of the banking sector in South Africa. The only difficulty associated with undertaking more robust and complex measurements of environmental performance of South African banks relates to the lack of high quality carbon emissions data and a lack of uniform reporting of the same.
AUTHOR INFORMATION
Mr. Alfred Bimha is a Lecturer of Banking in the Department of Finance, Banking, and Risk Management, which falls within the College of Economic and Management Sciences (CEMS) at the University of South Africa. He holds a Master of Science in Banking and Financial Services and a Bachelor of Commerce (Honors) in Banking from the National University of Science and Technology, Zimbabwe. He has great interest in Business and Climate Change, Carbon and Environmental Finance, and Sustainable Banking and Finance. He has presented several conference papers with regard to carbon markets and carbon assets. E-mail: bimhaa@unisa.ac.za
REFERENCES
1. Aranda, A., Ferreira, G., Mainar-Toledo, M., Scarpellini, S., & LleraSastresa, E. (2012). Multiple regression models to predict the annual energy consumption in the Spanish banking sector. Energy and Buildings,49, 380-387.
2. Azadeh, A., Ghaderi, S., & Asadzadeh, S. (2008). Energy efficiency modeling and estimation in petroleum refining industry-A comparison using physical data. Retrieved August 27, 2013, from
http://icrepq.com/icrepq-08/242-azadeh.pdf
3. Banker, R. D., Charnes, A., & Cooper, W. W. (1984). Some models for estimating technical and scale inefficiencies in data envelopment analysis. Management Science,30(9), 1078-1092.
4. Brundtland, G. H. (1987). World commission on environment and development. Our Common Future, 8-9. 5. Chang, D., Kuo, L. R., & Chen, Y. (2011). Industrial changes in corporate sustainability performance – An
empirical overview using data envelopment analysis. Journal of Cleaner Production, 56(1), 147-155. 6. Charnes, A., Cooper, W. W., & Rhodes, E. (1978). Measuring the efficiency of decision making units.
European Journal of Operational Research, 2(6), 429-444.
7. Ditz, D. W., & Ranganathan, J. (1997). Measuring up: Toward a common framework for tracking corporate environmental performance. Washington, DC: World Resources Institute.
8. Dyckhoff, H., & Allen, K. (2001). Measuring ecological efficiency with data envelopment analysis (DEA). European Journal of Operational Research, 132(2), 312-325.
9. Elkington, J. (1998). Partnerships from cannibals with forks: The triple bottom line of 21st‐century business. Environmental Quality Management, 8(1), 37-51.
10. Haynes, K. E., Ratick, S., & Cummings-Saxton, J. (1994). Toward a pollution abatement monitoring policy: Measurements, model mechanics, and data requirements. Environmental Professional, 16(4), 292-303. 11. Incite Sustainability. (2010). Carbon Disclosure Project 2010 - South Africa JSE 100. Carbon Disclosure
12. Jeucken, M. H., & Bouma, J. J. (1999). The changing environment of banks. Greener Management International, 1999(27), 20-35.
13. Julnes, P. D. (2008). Data envelopment analysis for performance assessement and decision making unit. In K. Yang, & G. J. Miller (Eds.), Handbook of methods in public administration (2nd ed., Vol. VI). (pp. 669-687). New York: Taylor & Francis.
14. Kim, K., & Kim, Y. (2012). International comparison of industrial CO2 emission trends and the energy efficiency paradox utilizing production-based decomposition. Energy Economics, 34(5), 1724-1741. 15. Kuosmanen, T., & Kortelainen, M. (2005). Measuring eco-efficiency of production with data envelopment
analysis. Journal of Industrial Ecology, 9(4), 59-72.
16. Lee, K., & FarzipoorSaen, R. (2012). Measuring corporate sustainability management: A data envelopment analysis approach. International Journal of Production Economics, 140(1), 219-226.
17. Mortimer, N., Ashley, A., Moody, C., Rix, J., & Moss, S. (1998). Carbon dioxide savings in the commercial building sector. Energy Policy, 26(8), 615-624.
18. Ramanathan, R. (2005). An analysis of energy consumption and carbon dioxide emissions in countries of the Middle East and North Africa. Energy, 30(15), 2831-2842.
19. Royal Society, The. (2010). Climate change: A summary of the science. London: Science Policy Centre. 20. Seiford, L. M., & Zhu, J. (2002). Modeling undesirable factors in efficiency evaluation. European Journal
of Operational Research, 142(1), 16-20.
21. Sherman, H. D. (2006). Service productivity management: Improving service performance using data envelopment analysis (DEA). New York: Springer.
22. Susan, S. (2007). Climate change 2007-the physical science basis: Working group I contribution to the Fourth Assessment Report of the IPCC. Cambridge, UK: Cambridge University Press.
23. The Banking Association South Africa. (2010). South African baking sector overview. Retrieved 30 July 2012, from www.banking.org.za/getdoc/getdoc.aspx?docid=1130
24. Tyteca, D. (1997). Linear programming models for the measurement of environmental performance of firms–concepts and empirical results. Journal of Productivity Analysis, 8(2), 183-197.
25. United States Energy Information Administration: International Energy Outlook. (2011). Energy information administration. Retrieved 23 July 2013, fromwww.eia.gov/ieo
26. Zhou, P., Ang, B. W., & Poh, K. L. (2008). A survey of data envelopment analysis in energy and environmental studies. European Journal of Operational Research, 189(1), 1-18.