184
Social And Environmental Accounting: A
Response To The Company's Operational
Externalities
Dewi Susilowati
Abstract: Conventionalaccountinghas limitationsin responding tothe impact ofexternalitiesgenerated bythe operations ofthe company. This was the background of social and environmental accounting study. Externalitiesthat are notrespondedpositivelywillaffect thelegitimacy ofthe business, so thatthe continuity ofthe company's operationsdisturbed. Therefore, notonlyfinancial informationis neededbutmore comprehensiveinformation. Inthis research, thedisclosure-scoring methodologybasedoncontent analysistomeasure thesecondary data obtainedfromannual report.As for theunitof analysisisthe top eightoil and gascompaniesarethe largestproducerof oil and gasproductionin Indonesia.The results ofthe measurementofsocialand environmentaldisclosure, socialand environmentalperformance, environmentalexposure,andenvironmentalcontent, using disclosure-scoring, usedfordescriptiveandstatisticalanalysisto determine the relationshipand its effect oneconomicperformance. The research provesthat theimpact ofthese externalitiescanaffect thesocialandenvironmentalperformance, social and environmental disclosureandeconomic performance.
Keywords: socialandenvironmentalperformance, externalities, economic performance, socialandenvironmentalaccounting, social and environmental disclosure, environmental exposure, environmental content.
————————————————————
1. Introduction
Natural resources have been exploited on a large scale but it did not generate the level of welfare as expected. Phenomenon is strengthened by the increasing growth of GDP (Gross Domestic Product) in Asia and the Pacific countries that exceed the GDP growth rate, indicating growth in transition economies. However, paradoxically, these countries are still experiencing slow economic growth. Almost all the country faces serious environmental problems. The fact is that a high level of socio-economic development is not always followed by a high environmental sustainability. (Rae Kwon Chung, 2010, p.1). Rae Kwon Chung (2010, p.14) argues on the stage of economic development, to improve the environmental performance is not enough to control pollution, but also must be addressed by improving the eco-efficiency of production and consumption as well as an increase in income that exceeds the level of economic development. This also denied reports published UNESCAP (United Nations State of the Environment (SOE) in Asia and the Pacific) in 2005 which stated that sustainable development can be achieved by improving the environmental performance of the short-term contains an error. Problem-solving process is only just at the end-of-pipe will not suffice. Like if only emphasizes the development environment that is associated with economic growth alone. Eco-efficiency and resource productivity is a concept used to determine the effectiveness of using environmental resources more broadly (Elkins,P. andTomei,J., 2010, p.7). It not only can be applied to the macro-economic sector but also in the micro sector, ie companies as one of the country's economic wheel.
Externalities impacts of corporate activities to make the scope of social and environmental accounting changes. The company's main goal as a producer profit as possible for the benefit of shareholders to be questioned again. This is not apart of the externalities that have been neglected. From an economic perspective, externalities, is the impact of a company's activities to other parties not included in the cost of goods or services produced by the company. The traditional accounting unnoticed because the problem identification, and measurement. Accounting report only transactions that affect the account assets, liabilities, equity, revenue and expense that have a monetary value, while the externalities that have an impact on the five accounts were not disclosed due to difficulties in the identification and measurement. But whether because of those two factors make it neglected important information. Though these factors have a significant impact on the survival of a company. Therefore social and environmental accounting emerged as a business language media are more holistic than traditional accounting. Accounting model used in this study involved a framework that incorporates the concept of eco-efficiency into the three-dimensional concept of sustainable development, namely the dimensions of ecological, social, and economic, which is further broken down into several factors measurement performance. So this study will examine the influence of social variables and environmantal disclosure as the medium used to convey information about the social and environmental performance, as the second variable to variable economical performance. The concept of eco-efficiency will be included as one of the indicators of the variable social and environmental performance and economic performance.
2. Review of Literature
The concept of accounting for sustainability formula ted by Grayetal., (BebbingtonandGray, 2001), (Gray, 1996). identifiesthreemethods usedinaccountingforsustainability:
1) accounting for natural inventories 2) the calculation of sustainable cost 3) input–output analysis.
____________________
• JenderalSoedirman University Lecturer
• Student of Doctoral Program in Accounting ,
University of Padjadjaran Bandung
185 Inthis researchusedaconcept ofeco-efficiencyinto
threedimensionsof sustainable development, namelythe dimensions ofecological, social, and economic, which
isfurtherbroken down into
severalfactorsmeasurementperformance. (Al-Tuwaijri et al, 2004)Soitwillexamine the influence ofsocial
andenvironmentaldisclosureas a
mediumtoconveyinformationaboutthe socialand environmentalperformance, to theeconomicperformance. The concept ofeco-efficiencywillbe includedas one of theindicators ofthevariablesocialand environmentalperformance andeconomicperformance. At the present time, social and environmental accounting as a meaningful addition further expands disclosures, such as providing information about employees, products, community service, and the prevention or reduction of pollution. However the social and environmental accounting is used to describe a more comprehensive form of accounting that includes account externalities (cost to be borne by public sector organizations from private organizations) as well as private costs are common. Non-traditional accounting has revealed problems externalities in the annual report. The type and extent of disclosure has been investigated by Guthrie and Mathews, (1985), (Gray, Owen and Maunders,1987). However social measures in the annual report, can not be separated from the nature of the analyst's subjectivity. Companies use the disclosure to create or maintain its position in the environment in which they operate. Subjectivity is still an ongoing issue, but have tried to find a solution by developing a uniform content analysis (Guthrie and Mathews, 1985). Nevertheless, the development of narrative reporting and non-traditional in the annual report has increased to more extensive and can no longer be ignored by the modern accountant. Reporting of social and environmental performance of a business entity or enterprise, not only contains qualitative information, but includes quantitative information. This quantitative information is closely related to financial performance (narrowly) or economic performance (broadly). It can be seen from the description of sustainability reporting guidelines that express the purpose of an sustanability report, namelySustainability reporting is the practice of measuring, disclosing, and being accountable to internal and external stakeholders for organizational performance towards the goal of sustainable development. Sustainability reporting is “a broad term considered synonymous with others used to describe reporting on economic, environmental, and social impacts (e.g.,triple bottom line, corporate responsibility reporting, etc)”. (GRI,2006, p. 3) Unity is the center of attention of accounting is a joint venture activities involve various stakeholders as part of the economic activity. All participants (managers, employees, shareholders, creditors, customers, governments, and communities) to bear all aspects of joint activity. Company serves as the center of activity. This becomes relevant when the company becomes very large (large corporation). This view is based on the idea that large companies function as social institutions that have broad economic effects and complex, so can be prosecuted social accountability. The motives for companies engaging in social responsibility initiatives can be legitimacy (image building), sustainability (altruism) or bottom line (profitability), (Bronn and Vidaver-Cohen, 2009). However,
as they found in their study, legitimacy motives, which include “improve our image”, “be recognized for moral leadership” and “serve long-term company interests”, have emerged as the most important consideration. Solomon and Lewis (2002) found enhanching corporate image as the main reason for corporate environmental disclosure, and the predominance of studies utilizing legitimacy theory to explain the reporting practice. Based on this evidence, we can pull the conclusion that environmental legitimacy as the aim of the organization in its environmental endeavours. Environmental legitimacy is “the generalized perception or assumption that a firm’s corporate environmental performance is desirable, proper, or appropriate” (Bansal and Clelland,2004,p.94). Further assert that an organization earns legitimacy when its environmental performance conforms to the stakeholders” expectations, including those of managers, customers, investors, and community members (stakeholders).
2.1. Social and Environmental Performance
Social and environmental performance is defined by Wartick and Cochran (1985) is as a business organization’s configuration of principles of social responsibility, processes of social responsiveness, and policies, programs, and observable outcomes as they relate to the firm’s societal relationships.
2.2. Social and Environmental Disclosure
Social and environmental disclosure are defined broadly using the term corporate social disclosure is defined as the process of communicating the social and environmental effects of organizations' economic actions to particular interest groups within society and to society at large.(Gray, Owen and Adams, 1996, p. 3).Meanwhile, more specifically defined as Provision of financial and non-financial information relating to an organization's interaction with its physical and social environment, as stated in corporate annual reports or separate social reports. (Guthrie and Mathews, 1985, cited in Hackston and Milne, 1996, p. 78). Social and environmental disclosure is a process of communication as social and environmental impacts caused by the economic activity in the company's annual report or in a separate report, and it is her responsibility. What are expressed and measured in social and environmental disclosure revealed by JA Hall (2002) are: Corporate social disclosure is measured (in terms of number of sentences disclosed) in the areas of theme (environment, product, energy, community, employee health and safety, employee other and general) and evidence (monetary quantitative, non-monetary quantitative and declarative). So what was revealed about the social and environmental affected due to the company's operations include environmental issues, products, energy use, community around the company, health and safety personnel, other personnel issues of a general nature, and evidence both quantitative (monetary), non-monetary quantitative and declarative.
2.3. Economic Performance
186 and Marlin (1972) using the measurement basis of
accounting, the Earning Per Share (EPS) and Return on Equity (ROE), while Spicer (1978) using the measurement basis of accounting and measurement basis of the market, the profitability and price-earnings ratio. One of the limitations in the use of various measures of economic performance is the tendency to focus narrowly on just one aspect of the company's economic performance. Net income measures the profitability of a company without considering the scale of the company. This shortcoming can be addressed by using return on assets (ROA), as well as perform basic scaling on the profitability of the investment assets of the company (Al-Tuwaijri, 2004). However this measurement will be biased, if the samples come from a variety of industries with different levels of fixed assets used, and there is a systematic difference between the type of industry in the age of the assets it uses.
2.4. Environmental Exposure
Environmental exposure is an explanation or description of the environmental costs that may occur in the future (future environmental cost). Operationalization of this variable by measuring the amount of toxic waste produced divided by the amount of revenue generated by the company.
2.5. Environmental Concern
There is a perspective that is based on a stakeholder analysis that states the existence of a tension between the explicit costs (eg payments to bondholders), and implicit costs to other stakeholders (eg, product quality costs, environmental costs). This theory predicts that a company is trying to suppress the implicit cost actions that are not socially responsible, will lead to explicit costs are higher due to competitive disadvantage. Based on these reasons, there is a positive relationship between social and environmental performance with financial performance (SA Waddock and SB Graves, 1996). Expressed a view that this argument is a normative basis, but there is an emphasis to build a strategy that has significance importance of the core values of employees and other stakeholders are interconnected. This meaning-making is often called strategic intent (Hamel and Prahalad, 1989) referenced by Waddock and Graves (1996). He also explained that in some cases, the position of which is accompanied by a strategy of social management and other normative behavior therein provide a position of competitive advantage. New ideas on the strategic management has meant that attaches the purpose of social activities in a strategic position with regard to the way the results are positive strategies. In other words, this will have a positive impact on financial performance.
3. Hypothesis:
H1: Environmentalexposuremoderate the relationshipbetweensocialand environmental performance, socialand
environmentaldisclosureandeconomicperformance.
H2: Environmentalconcernsmoderate the relationshipbetweensocialand environmentalperformance, socialand
environmentaldisclosureandeconomicperformance.
H3: Socialand environmentalperformance, socialand environmentaldisclosure, environmentalexposure, environmentalconcernhas a positive effectoneconomicperformance.
4. Research Methods
This research isdescriptiveand verification. Descriptive researchisresearchthat aimstoobtaina description ofthe
characteristics ofsocialand
environmentaldisclosurevariables, socialand environmentalperformance.Environmentalexposure,environ mentalconcerns, andeconomicperformance. Whileverificationstudybasicallyusedto test the truthofa hypothesisthat iscarriedthrough the collectionof datafromfield.(Nasir, 1999: 78). Inthis study, theunit ofanalysis is thecompanythat operatesproducingoil and gasfromupstreamto downstream. Theobservationunitisthe largestoil and gasproducer(foreign private companies, nationalprivate companiesandstate-owned enterprises), which contributed more than90percent ofIndonesia'soil and gasproducts. Thus, the population istenlargestoil and gascompaniesthat produceoil and gasforthe benefit ofIndonesiamorethan90percent. The sampleisoil and gas
companiesofthe 8 largest
companiesthatpublishsustainableCSRreportingorreportinga s a mediumtoobtain dataasa secondarydata source.
1) Social and Environmental Disclosure)-ENVDISC
Inthis study, thedisclosure-scoring methodologybasedoncontent analysisby streamlining thedisclosure offourkey indicatorsofthe environment, namely(1) the totalamountof toxic wastegeneratedanddivertedor recycled, (2) financialpenaltiesfor violation ofrules set, (3) PotentiallyresponsibleParty(PRP), which isdefined responsibilitiesto cleanareasaffected byhazardouswaste,
and (4) reportthe presenceof
oilandchemicalspills(AlTuwaijri, etal.,2004). The highest standard (+3) for the quantitative disclosures relating to the four indicators above. The second standard (+2) is set to a non-quantitative disclosure but the information is specific and related to these indicators. Qualitative disclosures generally receive the standard value (+1). While the company did not disclose the indicator gets the default value (0). When a companyhasto take actionsagainst the negative impactson the environmentcaused byits activities, butdid notdisclose itinthe annualreport, thenumeratordisclosurescoresunchanged(0), while thedenominatordisclosurescoresincreased(+1), resulting ina decrease indisclosurescoresoverall. Totalqualityscores(minimum =0, maximum=+12) is thesumofthefour activities, thenthe measurementofthe totalamountof activitythat causespollutionto connectwiththecompany's productionprocess, resulting in scores(minimum =0, maximum=+4). Soscoresof socialand environmentaldisclosure(ENVDISCL) rangingfrom0to +3. (Al-Tuwaijri, et al., 2004).
2) Social and Environmental Performance)-
ENVPERF
187 amountof toxic wasteproduced bythe company(ENVPERF).
Ifacompanyintroducesapollutionabatementprocess, the total amountof toxic wastethat isgeneratedas the denominator decrease and ENVPERFincrease. Orif thecompanyadoptstherecyclingof toxic waste, then thenumeratorincreases, thusincreasingENVPERF. Sothe higher theratioover thetoxic wastethat is recycledto the overall waste, the better thecompany'ssocialand environmentalperformance. AlTuwaijrietal.,(2004).
3) Environmental exposure (ENVEXP)
Environmentalexposure(ENVEXP) is measuredas
theamountof toxic
wastegeneratedbyaimpartialcompanywithtotalrevenues. Amountof toxic wastethatgeneratesperdollarof U.S.salesthat
indicatepollutionintensityofproductionprocessesof the company.This sizeis expectedto be positively correlatedwithfutureenvironmentalcosts.
4) Environmental Concern (ENVCON)
The first characteristicisusedbyAl-Tuwaijri et al., (2004)is acommittee, which isanindicatorvariablethat has a codeone(1) ifthe companyhas aCorporate EnvironmentalCommittee/CEPor departmentgiven the responsibilityto monitorthe impact ofcorporate activityon the environment, otherwisecodedzero(0). The
secondcharacteristic, reports,
environmentalreportsmeasuring thefrequencypublicitystand-aloneorapartfromthe annualreport. Reportwill be coded(1,0) ifthe reportis publishedeachyear, (0.5) ifthe reportis publishedevery two years, (0.33) ifthe reportis publishedevery three years, and(0) ifthere is noreportpublished. The third characteristic, the program, isadiscretevariablethatmeasures thecompany's participation intheprogramis voluntarydefinedsocialdepartmentandother relevant departments. Due tomanagement's decision toimplementthese three activitiesis entirelyvoluntary, thenthese variablesprovideevidence ofmanagementawarenessof the importance ofprotecting the environment. As disclosedAl-Tuwaijri et al., (2004) predictedthatENVCONderivedfromthe analysis ofthe factorsthathave a positive relationshipwith thesocialand environmentalperformanceandsocialand
environmentaldisclosure.
5) Economic Performance (ECPERF) Measuring
economicperformanceusediseconomicperformancesuggest edbythe GlobalReporting Initiative(GRI), which isthe economicvaluegeneratedanddistributeddirectlyincludingreve nues, operatingcosts, employeecompentation, donationsand othercommunityinvestments, retained earnings, andpaymentstocapitalproviders andgovernments.
5. Result
5.1. Descriptive Analysis
Table 1
Data Summary of ENVDISC, ENVPERF, ENVEXP and ENVCON
Name ENVDISC
ENV PER
F ENVCON
ENV EXP
(1 )
(2
) (3) (%) C R Program ($/lb )
(1 )
(2 )
(3 )
BP plc
3 10 0.3
3 98 1 1 7 21 3 1.30
Chevron
3 11 0.2
7 88.4 1 1 7 21 3 1.32
Conoco
3 11 0.2
7 91 1 1 7 21 3 1.08 ExxonMob
il 3 11
0.2
7 88 1 1 7 21 3 1.07
Medco
3 10 0.3
3 65 1 1 7 21 3 0.58
Total
3 11 0.2
7 75.3 1 1 7 20 3 1.32 PetroChin
a 3 11
0.2
7 82 1 1 7 20 3 1.20 Premier
Oil 3 11
0.2
7 72 1 1 7 21 3 0.65
Mean
3 10 .8
0.2 9
82.4
6 1 1 7 21 3 1.07
Max
3 11 0.3
3 98 1 1 7 21 3 1.32
Min
10 0.2
7 65 20 0.58
1) The number
ofsocialandenvironmentaldisclosurescoreorthe presence ofenvironmentalconcern
2) Totalscoresof
socialandenvironmentaldisclosurequalityorexistenc e ofthe program(part of
theenvironmentalvariablesare concerned) 3) The
finalscoresofsocialandenvironmentaldisclosureorpr ogram.
In Table1the socialand environmentalquality ofdisclosurehasan average scoreof 10.75is ahigh scorebecause ofapproachingthe highest scoreof12. Thismeansthat thequality of thedisclosure ofmorequantitative, so avoid the disclosure ofqualitativeandallegedlyvery subjective. Thequality ofqualitativedisclosuresonlyon theindicatorexplanation ofthe existence ofa section ordepartmentthat is responsibleforcontrollingthe impact of wastethat are notexpressed inquantitativeform. Totalscoreson thesocialand environmentaldisclosureby an average of0.285. Is themaximumscoresof 0.33andthe lowestscoreis0.27. The total scoreiscalculatedbased onthe
sumscore ofthe existence
188 Thismeansthat thelevel ofdisclosure ofinformation relating
to theimpact ofexternalitiesis quitehigh, above themagnitude ofthe average scoredisclosure. Althoughwhen viewedin Table1islifted by ascore oftwooil and gascompanies, one of which is anational privateoil and gascompany(MedcoEnergy),
theseindicationsshowtheirseriousnesstodisclosesuch informationastheiraccountabilityto the negative impactsthat
occur. Onenvironmentalconcernis
measuredbyindicatorswhich includecommittees, reportsandprograms. Of theeight sampleseachpublisha reporteveryyearon the impact ofexternalitieson thesocialandenvironmentalcompanies, so thatthe value ofthe average scoreis1.The programisthe minimumnumber of programsset bythe EPAis alsoreferencedby theMinistry of Social Affairsand theMinistry of Environmentwhichconsistsofinfrastructure
constructionprogramsfor thepublic interestaroundthe company operates, greeningandenvironmental
conservationprograms, public
healthprogramsandenvironmentalimprovement, socialdevelopmentprograms,cultureandeducation,
localeconomicempowermentprograms, energy
efficiencyprograms, alternative
energydevelopmentprogramorrenewableenergy. Valueisthe average scoreof 3, so it canbe saidthatthey plannedprogramrunningeffectively. The weaknessinthis studyneeds to beconductedin-depth researchabout the typeandquality ofeach programas well ascontinuity. Environmentalexposureis measured bythe amountof wasteproduced bythe companyto the amount ofrevenue generated. Its average valueisU.S.$ 1.112foreachrevenue generatedissued1poundof waste. WhenseeninTable1, the highest valuewasU.S.$ 1.32/poundand the lowest wasU.S.$ 0.58/pound. Forthe lowestvaluereached byoil and gas companiestend toseekgasrather thanoil.
Table 2
Economic Performance Analysis
Name
Revenu e
Opr.Cos t
Div. interes
t taxes
(2)/(1 )
(3)/(1 )
(4)/(1 )
(1) (2) (3) (4) (5) (6) (7)
BP plc 301,397 270,240 21,154 10,47
5 90 7 3
Chevro
n 221,848 170,111 65
33,87
6 77 0 15
Conoco 197,839 167,988 1,644 28,34
6 85 1 14
Exxon 397,499 69,765 8,215 27,17
1 18 2 7
Medco 1,010 637 31 111 63 3 11
Total 193,250 163,048 15,565 1,134 84 8 1
PetroCh 131,989 83,872 640
16,77
0 64 0 13 Premier
Oil 618 162 38 121 26 6 20
Mean 180,681 115,723 5,919 14,75
0 63 3 10
Max 397,499 270,240 21,154 33,87
6 90 8 20
Min 618 162 31 111 18 0 1
(1), (2), (3) in million dollar US (4), (5), (6) in %
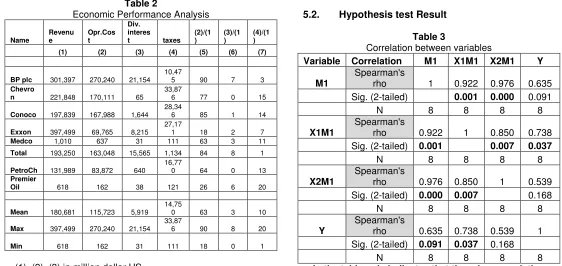
InTable2, the analysis ofeconomicperformanceindicatorsis representedbyrevenue, operatingcosts, paymentstocapitalproviders (dividends andinterest)andpaymentto government(taxes), GRI(2006). The highestrevenueachievedbyExxonMobil(397 499) while the lowestwas obtainedbyPremierOil(618, 17). This does notmeanthatExxonMobilbetter
becauserevenueinformationwould be meaninglessif notcompared tohow muchthe companyinvestedin fixed assetsthatthey use. Revenueinformationusedas the basisof analysisof
efficiencyandrevenuedistributiontootherstakeholders. The
magnitude ofthe
lowestpercentageofoperatingcoststorevenuewas17.55% achievedbyExxonMobil, while the highest89.65% achievedbyBritish Petroleum(BP), meaningthat theoil companyExxonMobilisthe eighthmost efficientofthese companies. However,whencompared to thelevel ofthe finalwasteproduced by the companyto the amount ofrevenue generated(environmental exposure), ExxonMobilproduce1poundof wasteforeveryU.S.$ 1.07of its revenue. MedcoEnergyas the onlynational privateoil and gascompaniesthat representthe targetpopulation, theoperatingcostsof its revenuereached63.11% are close to theaverage of63.25%. WhenlinkedwithitsENVEXPvalueof U.S.$ 0.58, meaningthat in order toget revenue58centsU.S., MedcoEnergyproduce1poundof wasteandthis valueis thelowestvalueofthe eightcompaniesintothe sample. Thedistribution ofthe largestrevenueforproviders of funds(dividends andinterest)
that isTOTALof8.05%andthe
smallestcompanyChevron(0.03%). While thedistribution ofthe largestrevenueforthe government(taxes), which isPremier Oil(19.50%) and the lowest is theTOTAL(0.59%). MedcoEnergypositionis3.06% (ranked fourth out ofeightcompanies) forproviding the fundsand10.95% (ranked fifthout ofeight firms) togovernment(taxes).
5.2. Hypothesis test Result
Table 3
Correlation between variables
Variable Correlation M1 X1M1 X2M1 Y
M1
Spearman's
rho 1 0.922 0.976 0.635 Sig. (2-tailed) 0.001 0.000 0.091
N 8 8 8 8
X1M1
Spearman's
rho 0.922 1 0.850 0.738
Sig. (2-tailed) 0.001 0.007 0.037
N 8 8 8 8
X2M1
Spearman's
rho 0.976 0.850 1 0.539
Sig. (2-tailed) 0.000 0.007 0.168
N 8 8 8 8
Y
Spearman's
rho 0.635 0.738 0.539 1 Sig. (2-tailed) 0.091 0.037 0.168
N 8 8 8 8
189 Testing the first hypothesis is statistically proven that there
are five relationship or correlation between variables with X1M1 M1, M1 with X2M1 variable, the variable X1M1 with X2M1, X1M1 with variable Y, with the M1 variable Y. each one individually, so that the null hypothesis (Ho) is accepted. It can be concluded that there is a relationship between environmental exposure variables (M1) with variable economic performance (Y). There is a relationship between environmental exposure variables (M1) with other independent variables, such as social and environmental performance variables (X1) and variable social and environmental disclosure (X2) that interact with environmental variables such as exposure variables X1 and X2 M1 M1,. There is a relationship between social and environmental performance variables that interact with environmental exposure variables with social and environmental disclosure variables that interact with environmental exposure variables. This suggests that environmental exposure variables, namely the disclosure of future environmental costs are calculated by comparing the waste generated an impartial company with total revenue, is directly related to social and environmental performace, social and environmental disclosure and to economic performance. Result of testing the first hypothesis can be interpreted that the company’s performance with regard to their responsibility towards the social and environmental impacts will be associated with externalities. Externalities impact is measured by the amount of future environmental costs contained in the concept of environmental exposure. Future environmental costs that arise will affect the company’s ability to generate profits in the future, thus affecting the financial (economic) performance. The second hypothesis testing, where the null hypothesis (H0) is the correlation between the independent variables (X1, X2, M2, and X2M2 X1M2) with the dependent variable Y, statistically rejected for the five independent variables were not significantly correlated with the dependent variable. This means that the environmental concerns variable not related the social and environmental performance, social and environmental disclosure and economic performance. On oil and gas companies are fixing the selling price based on the market price, then the explicit costs arising from the existence of the committee, publication of reports and programs for community are not affected. This is possible because of the amount of costs incurred for this relatively small compared to the amount of revenue.The programs established by the government to be run by the company, so that is mandatory. The programs are funded from the net income allowance (2%) of the company. Most of these programs are short term and are philanthropic.
Table 4
On the basis of hypothesis testing the regression of social and environmental performance (X1), social and environmental disclosure (X2), environmental exposure (M1), environmental concerns (M2), economic performance
(Y) and the variables interact with each other (X1M1, X1M2, X2M1, X2M2) obtained the result that the social and environmental performance variables (X1), and social and environmental disclosure (X2), which interacts with environmental exposure (M1) respectively or environmental exposure variables (M1) and economic performance variable (Y) has a significant relationship with one another. However, if the variables associated with environmental concern (M2), there was no correlation with these variables. Regression hypothesis test results did not prove there is the influence of the independent variables on economic performance (Y). This supports previous studies that only happens correlational relationship between the variables (X1, X2, M1, and Y).
6. Conclusion
Social and environmental performance in the ten highest producer of oil and gas companies in Indonesia, have an average value of 81.837%. This meansthat most of the waste generated from the company’s operations have been carried recycle and reuse..As for therest of the wastethat is notrecycledordisposed ofordinaryburntafter processingtoachievesafe limitsin accordancewith theprescribed rulesthatwasteKLHminimal impacton the
environment. Socialand
environmentaldisclosurequalityhavean average scoreof 10.75is ahigh scoreas it nears thetop scoreof12. Thismeansthat thequality of thedisclosure ofwhich ismorequantitative, so avoid thedisclosure ofqualitativeandallegedlyvery subjective. Hypothesis test resultsindicatethatthere are onlyrelationships betweensocialand environmentalperformance, socialand environmentaldisclosure, andeconomicperformance withthemoderating variableenvironmentalexposure. Butforthe regressionrelationshipwas not proventhere isthe influence oftheindependentvariableson theperformanceof economicvariables. Thissupportsprevious studiesthatonly happenscorrelationalrelationshipbetweenthese variables. The hypothesis test results that only the future environmental costs are associated with social and environmental performance as well as that disclosure, and economic performance. The programs launched by the government to support social and environmental performance of the company to gain legitimacy from community are not seeing. On the basis ofthe results ofthe descriptiveanalysisandthe analysis ofhypothesis testing, the externalityfactorshave an influence onthe socialandenvironmentalperformance, andeconomic performance.
7. Suggestion
Suggestions forfurther researchisdeepeningtheconcept ofenvironmentalconcern. Deepeningof thedeterminationandimplementation of theprogram can be doneby submitting aquestionnaire, ordirectobservationtodeterminethe typeandquality ofeach programas well ascontinuity. It is expected tostrengthen theconcept ofenvironmentalconcernmeasuresusefulin analyzingthe relationshipor influencewiththe concept ofsocialand environmentalperformance, socialand
environmentaldisclosure, as well
aswitheconomicperformance. Suggestions for theregulator(government) is necessary to Model Summary
.791a .626 -.311 .31362
Model 1
R R Square
Adjusted R Square
Std. Error of the Estimate
190 establishprogramsfor themedium and long termso thatthe
programsimplemented byoil and gascompaniesare not merelyphilanthropicusedas a propaganda tool, orgreenwash.
References
[1]. Al-Tuwaijri, Sulaiman A., Christensen. Theodore E., dan Hughes II K.E.,” The Relations among Environmental Disclosure, Environmental Performance, and Economic Perfomance: a Simultaneous Equations Approach”,Accounting, Organizations and Society, 29, 447-471. 2004
[2]. Bansal,P. and Clelland, I., “Talking trash: Legitimacy, impression management, and unsystematic risk in the context of natural environment”, Academy of Management Journal, Vol.47 No.1,pp.93-103.2004
[3]. Bebbington,J. and Gray,R., Accounting for the Environment, Sage Publication Ltd.2001
[4]. Bragdon and Marlin, “Is pollution profitable?”,Risk Management, 19(4), 9-18. 1972
[5]. Bronn, P.S. and Vidaver-Cohen,D., “Corporate motives for social initiative: Legitimacy, sustainability, or bottom line?”, Journal of Business Ethics, Vol.87, pp.91-109.2009.
[6]. Chung, Rae,K., “Prospects for Environmental Sustainability in Asia the Pasific”, in Pursuing Green Growth in Asia and The Pasific, Cengage Learning Asia Pte Ltd, 2010
[7]. Elkins,P. and Tomei,J.,” Eco-efficiency and Resource Productivity: Concepts, Indicators, and Trends in Asia-Pasific”, in PersuingGreen Growth in Asia and The Pasific, Cengage Learning Asia Pte Ltd, 2010
[8]. Gray,R.,Accounting and accountability: Changes and Challenges in Corporate Social and environmental Reporting, Prentice Hall International.1996.
[9]. Gray,R., Owen,D., and Adams,C.,Accounting and Accountability, Changes and challenges in corporate social and environmental reporting, Prentice Hall - London.1996
[10]. Gray,R.,Owen,D., and Mauders,K.,Corporate Social Reporting- Accounting and accountability, Prentice Hall-UK.1987
[11]. Global Reporting Initiatives (GRI).Sustainability Reporting Guidelines. 2006
[12]. Guthrie,J. and Mathews, M.R.,“Corporate Social Accounting in Australasia”,Reseatch in Corporate Social Performance and Policy, Vol 7, pp 251 – 277. 1985
[13]. Hackston and Milne,” Some determinants of social and environmental disclosures in New Zealand companies”,Accounting, Auditing and Accountability Journal, 77– 108. 1996.
[14]. Hamel,G. and Prahalad,C.K.. Competing for the Future, Harvard Business School Press, Boston, Massachusetts. 1994
[15]. JA Hall. A Disagreement about difference, s Malesevic& M. Haugaard,Eds. Making sense of collectivity: Ethicity, Nasionalism&Globalisation. Pluto. 181-194. 2002
[16]. Moh. Nazir..MetodePenelitian. Ghalia Indonesia. 2005
[17]. Solomon, A. and Lewis,L, “Incentives and disincentives for corporate environmental disclosure”, Business Strategy and the Environment, Vol.11 No.3, pp.154-160. 2002
[18]. Spicer,” Investors, corporate social performance and information disclosure: an empirical study”. The Accounting Review, 53, 94–111. 1978
[19]. Ullmann, A.,” Data in search of a theory: a critical examination of relationships among social performance, social responsibility, and economic performance of U.S. firms”,Academy of Management Review, 10, 540–557.1985.
[20]. Waddock,S.A., and Graves,S.B.,“The Corporate Social Performance – Financial Performance Link”,Strategic Management Journal, 18 (4): 303 -319. 1996