Licensed under Creative Common Page 315
http://ijecm.co.uk/
ISSN 2348 0386
ASSESSMENT OF HAZARDOUS WASTE MANAGEMENT
PROPOSAL: USING THE ANALYTIC HIERARCHY PROCESS
Mohsin Ali
School of Management & Economics (SME),
University of Electronic Science and Technology of China (UESTC), China &
International Islamic University, Islamabad, Pakistan mohsinali757@gmail.com
Amit Yadav
School of Management & Economics (SME),
University of Electronic Science and Technology of China (UESTC), China amitaryan2u@yahoo.com
Maira Anis
School of Management & Economics (SME),
University of Electronic Science and Technology of China (UESTC), China maira7pk@hotmail.com
Abstract
Rapid change in technology, increased disposable products either in electronic stuff or daily
used items, in result increased waste production. The waste that can affect any sort of life either
human beings, plants or sea life known as hazardous waste. The current era of technology
affected the quantity of hazardous waste in all over the USA (United State of America).
However, it is not an easy task for the government of USA to prepare well managed hazardous
waste proposal because the citizens, professionals and other concerned parties have their own
expectations which are difficult to come up with at a once. Even it is impossible to satisfy all
concern parties, it is preferred to have proposals conforming to the interest of the bulk and
beneficial to the present and future generation. This paper adopts the AHP (Analytical hierarchy
Licensed under Creative Common Page 316 MCDM (multi-criteria decision making) method for solving decision making problems in different
sectors such as social, government and corporate. From our findings, we found that northeast
region which ranked top on overall regions and Maine State is ranked top in all states of USA,
which need to take in consideration for sustainable hazardous waste management. It is also
recommended that other MCDM methods can also be applied to get comparative results. This
paper helps to give the sustainable hazardous waste proposal with the help of AHP, so that this
proposal can be used for the improvement of hazardous waste management.
Keywords: Hazardous waste, AHP, Multi-criteria decision making, Proposal, USA
INTRODUCTION
Hazardous waste is any type of unwanted material, the disposal of which causes a threat to the environment, i.e. it is explosive, flammable, poisonous, oxidizing, infectious, radioactive, corrosive and/or toxic. There are different sources of hazardous waste such as industrial waste, hospitals, timber treatment, petrol storage, metal finishing, paint manufacturing etc. These wastes can be treated chemically (i.e. by neutralization, oxidation, reduction, hydrolysis, precipitation), physically (i.e. encapsulation, separation), biologically using microorganisms or thermally by incineration. From those waste, most treated waste is then deposited in landfills. In 21st century, hazardous waste is one of the biggest problems facing by world as well as it is also
Licensed under Creative Common Page 317 Well-handled concerns of surrounding environment either in land, water or air, no threat to life leads us not to execute any site remediation, if the hazardous content at industrial, commercial and agricultural sites were properly handled, stored, transported and/or disposed of. With this concept in mind, this research is conducted to propose hazardous waste management proposal for achieving pollution prevention, well managed hazardous waste and all lives including human health protection in United States. Due to rapid development and improvement of various industrial technologies, products and practices frequently increase the production rate of hazardous waste. In order to ensure that the final proposal on hazardous waste is winning over, systematic and sophisticated method to make tradeoff decision is required. In deciding on the best method for managing any waste there is a hierarchy for decision making. Therefore, this paper boosts the use of analytical hierarchy process (AHP) in dealing with decision making challenges.
LITERATURE REVIEW
In deciding on the best method for managing any waste there is a hierarchy for decision making which addresses issues. It is applied to existing or advised practices, starting at the top of the hierarchy, examining and testing these at each level. Hazardous waste is one of the major factor which degrade environment and causes of pollution in country like USA. Different states have their own generation of hazardous waste, but by looking at number of generation cannot decide which state or which city need to be taken most in consideration for improvement in hazardous waste management. There must be different factors that can play their role in production of high or low quantity of hazardous waste. To handle such a complex situation, multi-criteria decision making (MCDM) methods are worthful for making important decisions that cannot be determined straightforwardly. It is necessary to know the general characteristics of different methods, in order to select the most advantageous method of this study. De Montis el al. (2000) conducted study shows a summary comparing the features of various MCDM methods and it can also be observed that AHP (Analytical Hierarchy Process) has fantabulous performance in dealing with interdependent criteria and the local problems involving both quantitative and qualitative issues.
Licensed under Creative Common Page 318 planning, energy, conflict resolution and arms control, health, material handling and purchasing, manufacturing system, passenger airlines selection, manpower selection and performance measurements (Saaty 1980, Saaty& Vargas 1982, Cook et al. 1984, Zahedi 1986, Shen et al., 1998, Cheng et al., 2005, Banai 2005, Amit 2015).Very few researchers have used MCDM method for hazardous waste decision making process. To structure complex problems in the form of a hierarchy or a set of integrates levels, MCDM method allows the decision makers to take the best decision (Robert 1992).Similarly, supplier selection problem can be solved with MCDM and had been widely used, out of which quantities criteria have been considered in the previous and existing decision models (Chen-Tung, Ching-Torng & Huanget 2006).This study concerning about the hazardous waste which is commonly considered as a social problem, anticipated that AHP is the suitable methods for analysis and findings (Chan and Lee 2007). The AHP has found widespread application in decision making problems and has the ability to structure complex, multi-person, multi-attribute and multi-period problems hierarchically (Liu & Hai 2005, Yusuff 2001). An AHP model is a hierarchical decision problems model that consists of multiple levels of criteria having simplex relationships developed by Saaty 1980. Generally hierarchy structure had been separated into three levels such as goal, criteria and alternatives. For this hazardous waste management problem, goal is to proposed sustainable hazardous waste management by finding the state and city in USA need to be taken in consideration for improvement of hazardous waste from criteria and alternatives taken for our analysis. The decision maker’s action based on the judgments concerning the importance of the criteria and which they are adjoin by each alternative. AHP methodology helps to rank the alternative courses by it respective weight. The mathematical calculation and proofs of AHP are developed by Saaty (1980). In AHP, pairwise comparison is an important step. The environmental performance of manufacturing process in the pulp manufacturing industry and investigated the suitability of various flexible manufacturing system and cellular manufacturing configuration system, AHP was used for decision making (Pineda 2002, Chan 1996).
These above study are the evidence that the AHP had been widely used in various sectors and its skillfulness is applicable in different areas. Hazardous waste is also a major problem and due to improper decision making process, still struggle with miss management and environment degradation. To give proper decision and to propose sustainable hazardous waste management this study is taken in consideration. This research is separated into five parts, first gives the brief about hazardous waste, 2nd explain brief about previous study using AHP, 3rd
shows the steps followed and data is analyzed, 4th explain the result finding from analysis and
Licensed under Creative Common Page 319
METHODOLOGY
This research has been conducted using the secondary data from Right to Know Network (RTKNET), a data base for hazardous waste generated, managed, treated and shipped off for all states of USA from 1989 till todate. The objective of this research is to evaluate the current situation of hazardous waste management in different states of USA. For analysis only data of 2011 (last updated data) has been taken, so that to analyze latest hazardous waste condition of each region as well as each state of USA. The region consists of areas of land that have common features such as natural, geographic features (forests, wildlife or climate). There are total 5 regions and 50 states of USA has been considered in this study. The quantity of generation of hazardous waste data has been collected with the help of The Biennial Reporting System (BRS) and this is one of the EPA’s (Environmental Protection Agency) primary tools for tracking the generation, shipment and receipt of hazardous waste. This data information contains from the Hazardous Waste Report that must be filled every two year under the RCRA (the Resource Conservation and Recovery Act) program. RCRA is the federal statute that regulates the generation, treatment, storage, disposal or recycle of solid and hazardous waste. The quantity of generation of hazardous waste can be affected by different factors i.e., economy (GDP, Per Capita Income, etc, population (Density, Age, Gender, familiar about hazardous waste, literacy rate, etc), area (percentage land area or water area, domestic area, industrial area, rural, urban, etc).
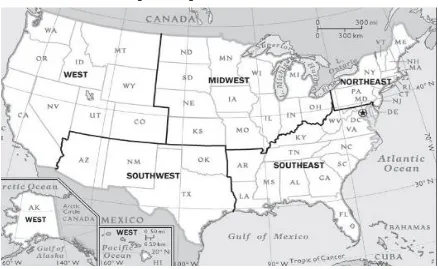
Licensed under Creative Common Page 320 Data is given in tons by RTKNET and those values were taken for our analysis. Each region and each state overall value is given for throughout the year of 2011. These regions are The West, The Southwest, The Midwest, The Southeast and The Northeast (Fig 1). Sate names of USA have been mentioned in hierarchy structure (Fig 2).To find the quantity of hazardous waste generated by per person in each region, divide the total generated hazardous waste by each region with total number of population in that region (eq 1). Similarly, to find the per person hazardous waste generation in each state is calculated. As the data is scattered, therefore, it has been preprocessed for analysis after collected from RTKNET. Static normalization is applied to normalize the scattered data (eq 2). Each column of hazardous waste generation is divided by its maximum value to get the normalized data.
Per person hazardous waste generation = waste generated (Tons)/ Population …… (1)
Scaling formula used, F(x) = (a+X)*(b-a)/(Max B-Min A). . . (2)
Whereas, a = the minimum scaling value, b= maximum scaling value, Min A= minimum value in
data, Max B = maximum value in data and X= value of variable.
There are many scales that could be used for judgment process but for AHP the scale given by Saaty (1980) is considered as standard. This step is followed because hazardous waste generation depends on population. Pairwise comparison is an important step in AHP, which is completed with the help of experts. Especially when a large number of criteria or alternatives are involved, AHP is widely criticized for such deadening process. Because people are very likely to feel tired during decision making process and lose patience and may not make their judgments scrupulously. In this research study, data are secondary data taken for findings. So, we will not face problems of missing or loosing data.
Licensed under Creative Common Page 321 Table 1: The Saaty (1980) rating scale
Intensity of
importance Definition Explanation
1 Equal importance Two factors contribute equally to the objective
3 Somewhat more important Experience and judgement slightly favour one over the other. 5 Much more important Experience and judgement strongly favour one over the other.
7 Very much more important Experience and judgement very strongly favour one over the other. Its importance is demonstrated in practice.
9 Absolutely more important. The evidence favouring one over the other is of the highest possible validity.
2,4,6,8 Intermediate values When compromise is needed
The steps of the hierarchies of goal, criteria, sub criteria and alternatives as required in the AHP helped by identifying the variables and in figure 2 have mentioned the hierarchical structure of this paper. Pairwise comparisons express the relative importance of once item against another in meeting a goal or criteria. An appraisal of the ratio of the weight of the two criteria being compared is represented by pairwise comparison. This ration scale for processing human judgments had been implemented to various decision making problems in other fields. Ratio scale is utilized by AHP and the alternative weights contemplate the relative importance of the criteria in achieving the goal.
Licensed under Creative Common Page 322
ANALYSIS AND FINDINGS
Sustainable hazardous waste management is one of the important factors for developed country like USA to give healthy environment. As country moving towards development, we still think that there is lack efficient thoughtful planning for hazardous waste. Preparing sustainable hazardous waste management proposal still have to make an effort to work out the detailed design based on the resources available. At the design process needs to balance the interest of different parties and make lot of tradeoff decisions as it is impossible for hazardous waste proposal to satisfy all affected citizens and concerned groups having their own condition, desire and expectations in which come of them many belie one another, cannot be fully meet with existing resources. So, to ensure that appropriate tradeoff decisions are made and sustainable hazardous waste management proposal is prepares, practitioners have to think over various design criteria and identify those that can effectively contribute to sustainable development and satisfy the majority.
Table 2: Pair wise comparison between the regions and their weight and rank
From our research discussion, we decided to use eq.1 so that analysis result will be more satisfied. From data we saw that small city have less waste production and large city with more population, better economic condition have much high waste production. Data variation was much high and much low in some condition. Using eq.1, this problem had been fixed and our data analysis result is much better shown in table 3.
Table 3 demonstrates the absolute weights of the sustainable hazardous weight objectives, final weights of the criteria and ranking is done after calculating the data. In table 2, results show that the northeast region with local weight (0.8265) had been prioritized as the first rank region produce more hazardous waste than that of other region. The northeast region should be considered in top most priority for improvement and sustainable hazardous waste management for USA followed by the west region local weight (0.1531) is ranked 2nd, the
southeast region local weight (0.0153) is ranked 3rd, the Midwest region local weight (0.0051) is
ranked 4th and last (5th) is ranked to the southwest region with local weight (0.00084181).
Regions West Southwest Midwest Southeast Northeast weight Rank
West 1 0.5 0.5 0.2 0.11 0.1531 2
Southwest 2 1 1 0.5 0.33 0.00084 5
Midwest 2 1 1 1 0.5 0.0051 4
Southeast 5 2 1 1 1 0.0153 3
Licensed under Creative Common Page 323 Table 3. The final weight & rank of regions and states of USA for the sustainable
hazardous waste management and design criteria
Region Region weight State State Weight Global Weight Rank
T he W es t 0.1 5 31
A1 0.0001 0.00001531 43 A2 0.00026 0.000039806 37 A3 0.0083 0.00127073 15 A4 0.0083 0.00127073 16 A5 0.0167 0.00255677 13 A6 0.0333 0.00509823 9 A7 0.0666 0.01019646 5 A8 0.0666 0.01019646 6 A9 0.0833 0.01275323 4 A10 0.1166 0.01785146 3 A11 0.5998 0.09182938 2
T he S ou thwes t 0.0 0 08 4
18 B1 0.00052 0.000000438 50 B2 0.001 0.000000842 48 B3 0.0868 0.000073069 33 B4 0.9116 0.000767394 18
T he M idw es t 0.0 0 51
C1 0.00014 0.000000714 49 C2 0.0011 0.00000561 46 C3 0.0026 0.00001326 44 C4 0.0026 0.00001326 45 C5 0.0053 0.00002703 38 C6 0.0053 0.00002703 39 C7 0.0053 0.00002703 40 C8 0.0053 0.00002703 41 C9 0.0053 0.00002703 42 C10 0.0105 0.00005355 34 C11 0.0105 0.00005355 35 C12 0.9462 0.00482562 10
T he s ou the as t 0.0 1 53
D1 0.00021 0.000003213 47 D2 0.00342 0.000052326 36 D3 0.00834 0.000127602 31 D4 0.01446 0.000221238 28 D5 0.0265 0.00040545 24 D6 0.0265 0.00040545 25 D7 0.033 0.0005049 22 D8 0.033 0.0005049 23 D9 0.078 0.0011934 17 D10 0.1517 0.00232101 14 D11 0.2925 0.00447525 11 D12 0.4388 0.00671364 7
T he Nor the as t 0.8 2 65
Licensed under Creative Common Page 324 E5 0.00028 0.00023142 27
E6 0.00085 0.000702525 19 E7 0.00085 0.000702525 20 E8 0.00085 0.000702525 21 E9 0.0034 0.0028101 12 E10 0.0064 0.0052896 8 E11 0.987 0.8157555 1
DISCUSSION
AHP steps are followed for analysis as mentioned above in literature and methodology. After complete mathematical calculation, comparison of each region and state of USA (Figure 1) is done and allocating those weights for each region as well as states in each level is performed. According to largest weight value of region, it would be most important for consider for the sustainable hazardous waste management. These regions and states are ranked according to weight value shown in table 1. After calculating global weight for the state of each region, it is overall ranked with respect to global weight value as given in table 1. From the above result, we can also see that the region with large areas have large number of population and these regions states are well equipped with good economic condition which is also major causes of production of hazardous waste. Hazardous waste production is also causes due to number of industrial area, its disposed waste and way of treatment process of waste from those industries.
According to global weight in table 1, we have ranked state (figure 1) of USA as highest weight is on top or ranked as 1st and respectively in descending order. Table 1 give the
finalized AHP decision model for bringing on sustainable hazardous waste management for USA. The ranking list of state can be seen that Maine state of the northeast, the state of the west Idaho, Alaska, Montana, Colorado, Wyoming have taken over the top most ranking in the list. The top ranking state is Maine (0.8157555) belongs to northeast region have population 1,222,000 produce 2,495 tons of hazardous waste. Similarly, 2nd rank is the Idaho (0.09182938)
lies to the west region have population 1,014,000 produce 3,742 tons of hazardous waste, 3rd
rank is Alaska (0.01785146) also belongs to the west region have population 527,000 produce 2,523 tons of hazardous waste, 4th rank Montana (0.01275323) is also in the west region have
population 806,000 produce 5,883 tons of hazardous waste. At the bottom end, 47th rank is
Mississippi (0.000003213) belongs to the southeast region have population 2,621,000 produce 1,828,969 tons of hazardous waste, 48th rank New Mexico (0.000000842) is in the southwest
region have population 1,528,000 produce 1,037,437 tons, 49th rank Iowa (0.000000714) is in
the Midwest region have population 2,840,000 produce 4,399,787 tons and last 50th rank is
Licensed under Creative Common Page 325 Texas (0.000000438) belongs in the southwest region have population 16,991,000 produce 15,683,408 tons of hazardous waste.
From our result, we observed that the state and region with large population produce large amount of hazardous waste but those state have well managed hazardous waste than that of less populated area. Even in less population and less developed areas produce much less amount of hazardous waste in comparison to the larger ones but due to mismanagement as well as avoidance this small amount are causing vulnerable to the state because those states are mostly in the top order in ranking table. We can also see that global weight values are taken in to 9 decimal values, this is because of our large number of state and its weight value varies with very less difference.
CONCLUSION AND RECOMMENDATION
Licensed under Creative Common Page 326 As mention above that AHP is not only the best method for solving daily decision problems. It has been suggested that in future, other MCDM methods can be applied to determine best evaluation methods for hazardous waste management. Comparative study of different models can also lead us to hazardous waste free region. So that it will be clearer and result will be more transparent that will be helpful for the decision makers. This also will help to know that which factor need to take in consideration for more accurate result and which method is good for such type of result findings.
The data we have taken for findings from RTKNET with limitation under the act of RCRA (Resource Conservation and Recovery Act). Choosing AHP for judgment process, relative importance of the sustainable hazardous waste management objectives and design criteria can be identified. The final weight of regions and states is very useful for assessing the sustainability level the potential hazardous waste management proposal in future. It can help EPA (Environmental Protection Agency) US to take decision related to finance as well as to manage the hazardous waste and can also help government to make policies for coming generations.
REFERENCES
Amit Y., Maria A., Mohsin A. and Sadhana T 2015. Analytical Hierarchy Process (AHP) for Analysis: Selection of Passenger Airlines for Gulf Country. International Journal of Scientific and Engineering Research. 6(3), 379-383.
Banai, R. 2005. Anthropocentric problem solving in planning and design, with analytic hierarchy process. Journal of Architectural and Planning Research, 22, 107–120.
Chan, F.T.S., and Abhary, K. (1996). Design and evaluation of automated cellular manufacturing systems with simulation modeling and AHP approach: a case study. Integrated Manufacturing Systems. 7(6), pp. 39-52.
Chan, E. H. W., Lee, G. K. L. (2007). Critical factors for improving social sustainability of urban renewal projects. Social Indicators Research, published online (DOI: 10.1007/s11205-007-9089-3).
Cheng, E. W. L., Li, H. and Yu, L. 2005. The Analytic Network Process (ANP) approach to location selection: A shopping mall illustration. Construction Innovation, 5, 83–97.
Chen, Chen, Ching Lin, and Sue Huang. "A fuzzy approach for supplier evaluation and selection in supply chain management." Int. J. Production Economics 102, no. 2 (2006): 289-301.
Chui, E. (2003). Unmasking the ‘‘Naturalness’’ of ‘‘Community Eclipse’’: The case of Hong Kong. Community Development Journal, 38, 151–163.
Cook, T., Falchi, P. and Mariano, R. 1984. An urban allocation model combining time series and analytic hierarchical methods. Management Science, 30, 198–208.
Cooke, S., and Slack, N. (1991). Making management decision (2nd edition). United Kingdom: Prentice Hall.
De Montis, A., De Toro, P., Droste-Franke, B., Omann, I., Stagl, S. (2000). Criteria for quality assessment of MCDA methods. In: 3rd Biennial Conference of the European Society for Ecological Economics. ESEE, Vienna, 3–6 May 2000.
Licensed under Creative Common Page 327 Grace K.L. Lee, Edwin H. W. Chan 2008. The Analytic Hierarchy Process (AHP) Approach for Assessment of Urban renewal Proposals. Springer Science+Business Media B. V. 2007. Soc Indic Res (2008) 89:155-168 DOI 10.1007/s11205-007-9228-x.
Liu, Fuh, and Hui Hai. "The voting analytic hierarchy process method for selecting supplier." International Journal of Production Economics 97, no.3 (2005): 308-17.
Ng, M. K., Cook, A., Chui, E. W. T. (2001) The road not travelled: A sustainable urban regeneration strategy for Hong Kong. Planning Practice and Research, 16, 171–183.
Pineda-Henson, R., Culaba, A. B., and Mendoza, G.A. (2002). Evaluating environmental performance of pulp and paper manufacturing using the analytic hierarchy process and life cycle assessment. Journal of Industrial Ecology, 6(1) pp. 15-28.
Robert L, Nydick, Hill & Ronald Paul (1992). Using the Analytic Hierarchy Process to Structure the Supplier Selection Procedure. International Journal of Purchasing and Materials Management; Spring 1992; 28, 2; ABI/INFORM Global pg. 31.
Saaty, T. L. 1980. The analytical hierarchy process: Planning, priority setting, resource allocation. McGraw-Hill, New York.
Saaty, T. L. and Vargas, L.G. (1982). The logic of priorities: Applications in business, energy, health, and transportation. United States: Kluwer-Nijhof Publishing.
Shen, Q., Lo, K. K., Wang, Q. 1998. Priority setting in maintenance: A modified multi attribute approach using analytical hierarchy process. Construction Management and Economics, 16, 694–702.
Yusuff,Rosnah, Kok Yee, and M Hashmi. "A preliminary study on the potential use of the analytical hierarchical process (AHP) to predict advanced manufacturing technology (AMT) implementation." Robotics and Computer Integrated Manufacturing 17, no.5 (2001): 421-27.