Classification And Detection Of Diabetic
Retinopathy Using Deep Learning
G. Sai Sudha , M. Praveena, G.Sandhya Rani , T.N.S.K. Harish, A. Charisma, A. Asish
Abstract: Diabetic Retinopathy is a common disease seen in citizens suffering with Diabetes mellitus. DR is a disease which is related to vision. This disease doesn’t have any symptoms, lack of symptoms may lead to loss of vision of the patient directly. DR can be detected only by testing the retina of the patient. The main objective of this paper to make the detection easy using deep learning and CNN in particular. This CNN and some other important deep learning techniques make doctor’s work easy, but strict analysis validation and testing is required before incurring it onto patient directly.
Index Terms: Deep Learning (DL), Neural Networks, Medical Image Classification, Convolution Learning, weight, feature matrix, feature map, filter, kernel
—————————— ——————————
1
INTRODUCTION
Diabetes is a disease which is divided further into two types. They are Diabetes Mellitus and Diabetes Insipidus. Diabetes Mellitus is caused due to the low secretion of hormone insulin in pancreas. This situation may lead the fluctuation of concentration of glucose levels in blood. The situation of variant levels of blood glucose levels is known as diabetes mellitus. The Diabetes Mellitus is the elite cause of the disease Diabetic Retinopathy. [1] Glucose levels in the blood when increased continuously leads to the damage of blood vessels. If this damage of blood vessels is near retina, this condition is known as Diabetic retinopathy. Retina is a inner part of eye where light rays from the outer surface is focused and signals is being sent to the brain.
There are several types of Diabetic Retinopathy each type has some basic building blocks. Those building blocks are
1) Micro aneurysm
2) Exudates
3) Cotton wool spots
4) Loss of Blood capillaries
5) Hemorrhage
6) Over formation of Blood capillaries
These building block leads to different stages or severity of the disease. Micro Aneurysm is a small bulging, near blood vessels. In diabetic patients, Sometimes micro aneurysms are seen through scanning in the retinal region. These small amount of aneurysms can generate a friction and blood leakage. An Exudate is a fluid that flow in the circulatory system into wounds or areas of puffiness. It is a fluid that is similar to the fluid generated through dead cells or . In the constraint of an wound, feat skin exposed, leakage from the blood vessels to tissues. The fluid is comprises of fluids like serum, white blood cells.
A Hemorrhage is a blood leakage from a constituent blood capillary. All the features constitutes to the lesion in the retina. These lesions leads to the loss of vision of people with severe diabetes. They can find dark spots but not exact clear images.
i) Types of DR:
DR is classified into 4 different types, named as Mild Non-Proliferative DR (NPDR), Moderate NPDR, Severe NPDR and Proliferative DR. [2] If detection of micro aneurysms is done in the retina, the patient is declared to have Mild NPDR. One of the severe NPDR characteristics is more than 20 retinal hemorrhages found in four various image planes Moreover, revascularization or new vessel is found on retina in the condition of Proliferative DR
Fig 1. No DR Fig 2. Mild DR
Fig 3. Moderate DR Fig 4. Severe DR
Fig 5. Proliferative DR
_________________________________
• Sai Sudha Gadde is currently working as Associate Professor inComputer Science and Engineering in Koneru Lakshmaiah EducationFoundation, India, E-mail: [email protected] • Praveena Mandapati is currently working as Associate Professor
inComputer Science and Engineering in Koneru Lakshmaiah
EducationFoundation, India, E-mail:
3187
ii)Preference of deep learning over other Algorithms
Detection and classification of a disease can be done in many techniques. Classify the features using ID3 algorithm or using SVM algorithm or using Random forest algorithm or naive Bayes classifier. To use this classifiers Image need to be measured and features of each image is to be generated. Each feature is to be given to train the classifier. [3] The main advantage of Deep Learning is features are not manually extracted but the image can be directly provided to the classifier for training. Deep learning has several layers of neural networks which filters the given input image and final result is given. Deep Learning Neural Networks contains several types such as CNN( convolution neural networks), RNN ,etc.
2
OVER
VIEW
OF
DEEP
LEARNING
When we pass image as our input to Deep learning networks. There will some filters which will recognize our image. The constitution of these filters depends on the features we extract such as Area of the pixel , perimeter, eccentricity, mean, aspect ratio, compactness, entropy. These features help the filters to correctly identify and classify the lesion regions
i)Pre Processing
Data is provided as an image of a retina, so the preprocessing needs to be done to the image. There are several stages in the pre processing
They are
I. Green channel extraction II. Optic disc removal III. Blood vessel extraction.
I) Green channel Extraction:
Any image is formed using three different color combinations RGB (Red Green Blue).[4] The contrast of the image is good and clear in green channel compared to the other channel, so the pixels in the green channel range are extracted and sent to the next layer. This step is done using filters.
Fig 6. retinal image. Fig 7. green Channel extracted
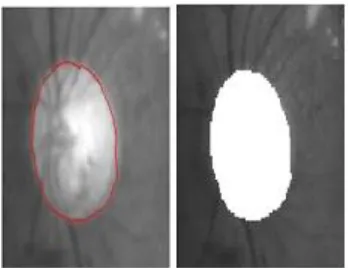
II) Removal of optic disc:
Optic Disc removal is the most important part of the pre Processing because these Optic disc’s and blood vessels lead to mis guidance in the detection of Bright and dark Wounds, Since the blood vessels looks dark threaded structures in scanned image it is easy to remove dark lesion’s just by removing those dark threaded parts and this faulty removal may lead to the removal of bright lesion’s. This process is done the same methodology of convolution by forming appropriate filters for these optic disc and blood vessels. In majority cases the pixel size is 11 x 11.
Fig 8. optic disc active Fig 9. optic disc removed
III) Extraction of exudates:
Exudates as earlier mentioned they are like a tissue near retina, since they are tissues in images they can be represented as a circular part with some irregular boundaries, since each image is represented in the form of pixel, the processing part which includes the extraction of the exudates are also done in the form of pixels.[5] A pixel is a part of a two dimensional plane whose co ordinates are generalized as (a,b) .Pixels which are adjacent to the pointed pixel has the following 2 dimensional co ordinates of the plane. They are (a, b-1), (a, b+1), (a-1, b), (a+1, b).[6] To extract the exudate part, the mathematical part which is going to be used is relative difference in the pixel intensity. The pixel Intensity for the specified pixel ―P‖ and the pixel Intensity for the neighboring pixel ―Pi‖ is calculated. If the relative difference is below the threshold value then it concludes that the region is absence of exudates and this pixels are merged with a medium pixel contrast, If the difference is greater than the threshold value that part is feature mapped to next layer . This will lead to the extraction of Exudates.
3
CLASSIFICATION
USING
CNN
1) Convolution layer:
This is the primary layer which extracts the features of input. This contains several filters(kernel). It learns the input image and each filter is convolved against it, so that the feature extraction is done by forming feature maps. Every layer represents a different feature. It is a differential operation that[19] considers image matrix and a filter as ip
• A Matrix that represents an Image comprises of 3 dimensions(H*W*D)
• A filter (𝑓ℎ*𝑓𝑤*d)
• Output is =
(H-𝐹ℎ+1)*(W- 𝐹+1)*1
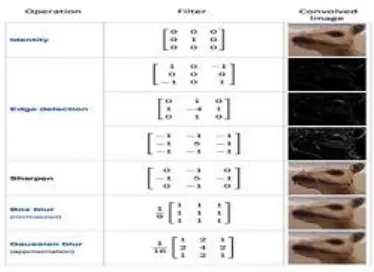
The convolution part of a layer in an image with various kernel matrices can perform works like blur ,edge detection and sharpen by making use of filters.
Fig 10: some common filter
2) Pooling layer:
Pooling layer is a discretization process and is used to grab the key parameters when the input images are large to learn
and provides basic reduction of them to internal
representation, thus it reduces the complexity. [9] Spatial pooling can reduce the dimensionality but retains the important information. It consists of several types of spatial Pooling namely
• Max Pooling
• Average pooling
• Sum Pooling
Fig 11: Pooling
3) Rectification layer:
Rectification layer adds a specific non linear functionality to each layer to avoid the linear passage in the neural net, Compared to Sigmoid and regressive functions ,[10] ReLU
trains [20] Deep neural network with appropriate functionality. Let Kth layer is the rectification layer and it considers activation volume 𝑋 (𝑘−1) from a Non-Linear layer (k-1) and generates the modified activation volume 𝑋(𝑘):
𝑋(𝑘) = |𝑋(𝑘−1) |
𝑖 𝑖
These operations will not change the input parameters and input constraints and their merger lead to a single layer The output is f(X)= Max (0, X).
Fig 12: Relu Activation
4) Fully Connected Layer:
The resultant matrix from the above layers is converted into vector and fed into a fully connected neural net. This is used to perform high level reasoning after various iterations of convolution and Max pooling . It connects to each and every neuron. We have an activation function to classify the outputs
5) Classification Layer:
After processing through multiple layers, it is the final layer which classifies the fundus image.
4
METHODOLOGY
Steps involved in this methodology are:
Steps:
I) Feature extraction
• Convolution
• Activation
• Pooling
II) Classification
• Flattering
• Fully connectedness
• Prediction
3189
Step1:
Prepare a dataset of images:
i) When the image is provided as a input then it will be
visualized in a matrix form.
ii) A matrix which is 3 dimensional. Dimension-1 ->
height of the image Dimension-2 -> width of the image Dimension-3 -> depth of the image
iii) Depth of the image is number of layers in the image,
i.e red, green, blue.
iv) The values in each box of the matrix is the pixel
intensity of the color of red, green, blue.
v) Pixel intensity is in the range [0,255].
vi) Here we have 8 bit or 1 byte sized pixels.
Step2:
Pre-processing
i) Extraction of feature maps or filters using gradient
descent.
ii) Gradient descent in neural networks is implemented
with back propagation.
iii) This gradient descent [12] is helpful in learning the weights and values of each box in the matrix.
Mathematically the above context is formulated as
with negative likelihood
Step3:
3.1) Convolution
Analogies: weight =feature matrix =feature map = filter = kernelThe process of convolution is to take a matrix and multiply it as a dot product by all its values in this matrix at a certain region.[13] Then multiply the receptive field with input image by sliding over it
The obtained output is sent through the activation function which in turn is sent to the next layer
i) Dot product between receptive field and input image:
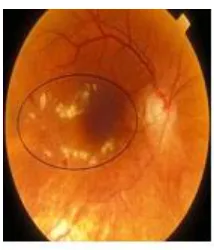
Let’s consider a exudates image
Fig 13. Exudate
This is represented as matrix form
0 0 30 30 0 0
0 30 0 0 30 0
0 30 0 0 30 0
0 30 0 0 30 0
0 0 30 30 0 0
0 0 0 0 0 0
Let’s consider a Retina image
Fig 14. Retina
This is represented as matrix form
When we slide our exudates feature map with retina image multiplication and summation takes place
(30*30) + (30*30) + (30*30) + (30*30) + (30*30) + (30*30) +
(30*30) +(30*30) +(25*0) +(08*0) +(20*0) +(50*0)
=8*900=7200.
Mathematically the above convolution operation can be given in two ways
1) Continuous form
2) Discrete form
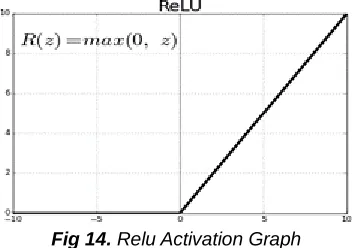
3.2) Activation
The main aim of the activation function is the unnecessary indications of our image matrix should be nullified For this purpose here [14] ReLU activation function is used
Fig 14. Relu Activation Graph
F(Z)=0 Z<0, F(Z)=Z Z>=0 , Range [0, ∞)
3.3) Pooling:
when the dot product of the input matrix and feature map then the result will be huge matrix. So that it increases computation cost.[15] To decrease it pooling is used to scale down large to smaller matrix and vice versa.
3.4) Flattering:
The ultimate result is flattered into two-dimensional vector. This flattering is useful for the reset process [16] of fully connected network.
3.5) Fully connected network:
Since we scale down all the image to our requirement. This network converts the vector to [17] check probability for which class it belongs to.
3.6) Prediction:
Prediction is done for our outfit and hence from the training set it could classify which class our disease belongs to the above description mathematically is
SCORES -> PROBABILITIES
MAXARG(S(Y_ssJ)) IS CONSIDERED AS CLASS OF THE OUTPUT.
5
EXPERIMENTAL
RESULTS
The following results provide performance of the neural networks for the DR classification and detection in various platforms such as Jupyter and Mat Lab
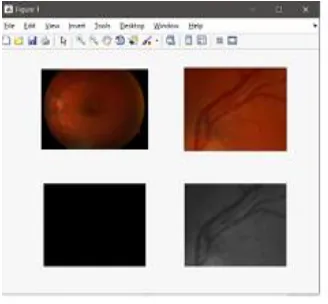
Fig 15. Performance and epochs of neural net in Matlab.
Fig 16 . Training of a sample fundus image and RGB layers.
8 6 1 3
0 4 13 9
2 5 17 95
1 46 74 27
8 13
46 95
3191 Fig 17. Training of a sample fundus image and RGB layers.
Fig 18. Performance and accuracy of CNN through jupyter notebook
Fig 19 . Results showing that the test fundus is not a haemorhage and it has DR.
6
CONCLUSION
In this paper a research is made about Diabetic Retinopathy, The conclusion is as follows , Mostly middle aged people are effected with DR. it cannot be detected in the earlier stages because they don’t have any symptoms, the only prevention of regular control in blood glucose levels . Cure is only done through effective diagnosis and they are made through the latest technological developments of neural networks whose efficiency levels are quite more compared to regular
classification techniques
7
REFERENCES
[1]. Xiao Liang wang, yangqin Lu, Yujan Wang, Wei-Bang
Chen as a paper on ―Diabetic retinopathy stage classification using Convolutional Neural Networks‖ in 2018 IEEE International conference on Information usage and data science Integration. Pg.: 1-8
[2]. YUNLEI SUN college of computer and communication
engineering, china university of petroleum (East china). As a paper on ―The Neural Network of
One-Dimensional Convolution-An Example of the
Diagnosis of Diabetic Retinopathy‖ in IEEE special section on Healthcare information technology. Pg. 1:6
[3]. 3) Rafael Ortis-Feregrino, sauil Tovar Arriag
IEEE senior members at factulad de ingeneria, at Universidad autonama de querstaro, Mexico , an IEEE 2018 survey.
[4]. C.R. Chan and J. Dheeba ―detection of exudates in
fundus images‖, vol 8, no. 26,2015.
[5]. Mobeen-ur-rehman, sharzil haris khan, Zeeshan
abbas ―classification of Diabetic Retinopathy Images
based on customized CNN Architecture‖
[6]. Harry Pratt, Frans coenen, Deborah M Broad Bent,
Simon as a paper on ―Convolution Neural Networks
for Diabetic retinopathy ―at International conference on medical Imaging understanding and analysis 2016.
[7]. Maya kv, Adarsh KS, as a paper on ―Detection of
Retinal lesions Based on Deep learning for DR‖ at
conference of advanced medical science.pg 10:20
[8]. 8) Foracchia, Grisan and Rugeri, as a paper on
―detection of optic disc in retinal images by geometrical model of vessel structure‖, IEEE Transaction of medical imaging, vol 23, no. 10, 2004
[9]. X. Chen, B. Wu as a paper on ―Automatic detection of
micro aneurysms in fundus images‖, computerized medical imaging vol 55, pp 106-112, 2018
[10].Zisserman as a paper on ―Deep convolution networks
for image classification‖ International conference on learning representations, pp. 1-14, 2015
[11]. Neethu Radha Gopan ―Automatic Detection of Diabetic
Retinopathy using R-CNN‖ at IRJET vol 6, I: 5, may 2019.
[12].Acharya, Kr. Sharma as a paper on ―Automatic
computer aided diagnosis for early DR detection and monitoring‖, IC-GET 2016.
[13].Ratul Ghosh, Kunal Ghosh, sanjit maitra as a paper
on ―Automatic detection and classification of Diabetic
retinopathy using CNN‖ at 4th international
conference on signal processing and integrated networks spin, oct 2017. Pg. 1-5
[14]. Maisha Maliha, ahmed tareque, Sourav saha Roy as a paper on ―Diabetic retinopathy detection using machine Learning‖, pg.: 1- 14, BRAC university.
[15]. Prajit Ramachandran, Barret Zoph, and Quoc
[16].Le. 2017. Searching for activation functions. CoRR, abs/1710.05941.
[17].Rui Wang, Wei Li, Runnan Qin and Jianzhong Wu
―Blur Image Classification based on Deep Learning‖, IEEE, ISBN 978- 1-5386-1621-5 pp. 1-6, 2017.
Meeting, ISBN 978- 1-5386-2213-1, pp. 1-5, 2017.
[19]. Satej W, Alamelu M, Santosh Kumar V (2013) An
improved medical image classification model using data mining techniques. In: IEEE GCC Conference and exhibition, Doha, Qatar,17–20 Nov.
[20]. SachchidSingh, Nirmala Singh ―Object Classification
to Analyze Medical Imaging Data using Deep Learning‖, International Conference (ICIIECS), ISBN 978-1-5090- 3295-2, pp. 1-4, 2017.
[21]. Colbert, K., Farabet, C., 2011. Torch7: A MATLAB