Vascular Health and Risk Management
Dove
press
O R I G I N A L R E S E A R C H open access to scientific and medical research
Open Access Full Text Article
A stress-related explanation to the increased
blood pressure and its course following ischemic
stroke
Christopher Elnan Kvistad Halvor Oygarden
Nicola Logallo Lars Thomassen
Ulrike Waje-Andreassen Gunnar Moen
Halvor Naess
Department of Neurology, Haukeland University Hospital, Bergen, Norway
Background: A hypertensive response after ischemic stroke is frequent, yet its pathophysiol-ogy is unknown. Mechanisms related to local ischemic damage, major vascular occlusion, and psychological stress due to acute illness have been proposed. We assessed the natural course of blood pressure (BP) within the first 24 h in groups of ischemic stroke patients with different characteristics. We hypothesized that a consistent BP reduction, regardless of stroke location, time window from debut to admission and presence of persistent vascular occlusion, would favor a stress-related mechanism as an important cause of the hypertensive response after ischemic stroke.
Methods: Ischemic stroke patients (n=1067) were prospectively registered, and BP was
measured on admission and <3 h, 3–6 h, 6–12 h and 12–24 h after admission. Patients were categorized according to the location of diffusion-weighted imaging (DWI) lesions (cortical, large subcortical, mixed cortico-subcortical, lacunar, cerebellar, brain stem or multiple), time window (admitted within or after 6 h of symptom onset) and presence of persistent proximal middle cerebral artery (MCA) occlusion versus normal findings on magnetic resonance angi-ography (MRA) at 24 h.
Results: A reduction in systolic BP and diastolic BP from baseline to 12–24 h was found across all DWI locations except for diastolic BP in cerebellar (P=0.072) lesions. Apart from diastolic BP in patients with normal MRA findings at 24 h (P=0.060), a significant fall in systolic BP and diastolic BP at 12–24 h was registered, irrespective of whether patients were admitted within 6 h or after 6 h of stroke onset or had persistent MCA occlusion versus normal MRA findings.
Conclusion: We found a relatively consistent decline in BP within 24 h after admission across different stroke locations in patients admitted within or after 6 h of stroke onset and in patients with persistent MCA occlusion. Our findings suggest that a systemic factor such as psycho-logical stress may be an important contributor to the frequently elevated BP on admission in patients with ischemic stroke.
Keywords: ischemic stroke, blood pressure, hypertensive response, DWI
Introduction
A hypertensive response in blood pressure (BP) after ischemic stroke is frequent.1,2 A
number of prior trials have failed to show an improved clinical outcome with BP reduc-tion in the acute phase of ischemic stroke.3–5 As a result, BP management in acute stroke
is controversial and there is a lack of evidence-based guidelines.6 In order to develop
beneficial guidelines, research on the specific cause of the hypertensive response seems important in the sense that we should know what is actually being treated.
Correspondence: Christopher Elnan Kvistad
Department of Neurology, Haukeland University Hospital, University of Bergen, Jonas Lies vei 565021, N-5021 Bergen, Norway Tel +47 5 597 5040 Fax +47 5 597 5164 Email echr@helse-bergen.no
Journal name: Vascular Health and Risk Management Article Designation: ORIGINAL RESEARCH Year: 2016
Volume: 12
Running head verso: Kvistad et al
Running head recto: Course of BP in ischemic stroke patients DOI: http://dx.doi.org/10.2147/VHRM.S109032
Vascular Health and Risk Management downloaded from https://www.dovepress.com/ by 118.70.13.36 on 27-Aug-2020
For personal use only.
This article was published in the following Dove Press journal: Vascular Health and Risk Management
11 November 2016
Dovepress
Kvistad et al
The pathophysiology behind BP elevation following ischemic stroke remains poorly understood and different mechanisms have been discussed. The self-limiting nature of this response suggests other contributing factors than merely inadequately treated hypertension.6,7 Some studies have
attributed the hypertensive response to ischemic injuries of different cerebral regions that are responsible for autonomic BP control.8 Owing to the widespread scattering of these
areas, most stroke lesions are thought to affect these regions to a varied extent. Other studies have suggested that the rise in BP may represent a beneficial response by maintaining perfusion through collateral vessels in the presence of major occlusion.9–11 This hypothesis was supported by a study that
showed a steeper fall in BP in patients where recanalization was achieved as compared to those where major occlusion persisted.12
Stress related to acute illness and hospital admission may also lead to a hypertensive response.13,14 An elevated
BP mainly triggered by stress would be expected to decline spontaneously within the first hours of admission due to adoption of stress-related factors, and as stress has a systemic effect on BP, this reduction would likely occur across differ-ent groups of patidiffer-ents with differdiffer-ent stroke characteristics. In this study, the natural course of BP was assessed within the first 24 h after admission in different groups of ischemic stroke patients. We hypothesized that a consistent BP reduc-tion across different stroke locareduc-tions, across time windows from symptom debut to admission and in the presence of persisting major vascular occlusion would favor a stress-related mechanism as an important cause to the hypertensive response after ischemic stroke.
Methods
All patients with ischemic stroke admitted to Haukeland University Hospital between February 2006 and June 2013 were prospectively registered in a database (the Bergen NOR-STOKE registry) and retrospectively analyzed. The stroke center at Haukeland University Hospital (catchment area with
~250,000 inhabitants) received all patients admitted with a possible stroke, regardless of age or stroke severity. In addi-tion, patients with stroke aged <60 years from a neighboring area (~120,000 inhabitants) were admitted. Ischemic stroke was defined as neurological deficits lasting >24 h because of ischemic lesions or transient ischemic attacks where CT or MRI showed infarctions related to the clinical findings.15
Demographic data including medical history and clinical characteristics of all patients were prospectively registered. After BP measurement on hospital admission, patients were
monitored in a stroke unit with repeated measurements of BP during the first 24 h after admission. BP was measured using automated cuffs on admission and in the stroke unit. BP measurements were performed at the following time points: admission and <3 h, 3–6 h, 6–12 h and 12–24 h after admission. Patients with ischemic stroke, corresponding to diffusion-weighted imaging (DWI) lesions and BP measure-ments at the predefined time points, were assessed for inclu-sion in the study. If a single BP value in any of the predefined time points 0–3 h, 3–6 h or 6–12 h was missing, the missing value was replaced by the mean BP value derived from the BP values of the time points before and after the time point of the missing value. Patients with missing BP values on admission, 12–24 h or with more than one missing value at 0–3 h, 3–6 h or 6-12 h were excluded. Patients receiving BP-lowering treatment due to administration of intravenous thrombolysis were also excluded from the study.
Patients were routinely referred to MRI by the neurologist in charge of them. MRI and magnetic resonance angiography (MRA) were in general performed at the day after hospital admission unless patients were unable to undergo MRI due to contraindications such as a pacemaker and non-consenting or unstable patients. DWI was performed as part of a routine MRI protocol for stroke patients using 1.5 Tesla Siemens Magnetom (Symphony, Erlangen, Germany). The DWI sequence used was ep2d_diff:3scan_trace, with the following specification of parameters: field of view (FOV) 230 mm, slice thickness 5 mm, repetition time (TR) 3200 ms, echo time (TE) 94 ms, voxel size 1.8 × 1.8 × 5.0 mm, scan time 1:12, average 3 and b-values 0, 500, and 1000 s/mm2. Additional
sequences were t2_flair_tra and ep2e_diff_3scan_trace_ ADC. Intracranial MRA was performed with settings of TR 38, TE 5.28, flip angle 25°, images interpolated to 0.83 mm slice thickness, voxel size 0.7 × 0.5 × 0.8 mm, matrix 202 ×
384 (phase resolution 70%), FOV (FOV read) 200 mm and superior saturation band. MRA images were processed with a maximum intensity projection using the 3-dimensional time-of-flight technique. Neuroimaging was reviewed by a stroke neurologist (HN) with long experience (>15 years) in interpretation of stroke MRI and CT.
To assess the course of BP in relation to stroke location, time window from symptom onset to hospital admission and the presence of major occlusion, analyses were performed within three different groups consisting of different sub-groups. The groups of patients depended on the following: • Group I, location of DWI lesions: DWI lesions were
categorized into the following pre-defined subgroups: cortical lesions, confined to the supratentorial cortex;
Vascular Health and Risk Management downloaded from https://www.dovepress.com/ by 118.70.13.36 on 27-Aug-2020
Dovepress Course of BP in ischemic stroke patients
large subcortical lesions, located in the hemispheric white matter, basal ganglia, internal capsule, thalamus or corona radiata with a diameter ≥15 mm; lacunar lesions, located in the same territory as large subcortical lesions with a diameter <15 mm; mixed cortical–subcor-tical lesions, located in both supratentorial cortex and subcortex; cerebellar lesions, confined to the cerebel-lum; brainstem lesions, confined to the brain stem and multiple lesions, lesions located in more than one of the above defined areas. This predefined protocol of DWI location has been utilized in prior studies.16,17
• Group II, time window: patients were categorized into two different subgroups depending on whether they were admitted within or after 6 h of stroke onset.
• Group III, persisting major occlusion or no occlusion: patients were categorized into two different subgroups according to the presence of total proximal middle cerebral artery (MCA) occlusion or no occlusion of any cerebral vessel on MRA at 24 h. Total occlusion of intracranial arteries was defined as 100% occlusion on MRA. Intracra-nial stenosis was based on lumen reduction and defined as partial occlusion.18 Stenosis <20% was considered normal.
Patients were categorized into the occlusion subgroup if they had total proximal MCA occlusion on MRA at 24 h and into the no-occlusion subgroup if they had normal findings on MRA at 24 h and an admission National Institutes of Health Stroke Scale (NIHSS) score of ≥10. This study was approved by Regional komitee for medisinsk og helsefaglig forskningsetikk (REK), and written informed consent was obtained from all patients as part of a prospec-tive study protocol.
Statistical analyses
To examine the change in BP over time, we fitted a mixed linear regression analysis model with repeated BP measure-ments as the dependent variable and time as an independent variable. The effect of variables on BP change over time was tested by introducing them as both independent variables and as interaction terms with time. Analyses were performed using Stata 11.0 (StataCorp LP, College Station, TX, USA).
Results
A total of 1887 patients had ischemic stroke, and correspond-ing DWI lesions of 88 (4.7%) patients were excluded due to BP-lowering treatment within the first 24 h after admission. Of the remaining 1799 patients, a total of 1067 (59.3%) patients had BP measurements in agreement with the defined time windows, which led the inclusion of these patients in the
study. Missing BP values were found in 249 (23.3%) patients at 0–3 h after admission, 335 (31.4%) patients at 3–6 h and 9 (0.8%) patients at 6–12 h, which were replaced by mean BP values derived from the BP at the time points before and after the time points of the missing values.
Clinical characteristics
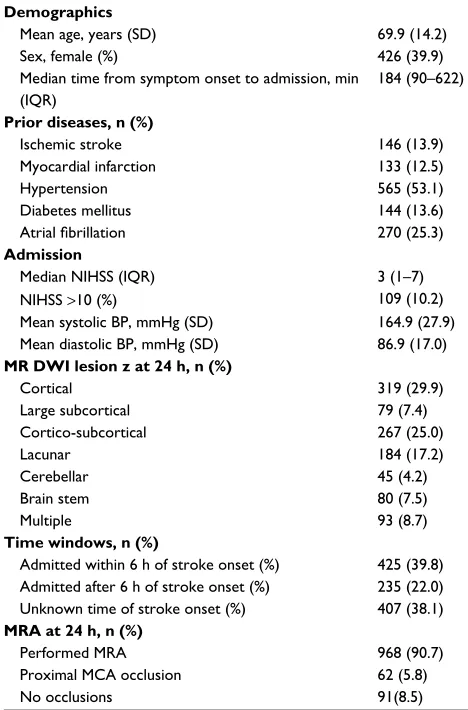
Demographic data and clinical characteristics of the patient population are shown in Table 1. The mean age of patients was 69.9 years (standard deviation [SD] 14.2), and median time from symptom onset to admission was 184 min (inter-quartile range [IQR] 90–622). On admission, patients had a median NIHSS score of 3 (IQR 1–7). The mean admission systolic BP and diastolic BP were 164.9 mmHg (SD 27.9) and 86.9 mmHg (SD 17.0), respectively. Distribution of DWI lesions was as follows: 319 (29.9%) had cortical lesions, 79 (7.4%) large subcortical, 267 (25.0%) cortico-subcortical, 184 (17.2%) lacunar, 45 (4.2%) cerebellar, 80 (7.5%) brain stem and 93 (8.7%) multiple lesions. A total of 425 (39.8%) patients were admitted within 6 h after stroke onset and 235 (22.0%) after 6 h. Stroke onset was unknown in 407 (38.1%) patients. MRA was performed in 968 (90.7%) patients. There were 62 (5.8%) patients with persisting proximal MCA occlu-sion and 91 (8.5%) with normal MRA findings and admisocclu-sion NIHSS score ≥10. The mean BP values and SDs at each time point are listed in Table 2. The corresponding graphs of BP courses are shown in Figures 1–4.
Differences in BP course within each
subgroup
Table 3 illustrates the mean reduction in systolic BP and diastolic BP per time unit and the difference in mean BP reduction per time unit between the different subgroups. There was a significant fall in systolic BP and diastolic BP across all DWI locations except for diastolic BP in cerebellar lesions (0.8 mmHg reduction per time unit, P=0.072). Like-wise, we found a significant BP reduction in patients admitted within and after 6 h of stroke onset. Apart from diastolic BP in patients with normal MRA at 24 h (0.7 mmHg reduction per time unit, P=0.060), there was a significant BP reduction in patients admitted within or after 6 h and in patients with or without normal MRA at 24 h.
A total of 483 patients (45.3%) were under antihypertensive treatment prior to admission. Analyses of BP course in these patients provided similar results with a significant BP reduction in all different subgroups except for a nonsignificant fall in systolic BP in patients with persisting MCA occlusion (mean reduction in systolic BP per time unit 0.8 mmHg, P=0.464).
Vascular Health and Risk Management downloaded from https://www.dovepress.com/ by 118.70.13.36 on 27-Aug-2020
Dovepress
Kvistad et al
Differences in BP course between
different subgroups
There were no differences in BP reduction among the dif-ferent locations of DWI lesions except for lacunar lesions, which had a significantly larger reduction in systolic BP as compared to cortical lesions (baseline variable) per time unit (Δ−1.2 mmHg per time unit, P=0.011). Patients with lacunar lesions also had the highest mean systolic BP on admission as compared to patients with DWI lesions elsewhere (Figure 3).
Patients admitted more than 6 h after stroke onset had a larger systolic BP reduction than patients admitted within 6 h (Δ−1.0 mmHg per time unit, P=0.020). There was no such difference in diastolic BP reduction (Δ−0.3 mmHg per time unit, P=0.527). Patients admitted >6 h after stroke onset had a higher systolic BP and diastolic BP on admission than patients admitted within 6 h (Figure 1).
There were no significant differences in BP reduction between patients with MCA occlusion on MRA at 24 h and patients with normal MRA at 24 h.
Discussion
Our study showed that BP, with a few exceptions, spontane-ously declined during the first 24 h after admission across different settings, such as stroke location, time window from stroke onset to hospital admission, and persisting major occlusion. These findings suggest that the frequently increased BP following ischemic stroke may be induced by a systemic factor that influences admission BP across different stroke characteristics and properties. Prior studies have shown a close association between the levels of psychological stress due to the “white coat phenomenon” and BP.19–21
Psychologi-cal stress related to hospitalization and acute illness may thus represent such a systemic factor and explain the increased BP on hospital admission, which rapidly declines as the patient adapts to the hospital environment. Because stress and its course after hospital admission likely occur irrespective of duration from symptom onset to admission or stroke location, a relatively uniform decline in BP is expected to be evident across different stroke populations. This is in conformity with our findings. A stress-related mechanism to the hypertensive response after ischemic stroke is supported by a prior study that showed a correlation between levels of stress hormones and BP in acute stroke.22 Similar to our findings, earlier
studies have also shown a decline in BP irrespective of the latency between stroke onset and admission.13,14 Based on
these observations, the authors suggested that mental stress may represent an important cause for the increased BP on admission in stroke patients. These prior studies were, how-ever, performed in the early 90s and may thus not represent a modern ischemic stroke population.
Other studies have related the hypertensive response after ischemic stroke to damage of specific regions in the brain that mediate autonomic control.8 The cerebral autonomic
control of arterial BP is complex and has a widespread distribution, which includes regions such as the prefrontal and cingulated cortex, insula, hypothalamus, ventrolateral medulla, and connecting pathways between these regions.8,23
Assuming that a post-stroke hypertensive response is entirely induced by tissue damage to cerebral BP-regulating areas, courses of BP after admission would be expected to differ depending on the location affected by the stroke. In contrast to this, our study showed a consistent reduction in systolic BP and diastolic BP in all predefined stroke locations with the exception of diastolic BP in patients with cerebellar
Table 1 Demographic data and clinical characteristics of the
study population with ischemic stroke (n=1067)
Demographics
Mean age, years (SD) 69.9 (14.2)
Sex, female (%) 426 (39.9)
Median time from symptom onset to admission, min (IQR)
184 (90–622)
Prior diseases, n (%)
Ischemic stroke 146 (13.9)
Myocardial infarction 133 (12.5)
Hypertension 565 (53.1)
Diabetes mellitus 144 (13.6)
Atrial fibrillation 270 (25.3)
Admission
Median NIHSS (IQR) 3 (1–7)
NIHSS >10 (%) 109 (10.2)
Mean systolic BP, mmHg (SD) 164.9 (27.9)
Mean diastolic BP, mmHg (SD) 86.9 (17.0)
MR DWI lesion z at 24 h, n (%)
Cortical 319 (29.9)
Large subcortical 79 (7.4)
Cortico-subcortical 267 (25.0)
Lacunar 184 (17.2)
Cerebellar 45 (4.2)
Brain stem 80 (7.5)
Multiple 93 (8.7)
Time windows, n (%)
Admitted within 6 h of stroke onset (%) 425 (39.8) Admitted after 6 h of stroke onset (%) 235 (22.0) Unknown time of stroke onset (%) 407 (38.1)
MRA at 24 h, n (%)
Performed MRA 968 (90.7)
Proximal MCA occlusion 62 (5.8)
No occlusions 91(8.5)
Abbreviations: SD, standard deviation; min, minutes; IQR, interquartile range; NIHSS, National Institutes of Health Stroke Scale; BP, blood pressure; MR, magnetic resonance; DWI, diffusion-weighted imaging; h, hours; MRA, magnetic resonance angiography; MCA, middle cerebral artery; h, hours.
Vascular Health and Risk Management downloaded from https://www.dovepress.com/ by 118.70.13.36 on 27-Aug-2020
Dovepress Course of BP in ischemic stroke patients
Table 2 Mean BP and SD values on admission and <3 h, 3–6 h, 6–12 h and 12–24 h after admission
Variable Admission <3 h 3–6 h 6–12 h 12–24 h
DWI lesion localization
Mean systolic BP in mmHg (SD)
Cortical 160.5 (27.3) 156.3 (24.9) 150.5 (24.9) 148.6 (24.8) 146.0 (24.7)
Large subcortical 171.9 (26.6) 166.6 (23.7) 162.8 (27.1) 160.1 (28.8) 155.5 (31.7)
Cortico-subcortical 159.4 (26.0) 157.4 (24.5) 153.2 (25.0) 150.7 (23.2) 147.6 (24.8)
Lacunar 175.2 (28.2) 167.4 (27.0) 161.9 (23.2) 156.3 (26.4) 156.4 (28.8)
Cerebellar 157.0 (23.1) 154.6 (23.0) 149.3 (23.0) 147.5 (19.3) 142.2 (19.6)
Brain stem 173.5 (26.7) 165.9 (25.5) 160.2 (24.0) 158.1 (25.7) 160.0 (27.3)
Multiple lesions 165.2 (30.5) 162.7 (28.1) 156.0 (26.9) 151.9 (23.6) 152.2 (23.0)
Mean diastolic BP in mmHg (SD)
Cortical 84.4 (16.2) 84.0 (15.3) 81.1 (15.4) 79.2 (15.3) 77.9 (16.0)
Large subcortical 89.8 (16.2) 86.5 (15.7) 85.1 (17.3) 83.5 (17.6) 80.4 (19.3)
Cortico-subcortical 84.6 (17.2) 82.4 (16.7) 81.4 (15.5) 78.6 (15.2) 77.9 (14.9)
Lacunar 93.3 (17.3) 92.9 (16.8) 89.2 (15.5) 85.1 (17.1) 85.3 (17.0)
Cerebellar 82.9 (14.1) 83.9 (16.1) 82.1 (15.0) 82.6 (15.5) 79.4 (16.0)
Brain stem 88.4 (15.8) 87.6 (17.0) 84.3 (16.4) 82.7 (16.6) 84.7 (15.9)
Multiple lesions 88.0 (18.3) 86.2 (16.8) 81.7 (18.1) 80.8 (17.6) 80.8 (15.8)
Time window
Mean systolic BP in mmHg (SD)
Admitted within 6 h 161.7 (25.5) 157.8 (25.0) 150. 6 (23.6) 150.6 (23.0) 148.5 (24.7)
Admitted after 6 h 170.6 (29.8) 164.3 (24.9) 159.0 (23.0) 154.0 (25.3) 154.0 (24.6)
Mean diastolic BP in mmHg (SD)
Admitted within 6 h 84.8 (16.3) 83.3 (16.0) 80.6 (15.4) 79.3 (15.5) 78.3 (16.1)
Admitted after 6 h 89.5 (17.0) 88.9 (15.3) 86.3 (14.8) 83.5 (16.2) 83.2 (16.3)
MRA at 24 h
Mean systolic BP in mmHg (SD)
MCA occlusion 156.3 (26.7) 159.0 (26.4) 153.7 (23.9) 148.0 (22.3) 148.4 (23.2)
No occlusion* 158.8 (28.6) 160.5 (24.5) 155.0 (23.5) 153.6 (24.5) 152.4 (25.8)
Mean diastolic BP in mmHg (SD)
MCA occlusion 85.1 (19.7) 82.3 (19.0) 80.9 (16.8) 79.7 (15.3) 77.5 (13.4)
No occlusion* 81.2 (15.3) 83.2 (17.6) 82.7 (15.2) 80.3 (15.7) 79.2 (16.6)
Note: *Patients in this group had an NIHSS score of ≥10 on admission and normal findings on MRA at 24 h.
Abbreviations: BP, blood pressure; SD, standard deviation; h, hours; DWI, diffusion-weighted imaging; MRA, magnetic resonance angiography; MCA, middle cerebral artery; NIHSS, National Institutes of Health Stroke Scale.
140 150 160 170
mmHg <≥6 h systolic
6 h systolic
70 80 90
Admission <3 h 3–6 h 6–12 h 12–24 h
<6 h diastolic
≥6 h diastolic
Figure 1 Course of systolic BP and diastolic BP in patients admitted within 6 h or after 6 h of symptom onset.
Abbreviations: BP, blood pressure; h, hours.
lesions. It is hard to conclude on any clinical correlation to these exceptions as the lack of decline only applied to the diastolic BP and not systolic BP. A possible explanation may be related to the already relatively low diastolic BP on admission in patients with cerebellar lesions as compared to the other stroke locations.
There were no differences in systolic BP or diastolic BP reduction between the different stroke locations except lacunar lesions, which had a larger reduction in systolic BP. Likewise, patients admitted after 6 h of stroke onset had a larger fall in systolic BP than patients admitted within 6 h. These findings may be explained by the preexisting high baseline BP on admission in patients with lacunar lesions and in patients admitted after 6 h of stroke onset. The find-ings were not reproduced in diastolic BP measurements, although the difference in diastolic BP reduction was nearly significant for patients with lacunar lesions with a P-value of 0.054.
Vascular Health and Risk Management downloaded from https://www.dovepress.com/ by 118.70.13.36 on 27-Aug-2020
Dovepress
Kvistad et al
Figure 4 Course of diastolic BP in patients with different DWI lesion locations. Abbreviations: h, hours; BP, blood pressure; DWI, diffusion-weighted imaging.
70 75 80 85 90 95
Admission <3 h 3–6 h 6–12 h 12–24 h
mmHg
Cortical
Cortico-subcortical Large subcortical
Lacunar
Cerebellum Brain stem
Multiple
Our findings are in contrast to a prior study where sys-tolic BP had a steeper fall after recanalization was achieved, whereas BP remained elevated when recanalization failed.12
The authors suggested that BP remained increased in patients with persistent occlusions due to a protective effect of elevated BP to maintain collateral perfusion. In patients who recanalized, this mechanism was no longer necessary and the BP decreased. In our population, there was a tendency toward the opposite with only a nonsignificant fall in diastolic BP in
patients with presumed recanalization, whereas the fall in BP was highly significant in patients with persistent occlusion. If recanalization is a crucial mechanism in post-stroke BP regulation, we would expect a significant fall also in diastolic BP in patients with achieved recanalization. We found no significant differences in mean BP reduction between patients with and without persisting occlusion. Our findings suggest that the hypertensive response and its course may not fully be explained by a protective response in relation to a persist-ing occlusion.
There are some limitations to this study: 1) The hypoth-esis of stress being an important explanation to the course of BP after ischemic stroke is limited by the lack of direct measures of stress and lack of a control group. 2) We aimed to assess BP in patients with persisting major occlusion as compared to those without persisting occlusion. Ideally, evidence of major occlusion should thus have been pres-ent on admission in patipres-ents without persisting occlusion on MRA at 24 h. This was, however, not obtainable since angiographic imaging on admission was not systematically performed. To compensate for this limitation, only patients with severe stroke symptoms on admission were included in the no-occlusion group, suggesting the presence of major occlusion on admission. 3) Single BP measurements were performed instead of continuous 24-h BP monitoring, and time points of BP measurements were not standardized.
The strengths of this study include the use of prospectively included patients in a stroke registry, the high percentage of MRI scans, and the exact localization of stroke injury exclu-sively based on DWI.
120 130 140 150 160 170 180
Admission <3 h 3–6 h 6–12 h 12–24 h
mmHg
Lacunar Cortical
Cortico-subcortical Large subcortical
Cerebellum Brain stem
Multiple
Figure 3 Course of systolic BP in patients with different DWI lesion locations. Abbreviations: BP, blood pressure; DWI, diffusion-weighted imaging; h, hours.
140 150 160 170 mmHg
70 80 90
Admission <3 h 3–6 h 6–12 h 12–24 h
Occlusion No occlusion
Occlusion No occlusion
Figure 2 Course of systolic BP and diastolic BP in patients with proximal MCA
occlusion on MRA at 24 h (occlusion) and in patients with normal findings on MRA
at 24 h and admission NIHSS score >10 (no occlusion).
Abbreviations: BP, blood pressure; MCA, middle cerebral artery; MRA, magnetic resonance angiography; h, hours; NIHSS, National Institutes of Health Stroke Scale.
Vascular Health and Risk Management downloaded from https://www.dovepress.com/ by 118.70.13.36 on 27-Aug-2020
Dovepress Course of BP in ischemic stroke patients
Conclusion
This study found a relatively consistent decline in BP within 24 h after admission across different stroke locations, in patients admitted within or after 6 h of stroke onset and in patients with persistent MCA occlusion. The findings sug-gest that a systemic factor such as psychological stress may be an important contributor to the frequently elevated BP on admission in patients with ischemic stroke.
Acknowledgment
Christopher Elnan Kvistad has been supported by Helse Vest Research Fund (number 911776) as a PhD research fellow.
Disclosure
The authors report no conflicts of interest in this work.
References
1. Wallace JD, Levy LL. Blood pressure after stroke. JAMA. 1981;246(19): 2177–2180.
2. Bath P, Chalmers J, Powers W, et al. International society of hypertension (ish): statement on the management of blood pressure in acute stroke. J Hypertens. 2003;21(4):665–672.
3. Barer DH, Cruickshank JM, Ebrahim SB, Mitchell JR. Low dose beta blockade in acute stroke (“best” trial): an evaluation. Br Med J. 1988; 296(6624):737–741.
4. Ahmed N, Nasman P, Wahlgren NG. Effect of intravenous nimodipine on blood pressure and outcome after acute stroke. Stroke. 2000;31(6): 1250–1255.
5. Sandset EC, Bath PM, Boysen G, et al. The angiotensin-receptor blocker candesartan for treatment of acute stroke (scast): a randomised, placebo-controlled, double-blind trial. Lancet. 2011;377(9767):741–750. 6. Saver JL. Blood pressure management in early ischemic stroke. JAMA.
2014;311(5):469–470.
7. Aslanyan S, Fazekas F, Weir CJ, Horner S, Lees KR; GAIN International Steering Committee and Investigators. Effect of blood pressure during the acute period of ischemic stroke on stroke outcome: a tertiary analysis of the gain international trial. Stroke. 2003;34(10):2420–2425. 8. Qureshi AI. Acute hypertensive response in patients with stroke:
patho-physiology and management. Circulation. 2008;118(2):176–187. 9. Olsen TS, Larsen B, Herning M, Skriver EB, Lassen NA. Blood flow
and vascular reactivity in collaterally perfused brain tissue. Evidence of an ischemic penumbra in patients with acute stroke. Stroke. 1983;14(3): 332–341.
10. Hillis AE, Ulatowski JA, Barker PB, et al. A pilot randomized trial of induced blood pressure elevation: effects on function and focal perfusion in acute and subacute stroke. Cerebrovasc Dis. 2003;16(3): 236–246.
11. Kvistad CE, Logallo N, Oygarden H, Thomassen L, Waje-Andreassen U, Naess H. Elevated admission blood pressure and stroke severity in acute ischemic stroke: the Bergen NORSTROKE Study. Cerebrovasc Dis. 2013;36(5-6):351–4.
12. Mattle HP, Kappeler L, Arnold M, et al. Blood pressure and ves-sel recanalization in the first hours after ischemic stroke. Stroke. 2005;36(2):264–268.
13. Carlberg B, Asplund K, Hagg E. Factors influencing admission blood pressure levels in patients with acute stroke. Stroke. 1991;22(4): 527–530.
14. Carlberg B, Asplund K, Hagg E. Course of blood-pressure in different subsets of patients after acute stroke. Cerebrovasc Dis. 1991;1:281–287. 15. Johnson CJ, Kittner SJ, McCarter RJ, et al. Interrater reliability of an
etiologic classification of ischemic stroke. Stroke. 1995;26(1):46–51. 16. Kvistad CE, Oygarden H, Logallo N, et al. A dark side of subcortical
diffusion-weighted lesions? Characteristics, cause, and outcome in large subcortical infarction: the Bergen Norwegian stroke cooperation study. Stroke. 2014;45(9):2710–2716.
17. Kvistad CE, Logallo N, Thomassen L, Moen G, Waje-Andreassen U, Naess H. Diffusion-weighted lesions in stroke patients with transient symptoms – where are they located? Cerebrovasc Dis. 2014;38(3):219–225. 18. Samuels OB, Joseph GJ, Lynn MJ, Smith HA, Chimowitz MI. A
stan-dardized method for measuring intracranial arterial stenosis. AJNR Am J Neuroradiol. 2000;21(4):643–646.
19. Mancia G, Bertinieri G, Grassi G, et al. Effects of blood-pressure measurement by the doctor on patient’s blood pressure and heart rate. Lancet. 1983;2(8352):695–698.
Table 3 Mean reduction in BP per time unit and differences in mean BP reduction per time unit
Variable Mean reduction
in systolic BP per time unit (mmHg)
P Mean reduction in diastolic BP per time unit (mmHg)
P Difference in mean reduction of systolic BP per time unit (mmHg)
P Difference in mean reduction of diastolic BP per time unit (mmHg)
P
DWI lesion localization
Cortical (n=319) 3.7 <0.001 1.5 <0.001 Baseline variable Baseline variable
Large subcortical (n=79) 3.9 <0.001 2.2 <0.001 −0.3 0.691 −0.6 0.306
Cortico-subcortical (n=267) 3.0 <0.001 1.7 <0.001 0.7 0.125 −0.2 0.685
Lacunar (n=184) 4.9 <0.001 2.4 <0.001 −1.2 0.011 −0.8 0.054
Cerebellar (n=45) 3.7 <0.001 0.8 0.072 0.0 0.971 0.7 0.336
Brain stem (n=80) 3.5 <0.001 1.2 0.001 0.2 0.768 0.3 0.578
Multiple lesions (n=93) 3.7 <0.001 2.0 <0.001 0.0 0.989 −0.4 0.441
Time window
Admitted within 6 h (n=425) 3.4 <0.001 1.5 <0.001 Baseline variable Baseline variable
Admitted after 6 h (n=235) 4.3 <0.001 1.8 <0.001 −1.0 0.020 −0.3 0.527
MRA at 24 h
MCA occlusion (n=62) 2.7 <0.001 1.8 0.001 Baseline variable Baseline variable
No occlusion* (n=91) 1.7 0.002 0.7 0.060 1.0 0.228 1.1 0.078
Note: *Patients in this group had an NIHSS score of ≥10 on admission and normal findings on MRA at 24 h.
Abbreviations: BP, blood pressure; DWI, diffusion-weighted imaging; h, hours; MRA, magnetic resonance angiography; MCA, middle cerebral artery; NIHSS, National Institutes of Health Stroke Scale.
Vascular Health and Risk Management downloaded from https://www.dovepress.com/ by 118.70.13.36 on 27-Aug-2020
Dovepress
Vascular Health and Risk Management
Publish your work in this journal
Submit your manuscript here: https://www.dovepress.com/vascular-health-and-risk-management-journal
Vascular Health and Risk Management is an international, peer-reviewed journal of therapeutics and risk management, focusing on concise rapid reporting of clinical studies on the processes involved in the maintenance of vascular health; the monitoring, prevention and treatment of vascular disease and its sequelae; and the involvement of
metabolic disorders, particularly diabetes. This journal is indexed on PubMed Central and MedLine. The manuscript management system is completely online and includes a very quick and fair peer-review system, which is all easy to use. Visit http://www.dovepress.com/ testimonials.php to read real quotes from published authors.
Dove
press
Kvistad et al
20. Pickering TG, James GD, Boddie C, Harshfield GA, Blank S, Laragh JH. How common is white coat hypertension. JAMA. 1988;259(2): 225–228.
21. Franklin SS, Thijs L, Hansen TW, O’Brien E, Staessen JA. White-coat hypertension new insights from recent studies. Hypertension. 2013;62(6): 982–987.
22. Ahmed N, de la Torre B, Wahlgren NG. Salivary cortisol, a biological marker of stress, is positively associated with 24-hour systolic blood pres-sure in patients with acute ischaemic stroke. Cerebrovasc Dis. 2004;18(3): 206–213.
23. Nason MW Jr, Mason P. Modulation of sympathetic and somatomotor func-tion by the ventromedial medulla. J Neurophysiol. 2004;92(1):510–522.
Vascular Health and Risk Management downloaded from https://www.dovepress.com/ by 118.70.13.36 on 27-Aug-2020