99
Solubility And Conductivity Study Of Li- Picrate In
(PC+THF) Mixture In Different Temperature
Dr. Ashoke Hazra
Abstract:- Present paper describe the preparation, solubility and conductivity study of Li-Picrate in different pecntage of propylene carbonate(PC) and tetrahydro furan(THF) mixture. From supported by absorbance data this primary study it may be concluded that room temperature solubility of Li-Picrate in mixed ( PC+THF ) solvents at different percentage is higher than the higher temperatures. Con ductivity data helps us to concluded that if we go from room temperature to higher temperature conductance increases for Li-Picrate in ( PC+THF ) solvents at different percentage. It is due to the switch over of ion-pair to ionic dissociation of Li-Picrate salt.
Key words: - conductivity, ion-pair, ion-dissociation, Li-Picrate, (PC+THF) mixture, solubility, temperature,
————————————————————
1 Introduction:
Some non-aqueous aprotic solvents of medium to high permitivities, low viscosities and large temperature intervals between freezing and boiling points have been used many researchers for electrolyte solutions applicable to primary and researchable high energy batteries. Lithium perchlorate is a salt often chosen to obtain those systems. Lithium perchlorate and other Li- salts have been used an optimization of electrolyte solutions in organic aprotic solvents for primary and secondary rechargeable lithium batteries [1-7] stable over a wide temperature range. Large anions with delocalised charges are generally chosen to minimize ion-ion interactions, and hence good stability and high electric conductivity[(8-10] can be expected. In the present study we use the salt of lithium is Li-Picrate and the elected solvents are PC (Propylene Carbonate) and THF (Tetra Hydro Furan). Few works has been done by Li-Picrate [11], [12]. In accordance with the basic requirements for electrolytes, an ideal electrolyte solvent should meet the following minimal criteria: (i) it should be able to dissolve salts of sufficient concentration. In other words, it should have a high dielectric constant. (ii) it should be fluid ( low viscosity), so that facile ion-transport can occur. (iii) it should remain inert to all cell components, especially the charged surfaces of the cathode and the anode, during cell operation. (iv) it should remain liquid in a wide temperature range. In other words, its melting point should be low and its boiling point should be high. (v) it should also be safe, nontoxic and economical.
For Li-based batteries, the active nature of the strongly reducing anodes (lithium metal or high lithiated carbon) and the strongly oxidising cathodes (transition metal based oxides) rules out the use of any solvents that have active proton despite their excellent power in solvating salts, because the reduction of such protons and /or the oxidation of the corresponding anions generally occurs within 2.0 – 4.0 V versus Li[13], while the charged potentials of the anode and the cathode in the current rechargeable lithium devices average 0.0 – 0.2 V and 3.0 – 4.5 V respectively. On the other hand, the non-aqueous compounds that qualify as electrolyte solvents must be able to dissolve sufficient amounts of lithium salts. Therefore, only those with polar groups such as carbonyl (C=O), nitrile (C=N), sulphonyl (S=O) and ether linkage (-O-) merit consideration. Here we use PC and THF solvents and their physical properties are listed in Table 1 [14]. Li- salts are much important for the study of Li-ion battery in non-aqueous medium. But the major drawback of these salt electrolyte is poor electrical conductivity at room temperature. Some attempts have been made to increase electrical conductivity of Li-salts as well as solubility in non-aqueous medium. Use of Li-salts as electrolytes seems to be promising [15-19]. In the present report, we describe the preparation, solubility study, conductivity study of Li-Picrate in different ( PC+THF ) mixed solvents at different temperatures. It is expected that Li-Picrate will exhibit better performances as an electrolyte in Li-ion batteries.
2. Experimental:
2.1. Materials:
PC ( LOBA Chemicals ), THF ( PDFCL, Mumbai ), Picric acid ( LOBA Chemicals ), Alcohol ( Bengal Chemicals and Pharmacecuticals ), Ether (LOBA Chemicals ), Lithium Carbonate (LOBA Chemicals ) were used as such without any further purification.
2.2. Li-Picrate:
Preparation of Li-Picrate ( Li-Picrate ): A small portion of Picric acid (LOBA Chemicals ) was dissolved in minimum quantity of absolute alcohol (Bengal Chemicals and Pharmacecuticals ). The solution was warmed at 40-50 dedree celcius. Lithium Carbonate (LOBA Chemicals ) was added to the solution pinch by pinch ( gradually decreasing amount ) till the effervescence of carbon di oxide stops. Still it was kept at low temperature. A brilliant yellow crystal was ______________________
appeared. The crystal of lithium picrate so formed was washed several times with solvent ether (LOBA Chemicals ) to remove excess picric acid. The salt was recrystallised 3-4 times from ethanol and dried in vaccum for 5-7 days.
2.3.Solutions Preparation:
For the preparation of 20% ( PC+THF ) solution by v/v ratio, 2 c.c. PC and 8 c.c. THF have taken in a 50 c.c. stoppered bottle. Then a minimum amount of Li-Picrate has taken to it up to its saturation. Then it was sealed with wax. After waxing it was jerking for few minutes and then settled for 7 days. After 7 days, it was further jerked and settled. Then after 7 days the solution was filtered with whattmann-42 filter paper. At the same procedure 40% ( PC+THF ) solution and 60% ( PC+THF ) solution with Li-Picrate have been prepared.
2.4. Solubility Study:
Solubility of the above solutions were measured with the help of Mini Spectrophotometer ( SL-171, Elico ) with spectral range 340-1000 nm and band width 5 nm. For this study, at first scanning was performed for Li-Picrate and after scanning the spectrum was fixed around 500 nm.
Then the total observations were performed for Li-Picrate around 500 nm. Then the absorbance value was measured at 25 degree celcius, 35 degree celcius and 45 degree celcius for different ( PC + THF ) solution with Li-Picrate ( vide Table 2 ). To get the unknown conc. of Li-Picrate , two known conc. of 0.1M and 0.05M were prepared. Knowing the absorbance value of 0.1M and 0.05M if we plot absorbance Vs. conc., then we can get the unknown conc. of Li-Picrate solution with the help of calibration curve. Same calibration curves were used to get the unknown conc. of Li-Picrate from different percentage of ( PC + THF ) non-aqueous mixture at different temperatures ( vide Table 3 ).
2.5. Conductivity study:
Conductivity of the above solutions were measured with a conductivity bridge ( EC-TDS analyser, CM-183, Elico ). Cell constants varied from 1.0+10% to 1.0-10% cm inverse. A temperature control bath (made by PDIC ) was used to obtain the conductivities at the higher temperatures. The results of conductivity measurement are reported in Table 4 to Table 12.
3. Result and discussions:
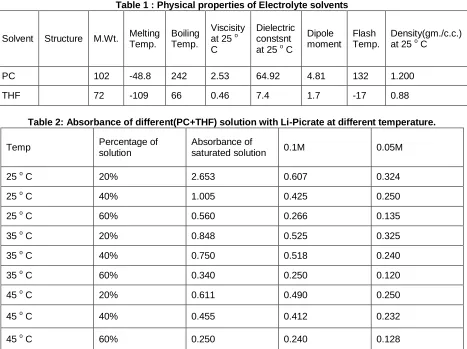
Table 1 : Physical properties of Electrolyte solvents
Solvent Structure M.Wt. Melting Temp.
Boiling Temp.
Viscisity at 25 o C
Dielectric constsnt at 25 o C
Dipole moment
Flash Temp.
Density(gm./c.c.) at 25 o C
PC 102 -48.8 242 2.53 64.92 4.81 132 1.200 THF 72 -109 66 0.46 7.4 1.7 -17 0.88
Table 2: Absorbance of different(PC+THF) solution with Li-Picrate at different temperature.
Temp Percentage of solution
Absorbance of
101 Table 3: Conc. of different % of solution at different temperature from calibration curve
Temp
Percentage of solution with saturated Lipic
Unknown
Conc.(moles/litre) 0.1M 0.05M
25 o C 20% 0.4312 0.607 0.324 25 o C 40% 0.2284 0.425 0.250 25 o C 60% 0.2098 0.266 0.135 35 o C 20% 0.1542 0.525 0.325 35 o C 40% 0.1469 0.518 0.240 35 o C 60% 0.1370 0.250 0.120 45 o C 20% 0.1241 0.490 0.250 45 o C 40% 0.1077 0.412 0.232 45 o C 60% 0.1027 0.240 0.128
Table 4: conductivity of 20% (PC+THF) solution with Li-Picrate at 25 degree celcius
Temp Conc.(moles/litre) Conductivity(micro
Simen) % of solution
25 o C 0.4312 142.5 20% solution 25 o C 0.1 47.24 20% solution
25 o C 0.05 1.087 20% solution
Table 5: conductivity of 40% (PC+THF) solution with Li-Picrate at 25 degree celcius
Temp Conc.(moles/litre) Conductivity(micro
Simen) % of solution
25 o C 0.2284 842 40% solution 25 o C 0.1 285.6 40% solution 25 o C 0.05 100.6 40% solution
Table 6: conductivity of 60% (PC+THF) solution with Li-Picrate at 25 degree celcius
Temp Conc.(moles/litre) Conductivity(micro
Simen) % of solution
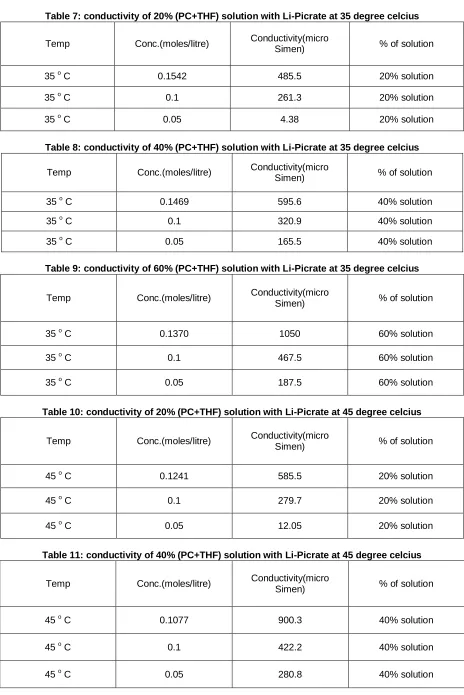
Table 7: conductivity of 20% (PC+THF) solution with Li-Picrate at 35 degree celcius
Temp Conc.(moles/litre) Conductivity(micro
Simen) % of solution 35 o C 0.1542 485.5 20% solution 35 o C 0.1 261.3 20% solution 35 o C 0.05 4.38 20% solution
Table 8: conductivity of 40% (PC+THF) solution with Li-Picrate at 35 degree celcius
Temp Conc.(moles/litre) Conductivity(micro
Simen) % of solution 35 o C 0.1469 595.6 40% solution 35 o C 0.1 320.9 40% solution 35 o C 0.05 165.5 40% solution
Table 9: conductivity of 60% (PC+THF) solution with Li-Picrate at 35 degree celcius
Temp Conc.(moles/litre) Conductivity(micro
Simen) % of solution
35 o C 0.1370 1050 60% solution
35 o C 0.1 467.5 60% solution
35 o C 0.05 187.5 60% solution
Table 10: conductivity of 20% (PC+THF) solution with Li-Picrate at 45 degree celcius
Temp Conc.(moles/litre) Conductivity(micro
Simen) % of solution 45 o C 0.1241 585.5 20% solution 45 o C 0.1 279.7 20% solution 45 o C 0.05 12.05 20% solution
Table 11: conductivity of 40% (PC+THF) solution with Li-Picrate at 45 degree celcius
Temp Conc.(moles/litre) Conductivity(micro
Simen) % of solution
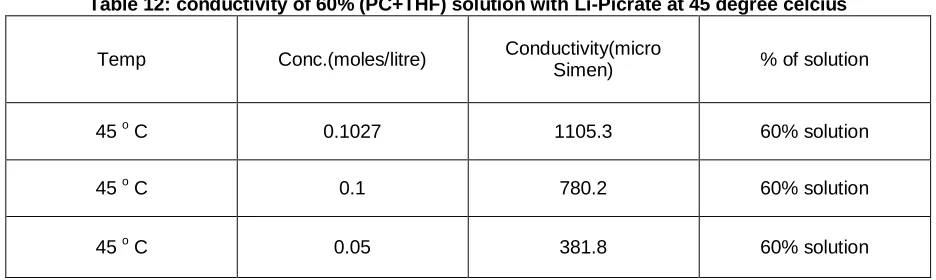
103 Table 12: conductivity of 60% (PC+THF) solution with Li-Picrate at 45 degree celcius
Temp Conc.(moles/litre) Conductivity(micro
Simen) % of solution
45 o C 0.1027 1105.3 60% solution 45 o C 0.1 780.2 60% solution 45 o C 0.05 381.8 60% solution
The spectroscopic data was observed around 500nm for Li-Picrate solution. From Table 2, it has been found that at 25 o C (room temp.), the absorbance of 20% (PC+THF) with Li-Picrate (saturated solution) is high than the 40% and 60% solution respectively. Solubility decreases for Li-Picrate as PC content increases. But we know PC is a good solvating ions (particularly cations only, the Li ions) and is good for their (ionic compounds) dissolution due to the high dielectric constant of PC is 64. Dielectric constant is a measure of the solvents ability to separate ions. In general, ionic compounds are more soluble in solvents with high dielectric constants. Li-ion is small and its proper salvation in PC is required to have good ionic dissociation. It is actually happening as is evident from the fact that although solubility of Li-Picrate decreases in high PC content solvent mixture, the conductivity increases, inspite of the fact that possibly viscosity of the solvent PC is higher. The dissolved species is thus probably in ion-pair or co-valency (all of which are electroneutral). The higher solubility with less conductivity is probably the reflection of ion-pair formation or even the existence of co-valent molecular species in THF rich solvent. In PC and THF mixtures, very low dielectric constant of THF will also favour ion-pair formation over ionization on dissolution or even the dissolved species may be co-valent molecules of Li-Picrate with high degree of ionic character. Such an idea is in keeping with the real nature of the ionic compounds. If we increased the temp. i.e, at 35 degree celcius, the absorbance data has been follow the above result. Here we also see that at 20% ( PC+THF ) solution with Li-Picrate show the high spectroscopic data than 40% and 60% solutions respectively but not exceeds the value at 25 degree celcius ( room temp.). Here we observed these experiments at 25 degree celcius ( room temp.) , 35 degree celcius, 45 degree celcius. At 45 degree celcius, these experiments have been performed. Here it has been found that with increase in temp. absorbance data decreases from 20% ( PC+THF ) solution with Picrate to 40% ( PC+THF ) solution with Li-Picrate and 60% ( PC+THF ) solution with Li-Li-Picrate respectively but not exceeds the value at 35 degree celcius. From Table 2 , at 25 degree celcius, absorbance data at conc. of saturated Li-Picrate solution, 0.1 M solution and 0.05 M solution was plotted in a calibration curve, then we
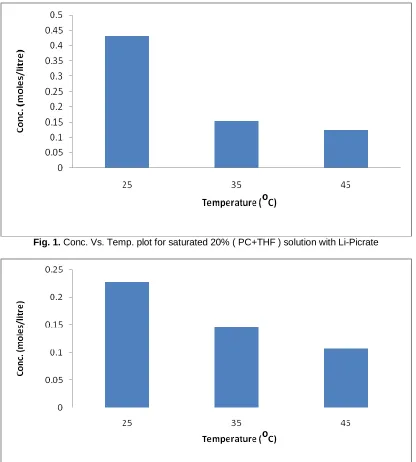
Fig. 1. Conc. Vs. Temp. plot for saturated 20% ( PC+THF ) solution with Li-Picrate
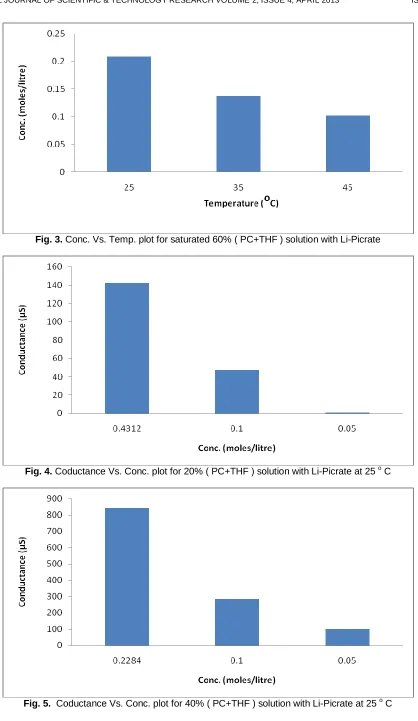
105 Fig. 3. Conc. Vs. Temp. plot for saturated 60% ( PC+THF ) solution with Li-Picrate
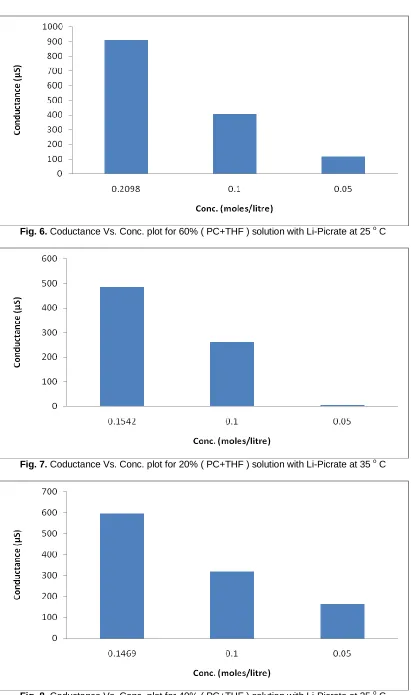
Fig. 4. Coductance Vs. Conc. plot for 20% ( PC+THF ) solution with Li-Picrate at 25 o C
Fig. 6. Coductance Vs. Conc. plot for 60% ( PC+THF ) solution with Li-Picrate at 25 o C
Fig. 7. Coductance Vs. Conc. plot for 20% ( PC+THF ) solution with Li-Picrate at 35 o C
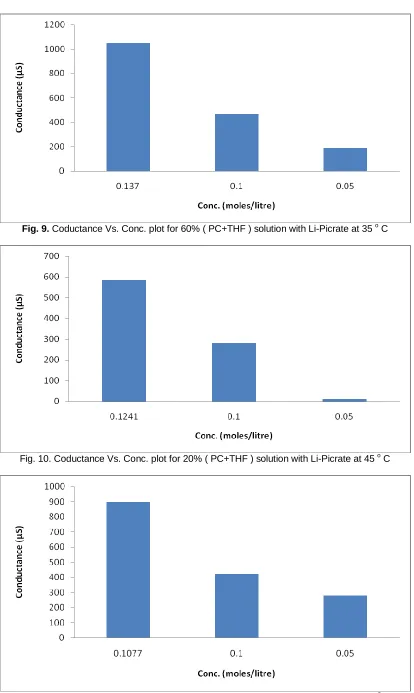
107 Fig. 9. Coductance Vs. Conc. plot for 60% ( PC+THF ) solution with Li-Picrate at 35 o C
Fig. 10. Coductance Vs. Conc. plot for 20% ( PC+THF ) solution with Li-Picrate at 45 o C
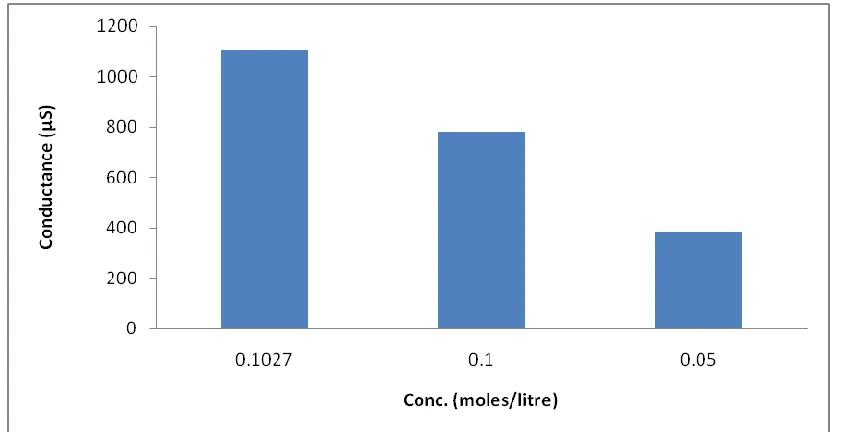
Fig. 12. Coductance Vs. Conc. plot for 60% ( PC+THF ) solution with Li-Picrate at 45 o C Fig.1, Fig.2 and Fig.3 show that the variation of conc. with
different temperatures of 20%, 40% and 60% ( PC+THF ) solutions with Li-Picrate. It has been found that room temperature solubility of Li-Picrate with mix ( PC+THF ) soivent is maximum than the other two higher temperatures.
Fig. 4, Fig. 5 and Fig. 6 show that the variation of conductance with different conc. of Li-Picrate at 25 degree celcius. Here we see that with decrease in conc. conductance decreases.
Fig. 7, Fig. 8 and Fig. 9 show that the variation of conductance with different conc. of Li-Picrate at 35 degree celcius. With increase in temperature conductivity increases. This is due to the shifting of ion-pair to ionic dissociation of Li-Picrate salt.
Fig. 10, Fig. 11 and Fig. 12 show that the variation of conductance with different conc. of Li-Picrate at 45 degree celcius. Here we also observed that from 35 to 45 degree celcius conductivity increases to some extent than the 35 degree celcius. This fact supports the high dielectric constant of PC.
It is also evident that the large size of picrate ion along with delocalization of charge suggests that its enthalpy of ionization is not too high. Thus the transition from ion-pair to ionic dissociation will not to be high energy process. Our present observation shows that a change in solvent quality , namely, some change in dielectric constant probably together with a change in specific interactions are sufficient to change the mechanism of dissolution or on the nature of interaction of the dissolved species. The transition point seems to be quite sharp and is within 20% to 40% PC content.
4. Conclusion:
From supported by absorbance data this primary study it may be concluded that room temperature solubility of
Li-Picrate in mixed ( PC+THF ) solvents at different percentage is higher than the higher temperatures. Conductivity data helps us to concluded that if we go from room temperature to higher temperature conductance increases for Li-Picrate in ( PC+THF ) solvents at different percentage. It is due to the switch over of ion-pair to ionic dissociation of Li-Picrate salt. Further studies will be performed in the next phase for different Li-salts with these mixed ( PC+THF ) solvents and other parameters will be calculated to support these findings.
5. Acknowledgement:
The P.I. of this project is thankful to the UGC for financial support , Dr. Kousik Ghosh, Zoology Dept., B.U., all staffs of Dept. of Chemistry, A.K. P. C. Mahavidyalaya, and also thankful to Dr. Swapan Koley of this college who always helps me to fulfil this work.
6. References:
[1]. A. D. Aparno, B. Sesta, V. Mauro, M. Salomon, J. Solution Chem. Vol.29, pp.1075, 2000.
[2]. J. Barthel, H. – J. Gores, R. Neueder, A. Schmis, Pure Appl. Chem. Vol. 71, pp. 1715, 1999.
[3]. C. A. N. Viana, M. dilo, Port. Electrochim. Acta Vol. 18, pp. 23, 2000; M. Dilo, Master Thesis, Lisboa ( 1997 ).
[4]. C. A. N. Viana, M. dilo, Port. Electrochim. Acta Vol. 20, pp. 25, 2002.
[5]. M. Ue, J. Electrochem. Soc. Vol.12, pp. 141, 1994. [6]. J. Barthel, H. J. Gores, R. Watcher, Topics in
Current Chemistry , Vol. 111, pp. 33, 1983. [7]. Kang Xu, Chem. Rev. Vol. 104, pp. 4403-4417,
109
[8]. J. –F Cote, G. Perron, J. E. Desnoyers, J. Solution Chemistry, Vol. 27, pp. 707, 1998.
[9]. D. F. Evans, J. Thomas, J. A. Nadas, M. A. Matesich, J. Phys. Chem. Vol.75, pp.1714, 1971. [10]. L. M. V. Pinheiro, A. R. T. Calado, J. C. R. Reis, C.
A. N. Viana, Submitted.
[11]. 11.S. Roy and I. N. Basumallick, J. Electrochem. Soc., Vol. 137, pp. 3876, 1990.
[12]. A. Hazra and I. Basumallick, Bull of Electrochemistry, Vol. 17 ( 10 ), pp. 477, 2001. [13]. Fry. A. J. Synthetic Organic Electrochemistry, Vol.
22nd ed; John Wiley, London, 1989.
[14]. Jang. G. J.; Tomkins, R. P. T. Non-aqueous Electrolytes Handbook, Academic Press; New York, Vol. 1, 1972.
[15]. F. Capuano, F. Croce and B. Scrosati, J. Electrochem. Soc., Vol. 138, pp. 1918, 1991. [16]. F. Croce, F. Capuano, A. Selvoggi, B. Scrosati and
G. Scibona, J. of Power Sources, Vol. 32 , pp. 381, 1990.
[17]. B. Kumar and L. G. Scanlon, Presented at the 36th Power Sources Conf. New Jersey, June ( 1994 ). [18]. S. Skaarup, K. West and B. Zachau- Christiansen,
Solid State Ionics, Vol. 28-30, pp. 975, 1988. [19]. Sheng S. Z hang, J. Read, J. Power Sources, Vol.