RESEARCH
Predictors of survival in patients
with sarcoma admitted to the intensive care
unit
Rohan Gupta
1, Neda Heshami
1, Chouhan Jay
1, Naveen Ramesh
2, Juhee Song
3, Xiudong Lei
3, Erfe Jean Rose
4,
Kristen Carter
5, Dejka M. Araujo
5, Robert S. Benjamin
5, Shreyaskumar Patel
5, Joseph L. Nates
4and Vinod Ravi
5*Abstract
Background: Advances in treatment of sarcoma patients has prolonged survival but has led to increased disease- or treatment-related complications resulting in greater number of admissions to the intensive care unit (ICU). Survival and long-term outcome information about such critically ill patients with sarcoma is unknown.
Methods: The primary objective of the study was to determine the ICU and post-ICU survival rates of critically ill sarcoma patients. Secondary objectives included determining the modifiable and non-modifiable predictors of poor survival. We performed a retrospective chart review of sarcoma patients admitted to the ICU at The University of Texas MD Anderson Cancer Center between January 1, 2005, and December 31, 2012. Main outcome measures were ICU mortality, in-hospital mortality and 1, 2, and 6-month survival rates. Covariates such as histological diagnosis, disease characteristics, chemotherapy use, Charlson comorbidity index, Sequential Organ Failure Assessment (SOFA) scores, and clinical findings leading to ICU admission were analyzed for their effects on survival.
Results: We identified 172 admissions over the 8-year study period hat met our inclusion criteria. The study popula-tion was 45.9 % males with a median age of 52 years. The most common sarcoma subgroups were high-grade unclas-sified sarcoma (25 %) and bone tumors (17.4 %). The ICU mortality rate was 23.3 % (95 % confidence interval [CI], 16.9–29.6 %), and an additional 6.4 % of patients died before hospital discharge (95 % CI, 22.9–37.1 %). 6-month OS rates were 41 %. The median SOFA scores on admission were 6 (inter quartile range (IQR), 3.5–9) in ICU survivors and 10 (IQR, 6.5–14) in ICU non-survivors. Increase in SOFA scores ≥6 led to poor outcomes (ICU survival 13.3 %, OS 6.7 %). Charlson comorbidity index (HR 1.139, 95 % CI 1.023–1.268, p = 0.02) and discharge SOFA scores (HR 1.210, 95 % CI 1.141–1.283, p < 0.0001) correlated with overall survival.
Conclusions: Our results suggest that patients that are admitted to the ICU for respiratory failure, cardiac arrest, sep-tic shock, acute renal failure or acidosis and also have a high SOFA score with subsequent worsening in the ICU have poor prognosis. Based on the retrospective data which needs further validation we can recommend that judicious approach should be taken in patients with predictors of poor survival before subjecting them to aggressive treatment. Keywords: Cancer, Sarcoma, ICU, Survival, SOFA
© 2016 The Author(s). This article is distributed under the terms of the Creative Commons Attribution 4.0 International License (http://creativecommons.org/licenses/by/4.0/), which permits unrestricted use, distribution, and reproduction in any medium, provided you give appropriate credit to the original author(s) and the source, provide a link to the Creative Commons license, and indicate if changes were made. The Creative Commons Public Domain Dedication waiver (http://creativecommons.org/ publicdomain/zero/1.0/) applies to the data made available in this article, unless otherwise stated.
Open Access
*Correspondence: [email protected]
5 Department of Sarcoma Medical Oncology, The University of Texas MD Anderson Cancer Center, 1515 Holcombe Blvd # 450, Houston, TX 77030, USA
Background
Sarcomas are a rare, histologically and behaviorally diverse group of malignant connective tissue tumors that make up approximately 1 % of all adult malignancies and 12 % of pediatric cancers [1, 2]. As a result of the substan-tial progress made in the past 2 decades in understand-ing the behavior and molecular pathogenesis of sarcoma, new therapies have been developed. Advances in treat-ment may prolong survival but can lead to increased disease- or treatment-related complications requiring aggressive critical care. Due to the rarity of this class of tumors, the survival of critically ill sarcoma patients has not been well studied.
The treatment of such patients requires a multidisci-plinary approach, with coordination among oncologists, critical care physicians, consulting services, ancillary staff, and patients’ families. Despite the availability of advanced life support devices in intensive care centers in the United States, it is difficult for both patients and phy-sicians to objectively determine the effect of such heroic measures on prognosis or quality of life. Studies up to the 1990s had shown that among all diseases, patients with cancer had the lowest intensive care unit (ICU) survival rates, and the majority of these patients died soon after their hospital discharge [3–5]. However, over the past two decades, the approach to treatment in such cases has been shifting. Some studies have shown that patients lacking predictors of poor survival outcomes are consid-ered as good candidates for aggressive therapy [6–8].
The primary objective of our study was to determine the ICU and post-ICU survival rates of critically ill sar-coma patients. Secondary objectives included determin-ing the modifiable and nonmodifiable predictors of poor survival.
Methods
Patient population
After obtaining institutional review board approval, we retrospectively reviewed the electronic medical records of 212 critically ill patients with sarcoma who had been admitted to the ICU at The University of Texas MD Anderson Cancer Center between January 1, 2006, and December 31, 2012. For the purpose of this analysis, we limited the study population to patient’s first ICU admis-sion only. We also excluded from the study population patients who had been admitted to the ICU for periop-erative care.
Study design
This retrospective study was designed to identify predic-tors of poor survival that contribute to ICU mortality. ICU mortality was defined as the percentage of patients with sarcoma who died in the ICU among total number
of patients admitted to the ICU with sarcoma during the study period. Secondary outcomes were in-hospital mor-tality and 1, 2, and 6-month survival rates, which were defined by similar means. Overall survival (OS) for each patient was measured from the time of initial ICU admis-sion to the last date of contact or death. We defined ICU survival as short-term or acute survival and 6-month sur-vival as long-term survival. Median follow-up time was calculated from the date of ICU admission.
Patient’s current and previous chemotherapy regimens were examined to evaluate the impact of various chemo-therapy treatments on survival. Tumor burden was noted by recording the various sites of metastasis, such as head and neck, musculoskeletal, heart, lung, liver, gastrointes-tinal tract, and spleen. The Charlson comorbidities index (CCI) was used to assess the role of serious comorbid dis-ease in the survival of patients in the study [9].
Clinical findings present at the time of ICU admis-sion were recorded to assess acute illness (definitions in parentheses). Variables recorded included acute renal failure, anemia, thrombocytopenia, pancytopenia, hemorrhage (including bleeding from gastrointestinal tract), lactic acidosis, heart failure, pulmonary embo-lism, respiratory failure (use of noninvasive or invasive mechanical ventilation), cardiac arrest, atrial fibrillation, cardiac dysrhythmia, pneumonia, septic shock, hypoten-sion (systolic blood pressure <100 or on vasopressors), hypertension, neutropenic fever (absolute neutrophil count <1500), altered mental status, and malnutrition (patient on feeding tube or total parental nutrition).
Severity of illness at the time of ICU admission was measured by Sequential Organ Failure Assessment (SOFA) scores. Maximum SOFA scores and discharge SOFA scores were also obtained to track the patients’ progress while they were in the ICU. Change in SOFA scores were calculated by subtracting the admission SOFA scores from the maximum SOFA scores. Organ failure at the time of ICU admission was determined by an admission SOFA score ≥2 per organ system. The total number of organ failures was calculated for each patient.
Analysis
Cox proportional hazards models were fitted to deter-mine the association of patient and clinical characteristics with OS. Variables that had significant univariate log-rank p values were candidates for the multivariate model. Results were expressed in hazard ratios (HRs), odds ratios (ORs) and 95 % confidence intervals (CIs). p values of less than 0.05 were considered statistically significant; all tests were two-sided. Statistical analyses were carried out by using SAS 9.4 (SAS Institute Inc., Cary, NC) and S-Plus 8.2 (TIBCO Software Inc, Palo Alto, CA, USA).
Results
Patient characteristics
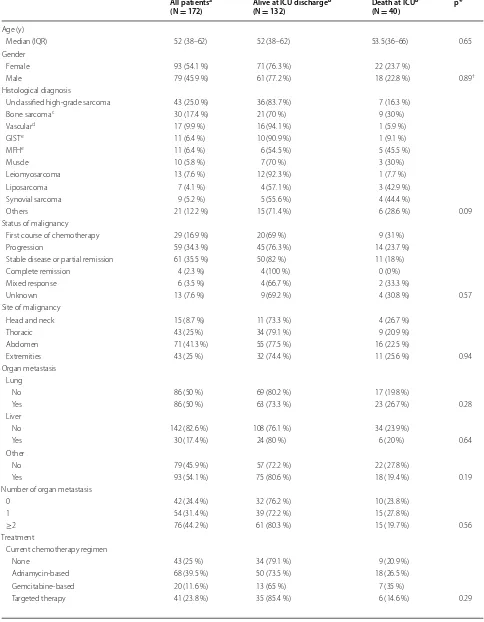
We identified a total of 212 sarcoma admissions to the ICU at MD Anderson between January 1, 2005, and December 31, 2012. We excluded 23 ICU admissions of patients who were admitted to the ICU multiple times during the study course. Of the remaining 189 admis-sions, 17 perioperative admissions were excluded, leav-ing a sample of 172 first-time ICU admissions. The study population was 45.9 % male with median age of 52 years (interquartile range [IQR] 38–62 years) (Supplemental Digital Content—Table 1). The most common sarcoma subgroups were unclassified high-grade sarcoma (25 %), bone sarcoma (Ewing sarcoma, osteosarcoma, and chon-drosarcoma; 17.4 %), vascular sarcoma (angiosarcoma and epithelioid hemangioendothelioma; 9.9 %), and leio-myosarcoma (7.6 %). The ICU mortality rate was 23.3 % (95 % CI 16.9–29.6 %), and the hospital mortality rate was 29.7 % (95 % CI 22.9–37.1 %). The median Charlson comorbidity index was 6 (IQR 6–7) owing to presence of metastatic cancer in most of the patients at the time of admission.
Death in the ICU
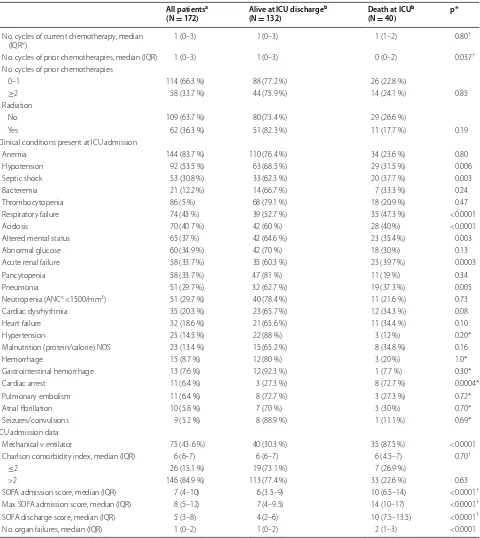
There were 40 patient deaths (23.3 %) in the ICU. In the univariate logistic regression model for the death at the ICU, short-term mortality did not correlate with tumor site, histology, disease status, presence of metastatic dis-ease, Charlson comorbidity index or neutropenia at the time of ICU admission. However, patients with clinical findings of acidosis, acute renal failure, cardiac arrest, hypotension (including septic shock), pneumonia, septic shock or respiratory failure at the time of ICU admis-sion had worse outcomes than patients who lacked these findings on admission (Supplemental Digital Content— Tables 1, 2).
The median SOFA scores on admission were 6 (IQR 3.5–9) in ICU survivors and 10 (IQR 6.5–14) in non-sur-vivors. In addition, the median maximum SOFA scores were 7 (IQR 4–9.5) in survivors and 14 (IQR 10–17) in non-survivors, and the median discharge SOFA scores were 4 (IQR 2–6) in survivors and 10 (IQR, 7.5–13.5) in
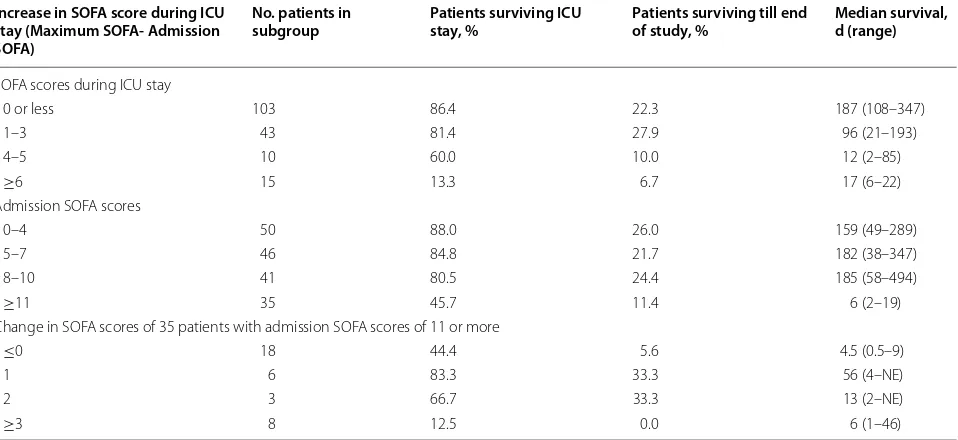
non-survivors. Patients with admission SOFA scores of 11 or more had a lower ICU survival rate than did those with scores less than 11 (45.7 vs 80 % or more) (Table 2). An increase of 6 or more in the SOFA score from the time of admission significantly affected short- (ICU survival 13.3 %) and long-term outcomes (OS 6.7 %) (Table 3).
Multivariate logistic regression model for death in the ICU showed that SOFA admission score (OR 1.23, 95 % CI 1.12–1.35, p < 0.0001) was associated with death in the ICU. Variables that were initially included in the model and then reduced in a stepwise selection were SOFA admission score and number of metastatic sites.
OS from ICU admission
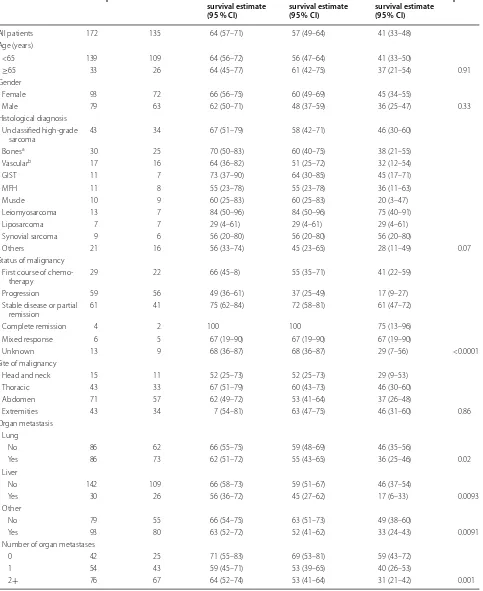
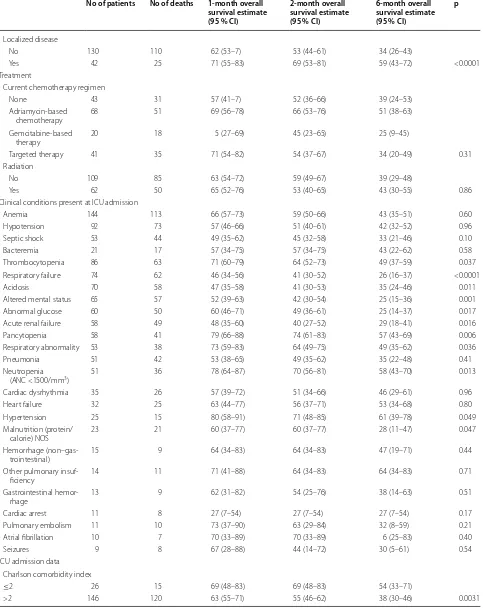
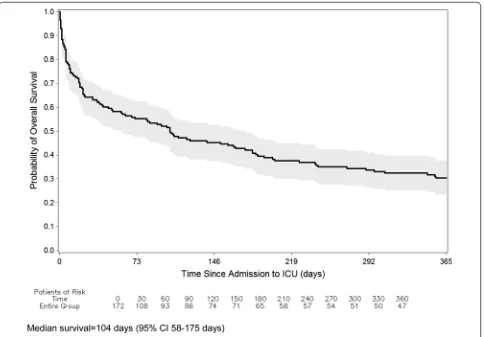
Median follow-up among all patients was 2.9 months (range 0.02–77.5 months). At the time of this analysis, 135 patients (78.5 %) had died. For the whole cohort, 1, 2, and 6-month OS rates were 64, 57, and 41 %, respectively (Table 4). The Kaplan–Meier curves for OS are shown in Fig. 1.
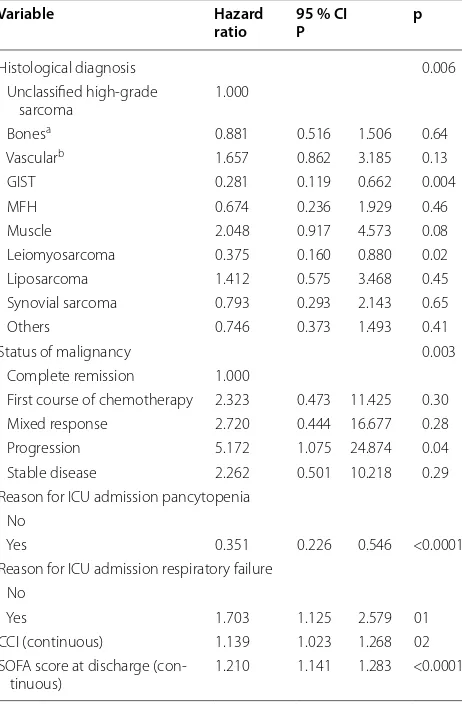
In multivariable Cox proportional hazards models (Table 5), patients with gastrointestinal stromal tumors (HR 0.281, 95 % CI 0.119–0.662, p = 0.004) and leio-myosarcoma (HR 0.375, 95 % CI 0.160–0.880, p = 0.02) had a lower risk of death than did patients with unclas-sified high-grade sarcoma. Patients with higher Charl-son Comorbidity Index (HR 1.139, 95 % CI 1.023–1.268, p = 0.02) and those with higher SOFA scores at discharge (HR 1.210, 95 % CI 1.141–1.283, p < 0.0001) also had higher risk of death (Table 5). Median survival rates were lower in patients with acute renal failure, cardiac arrest, pneumonia, septic shock, and respiratory failure.
Discussion
Table 1 Patient and clinical characteristics by Alive or Death at the Intensive Care Unit (ICU)
All patientsa
(N = 172) Alive at ICU discharge
b
(N = 132) Death at ICU
b
(N = 40) p*
Age (y)
Median (IQR) 52 (38–62) 52 (38–62) 53.5(36–66) 0.65 Gender
Female 93 (54.1 %) 71 (76.3 %) 22 (23.7 %)
Male 79 (45.9 %) 61 (77.2 %) 18 (22.8 %) 0.89†
Histological diagnosis
Unclassified high-grade sarcoma 43 (25.0 %) 36 (83.7 %) 7 (16.3 %) Bone sarcomac 30 (17.4 %) 21 (70 %) 9 (30 %)
Vasculard 17 (9.9 %) 16 (94.1 %) 1 (5.9 %)
GISTe 11 (6.4 %) 10 (90.9 %) 1 (9.1 %)
MFHe 11 (6.4 %) 6 (54.5 %) 5 (45.5 %)
Muscle 10 (5.8 %) 7 (70 %) 3 (30 %) Leiomyosarcoma 13 (7.6 %) 12 (92.3 %) 1 (7.7 %) Liposarcoma 7 (4.1 %) 4 (57.1 %) 3 (42.9 %) Synovial sarcoma 9 (5.2 %) 5 (55.6 %) 4 (44.4 %)
Others 21 (12.2 %) 15 (71.4 %) 6 (28.6 %) 0.09 Status of malignancy
First course of chemotherapy 29 (16.9 %) 20 (69 %) 9 (31 %) Progression 59 (34.3 %) 45 (76.3 %) 14 (23.7 %) Stable disease or partial remission 61 (35.5 %) 50 (82 %) 11 (18 %) Complete remission 4 (2.3 %) 4 (100 %) 0 (0 %) Mixed response 6 (3.5 %) 4 (66.7 %) 2 (33.3 %)
Unknown 13 (7.6 %) 9 (69.2 %) 4 (30.8 %) 0.57 Site of malignancy
Head and neck 15 (8.7 %) 11 (73.3 %) 4 (26.7 %) Thoracic 43 (25 %) 34 (79.1 %) 9 (20.9 %) Abdomen 71 (41.3 %) 55 (77.5 %) 16 (22.5 %)
Extremities 43 (25 %) 32 (74.4 %) 11 (25.6 %) 0.94 Organ metastasis
Lung
No 86 (50 %) 69 (80.2 %) 17 (19.8 %)
Yes 86 (50 %) 63 (73.3 %) 23 (26.7 %) 0.28 Liver
No 142 (82.6 %) 108 (76.1 %) 34 (23.9 %)
Yes 30 (17.4 %) 24 (80 %) 6 (20 %) 0.64
Other
No 79 (45.9 %) 57 (72.2 %) 22 (27.8 %)
Yes 93 (54.1 %) 75 (80.6 %) 18 (19.4 %) 0.19 Number of organ metastasis
0 42 (24.4 %) 32 (76.2 %) 10 (23.8 %) 1 54 (31.4 %) 39 (72.2 %) 15 (27.8 %)
≥2 76 (44.2 %) 61 (80.3 %) 15 (19.7 %) 0.56 Treatment
Current chemotherapy regimen
None 43 (25 %) 34 (79.1 %) 9 (20.9 %) Adriamycin-based 68 (39.5 %) 50 (73.5 %) 18 (26.5 %) Gemcitabine-based 20 (11.6 %) 13 (65 %) 7 (35 %)
* Fisher exact p value † Wilcoxon rank-sum test
a Count (column %—percent of admissions with that variable) are presented unless specified
b Count (row %—percent of N in column with All patients) are presented unless specified
c Ewing sarcoma, osteosarcoma, chondrosarcoma
d Angiosarcoma, epithelioid hemangioendothelioma
e Gastrointestinal stromal tumor, Malignant fibrous histiocytoma, Interquartile range, Sequential Organ Failure Assessment, Absolute Neutrophil Count
Table 1 continued
All patientsa
(N = 172) Alive at ICU discharge
b
(N = 132) Death at ICU
b
(N = 40) p*
No. cycles of current chemotherapy, median
(IQRe) 1 (0–3) 1 (0–3) 1 (1–2) 0.80
†
No. cycles of prior chemotherapies, median (IQR) 1 (0–3) 1 (0–3) 0 (0–2) 0.037†
No. cycles of prior chemotherapies
0–1 114 (66.3 %) 88 (77.2 %) 26 (22.8 %)
≥2 58 (33.7 %) 44 (75.9 %) 14 (24.1 %) 0.85 Radiation
No 109 (63.7 %) 80 (73.4 %) 29 (26.6 %)
Yes 62 (36.3 %) 51 (82.3 %) 11 (17.7 %) 0.19 Clinical conditions present at ICU admission
Anemia 144 (83.7 %) 110 (76.4 %) 34 (23.6 %) 0.80 Hypotension 92 (53.5 %) 63 (68.5 %) 29 (31.5 %) 0.006 Septic shock 53 (30.8 %) 33 (62.3 %) 20 (37.7 %) 0.003 Bacteremia 21 (12.2 %) 14 (66.7 %) 7 (33.3 %) 0.24 Thrombocytopenia 86 (5 %) 68 (79.1 %) 18 (20.9 %) 0.47 Respiratory failure 74 (43 %) 39 (52.7 %) 35 (47.3 %) <0.0001 Acidosis 70 (40.7 %) 42 (60 %) 28 (40 %) <0.0001 Altered mental status 65 (37 %) 42 (64.6 %) 23 (35.4 %) 0.003 Abnormal glucose 60 (34.9 %) 42 (70 %) 18 (30 %) 0.13 Acute renal failure 58 (33.7 %) 35 (60.3 %) 23 (39.7 %) 0.0003 Pancytopenia 58 (33.7 %) 47 (81 %) 11 (19 %) 0.34 Pneumonia 51 (29.7 %) 32 (62.7 %) 19 (37.3 %) 0.005 Neutropenia (ANCe <1500/mm3) 51 (29.7 %) 40 (78.4 %) 11 (21.6 %) 0.73
Cardiac dysrhythmia 35 (20.3 %) 23 (65.7 %) 12 (34.3 %) 0.08 Heart failure 32 (18.6 %) 21 (65.6 %) 11 (34.4 %) 0.10 Hypertension 25 (14.5 %) 22 (88 %) 3 (12 %) 0.20* Malnutrition (protein/calorie) NOS 23 (13.4 %) 15 (65.2 %) 8 (34.8 %) 0.16 Hemorrhage 15 (8.7 %) 12 (80 %) 3 (20 %) 1.0* Gastrointestinal hemorrhage 13 (7.6 %) 12 (92.3 %) 1 (7.7 %) 0.30* Cardiac arrest 11 (6.4 %) 3 (27.3 %) 8 (72.7 %) 0.0004* Pulmonary embolism 11 (6.4 %) 8 (72.7 %) 3 (27.3 %) 0.72* Atrial fibrillation 10 (5.8 %) 7 (70 %) 3 (30 %) 0.70* Seizures/convulsions 9 (5.2 %) 8 (88.9 %) 1 (11.1 %) 0.69* ICU admission data
Mechanical v entilator 75 (43·6 %) 40 (30.3 %) 35 (87.5 %) <0.0001 Charlson comorbidity index, median (IQR) 6 (6–7) 6 (6–7) 6 (4.5–7) 0.70†
≤2 26 (15.1 %) 19 (73.1 %) 7 (26.9 %)
>2 146 (84.9 %) 113 (77.4 %) 33 (22.6 %) 0.63 SOFA admission score, median (IQR) 7 (4–10) 6 (3.5–9) 10 (6.5–14) <0.0001†
Max SOFA admission score, median (IQR) 8 (5–12) 7 (4–9.5) 14 (10–17) <0.0001†
SOFA discharge score, median (IQR) 5 (3–8) 4 (2–6) 10 (7.5–13.5) <0.0001†
The ICU mortality rates observed in the study popula-tion were consistent with those in the existing medical lit-erature and promote a case for a higher level of care with aggressive monitoring in patients who lack predictors of
poor outcomes. Our data have shown that adequate car-diac, renal, and respiratory functions play a key role in acute survival. Serial SOFA scores may serve as an objec-tive measure for short-term and long-term prognosis for
Table 2 Univariate logistic regression model for death at ICU
Odds Ratio 95 % CI p
Reason for ICU admission acidosis: yes v. no 5.000 2.317 10.788 <0.0001 Reason for ICU admission renal failure: yes v. no 3.750 1.795 7.831 0.0004 Reason for ICU admission cardiac arrest: yes v. no 10.750 2.699 42.824 0.0008 Reason for ICU admission cardiac dysrhythmia: yes v. no 2.031 0.902 4.575 0.0873 Reason for ICU admission hypotension: yes v. no 2.887 1.332 6.258 0.0072 Reason for ICU admission pneumonia: yes v. no 2.827 1.353 5.910 0.0057 Reason for ICU admission respiratory failure: yes v. no 16.691 6.086 45.775 <0.0001 Reason for ICU admission septic shock: yes v. no 3.000 1.439 6.253 0.0034 Number of organ failures 1.933 1.417 2.637 <0.0001
Number of mets 0.997 0.745 1.334 0.9835
Histology diagnosis
Unclassified high grade sarcoma 1.000
Bone (Ewing, Osteo, Chondrosarcoma) 2.204 0.716 6.788 0.1685
Vascular 0.321 0.036 2.833 0.3068
GIST 0.514 0.056 4.685 0.5552
MFH 4.286 1.019 18.029 0.0471
Muscle 2.204 0.456 10.661 0.3258
Leiomyosarcoma 0.429 0.048 3.848 0.4493
Liposarcoma 3.857 0.703 21.153 0.1200
Synovial sarcoma 4.114 0.878 19.270 0.0726
Others 2.057 0.592 7.149 0.2564
Table 3 Trends in Sequential Organ Failure Assessment (SOFA) scores and their impact on ICU and overall survival
ADM SOFA SOFA score at the time of ICU admission, MAXOFA maximum SOFA score, NE not estimated Increase in SOFA score during ICU
stay (Maximum SOFA- Admission SOFA)
No. patients in
subgroup Patients surviving ICU stay, % Patients surviving till end of study, % Median survival, d (range)
SOFA scores during ICU stay
0 or less 103 86.4 22.3 187 (108–347)
1–3 43 81.4 27.9 96 (21–193)
4–5 10 60.0 10.0 12 (2–85)
≥6 15 13.3 6.7 17 (6–22)
Admission SOFA scores
0–4 50 88.0 26.0 159 (49–289)
5–7 46 84.8 21.7 182 (38–347)
8–10 41 80.5 24.4 185 (58–494)
≥11 35 45.7 11.4 6 (2–19)
Change in SOFA scores of 35 patients with admission SOFA scores of 11 or more
≤0 18 44.4 5.6 4.5 (0.5–9)
1 6 83.3 33.3 56 (4–NE)
2 3 66.7 33.3 13 (2–NE)
Table 4 Overall survival estimates by patients and clinical characteristics in percentages
No of patients No of deaths 1-month overall survival estimate (95 % CI)
2-month overall survival estimate (95 % CI)
6-month overall survival estimate (95 % CI)
p
All patients 172 135 64 (57–71) 57 (49–64) 41 (33–48) Age (years)
<65 139 109 64 (56–72) 56 (47–64) 41 (33–50)
≥65 33 26 64 (45–77) 61 (42–75) 37 (21–54) 0.91 Gender
Female 93 72 66 (56–75) 60 (49–69) 45 (34–55)
Male 79 63 62 (50–71) 48 (37–59) 36 (25–47) 0.33 Histological diagnosis
Unclassified high-grade
sarcoma 43 34 67 (51–79) 58 (42–71) 46 (30–60) Bonesa 30 25 70 (50–83) 60 (40–75) 38 (21–55)
Vascularb 17 16 64 (36–82) 51 (25–72) 32 (12–54)
GIST 11 7 73 (37–90) 64 (30–85) 45 (17–71) MFH 11 8 55 (23–78) 55 (23–78) 36 (11–63) Muscle 10 9 60 (25–83) 60 (25–83) 20 (3–47) Leiomyosarcoma 13 7 84 (50–96) 84 (50–96) 75 (40–91) Liposarcoma 7 7 29 (4–61) 29 (4–61) 29 (4–61) Synovial sarcoma 9 6 56 (20–80) 56 (20–80) 56 (20–80)
Others 21 16 56 (33–74) 45 (23–65) 28 (11–49) 0.07 Status of malignancy
First course of
chemo-therapy 29 22 66 (45–8) 55 (35–71) 41 (22–59) Progression 59 56 49 (36–61) 37 (25–49) 17 (9–27) Stable disease or partial
remission 61 41 75 (62–84) 72 (58–81) 61 (47–72) Complete remission 4 2 100 100 75 (13–96) Mixed response 6 5 67 (19–90) 67 (19–90) 67 (19–90)
Unknown 13 9 68 (36–87) 68 (36–87) 29 (7–56) <0.0001 Site of malignancy
Head and neck 15 11 52 (25–73) 52 (25–73) 29 (9–53) Thoracic 43 33 67 (51–79) 60 (43–73) 46 (30–60) Abdomen 71 57 62 (49–72) 53 (41–64) 37 (26–48)
Extremities 43 34 7 (54–81) 63 (47–75) 46 (31–60) 0.86 Organ metastasis
Lung
No 86 62 66 (55–75) 59 (48–69) 46 (35–56)
Yes 86 73 62 (51–72) 55 (43–65) 36 (25–46) 0.02 Liver
No 142 109 66 (58–73) 59 (51–67) 46 (37–54)
Yes 30 26 56 (36–72) 45 (27–62) 17 (6–33) 0.0093 Other
No 79 55 66 (54–75) 63 (51–73) 49 (38–60)
Yes 93 80 63 (52–72) 52 (41–62) 33 (24–43) 0.0091 Number of organ metastases
0 42 25 71 (55–83) 69 (53–81) 59 (43–72) 1 54 43 59 (45–71) 53 (39–65) 40 (26–53)
Table 4 continued
No of patients No of deaths 1-month overall survival estimate (95 % CI)
2-month overall survival estimate (95 % CI)
6-month overall survival estimate (95 % CI)
p
Localized disease
No 130 110 62 (53–7) 53 (44–61) 34 (26–43)
Yes 42 25 71 (55–83) 69 (53–81) 59 (43–72) <0.0001 Treatment
Current chemotherapy regimen
None 43 31 57 (41–7) 52 (36–66) 39 (24–53) Adriamycin-based
chemotherapy 68 51 69 (56–78) 66 (53–76) 51 (38–63) Gemcitabine-based
therapy 20 18 5 (27–69) 45 (23–65) 25 (9–45)
Targeted therapy 41 35 71 (54–82) 54 (37–67) 34 (20–49) 0.31 Radiation
No 109 85 63 (54–72) 59 (49–67) 39 (29–48)
Yes 62 50 65 (52–76) 53 (40–65) 43 (30–55) 0.86 Clinical conditions present at ICU admission
Anemia 144 113 66 (57–73) 59 (50–66) 43 (35–51) 0.60 Hypotension 92 73 57 (46–66) 51 (40–61) 42 (32–52) 0.96 Septic shock 53 44 49 (35–62) 45 (32–58) 33 (21–46) 0.10 Bacteremia 21 17 57 (34–75) 57 (34–75) 43 (22–62) 0.58 Thrombocytopenia 86 63 71 (60–79) 64 (52–73) 49 (37–59) 0.037 Respiratory failure 74 62 46 (34–56) 41 (30–52) 26 (16–37) <0.0001 Acidosis 70 58 47 (35–58) 41 (30–53) 35 (24–46) 0.011 Altered mental status 65 57 52 (39–63) 42 (30–54) 25 (15–36) 0.001 Abnormal glucose 60 50 60 (46–71) 49 (36–61) 25 (14–37) 0.017 Acute renal failure 58 49 48 (35–60) 40 (27–52) 29 (18–41) 0.016 Pancytopenia 58 41 79 (66–88) 74 (61–83) 57 (43–69) 0.006 Respiratory abnormality 53 38 73 (59–83) 64 (49–75) 49 (35–62) 0.036 Pneumonia 51 42 53 (38–65) 49 (35–62) 35 (22–48) 0.41 Neutropenia
(ANC <1500/mm3) 51 36 78 (64–87) 70 (56–81) 58 (43–70) 0.013
Cardiac dysrhythmia 35 26 57 (39–72) 51 (34–66) 46 (29–61) 0.96 Heart failure 32 25 63 (44–77) 56 (37–71) 53 (34–68) 0.80 Hypertension 25 15 80 (58–91) 71 (48–85) 61 (39–78) 0.049 Malnutrition (protein/
calorie) NOS 23 21 60 (37–77) 60 (37–77) 28 (11–47) 0.047 Hemorrhage
(non–gas-trointestinal) 15 9 64 (34–83) 64 (34–83) 47 (19–71) 0.44 Other pulmonary
insuf-ficiency 14 11 71 (41–88) 64 (34–83) 64 (34–83) 0.71 Gastrointestinal
hemor-rhage 13 9 62 (31–82) 54 (25–76) 38 (14–63) 0.51 Cardiac arrest 11 8 27 (7–54) 27 (7–54) 27 (7–54) 0.17 Pulmonary embolism 11 10 73 (37–90) 63 (29–84) 32 (8–59) 0.21 Atrial fibrillation 10 7 70 (33–89) 70 (33–89) 6 (25–83) 0.40 Seizures 9 8 67 (28–88) 44 (14–72) 30 (5–61) 0.54 ICU admission data
Charlson comorbidity index
≤2 26 15 69 (48–83) 69 (48–83) 54 (33–71)
Table 4 continued
No of patients No of deaths 1-month overall survival estimate (95 % CI)
2-month overall survival estimate (95 % CI)
6-month overall survival estimate (95 % CI)
p
Charlson comorbidity index
<6 42 25 71 (55–83) 69 (53–81) 59 (43–72)
≥6 130 110 62 (53–70) 53 (44–61) 34 (26–43) <0.0001 SOFA maximum score
<8 79 60 82 (72–89) 71 (60–80) 49 (38–60)
≥8 93 75 49 (39–59) 45 (34–55) 33 (24–43) 0.005 SOFA discharge score
<5 77 59 80 (69–88) 71 (59–80) 47 (35–58)
≥5 95 76 51 (41–61) 46 (36–56) 36 (26–45) 0.12 No. organ failures
1 59 47 76 (63–85) 69 (56–79) 53 (40–65)
≥2 113 88 58 (48–66) 50 (41–59) 34 (25–43) 0.12
ADM SOFA SOFA score at the time of ICU admission, MAXOFA maximum SOFA score, NE not estimated a Ewing sarcoma, osteosarcoma, chondrosarcoma
b Angiosarcoma, epithelioid hemangioendothelioma
sarcoma. There appears to be significant heterogeneity in ICU mortality among all cancer patients because of a lack of data comparing similar histologies. Our patient popu-lation had an ICU mortality rate of 23 %, which is com-parable to the 20 % mortality in solid tumors [10]. The same study reported that ICU and in-hospital mortality rates for cancer patients were not significantly different from those of non-cancer patients [10]. However, among patients with multiple organ failures; mortality rates were higher in cancer patients than in non-cancer patients. This finding is consistent with our study, in which the number of organ failures was directly proportional to
ICU mortality. Among mortality statistics reported for specific tumors, patients with head and neck cancer, lung cancer, and gynecological malignancies have been shown to have ICU mortality rates of 39, 36, and 17.3 %, respec-tively [11–13]. In contrast, patients with hematological cancers have been reported to have higher ICU mortal-ity rates: 48.3 and 56 % in two separate studies [14, 15]. These higher rates may be attributed to increased sever-ity of illness and higher incidence of sepsis due to associ-ated leukopenia in these patients [10].
Several ICU scores; including MODS, APACHE II, SAPS II, and SOFA, have been used as objective ways to describe mild to severe organ dysfunction [16–19]. In our study, we used SOFA scores, which have been calibrated to predict ICU and in-hospital mortality rates in cancer patients by evaluating the combination of clinical condi-tions that lead to ICU admission [20–23].
We found out those patients who had high SOFA scores on admission did worse than patients with lower SOFA scores. Another important objective finding was that patients whose SOFA scores continued to rise following admission to the ICU had the worst outcomes, making these patients appropriate candidates for early supportive and palliative care. As a general guide, increase in scores of 6 or more since admission led to drastic changes in outcome and ICU survival decreased from 60 to 13.3 % (Table 3). A patient who is admitted with a SOFA score of 11 or higher and their score increases by 3 or more has dismal ICU survival of 12.5 %. Such a patient should be considered for transition to hospice (Table 3).
Among individual clinical findings on ICU admissions, patients with cardiac arrest had the worst prognosis, with an ICU mortality rate of 72 % (8/11) and a median OS of 24 h. However, cardiopulmonary resuscitation has been shown to be a non-beneficial intervention in more than 90 % of the patients with cancer [24–26]. In our univariate analysis, patients with respiratory failure had worse outcomes than patients with good respiratory sta-tus. Mechanical ventilation has been shown to be asso-ciated with increased mortality rates (73 %) in cancer patients, especially those with disseminated disease and poor performance status at the time of ICU admission [27]. Similar findings have been observed in patients with hematological, lung, and head and neck cancers in the ICU setting (64–74 %) [20, 28–30].
Hypotension and septic shock are additional clinical findings that correlated with higher ICU mortality in our multivariate analysis. Sepsis is one of the leading causes of ICU admission in cancer patients. However, patients with infections leading to shock and vasopressor use tend to do poorly and should be managed conservatively [10,
13, 15, 27]. Patients with acute kidney injury also have high acute mortality. This trend is more commonly seen
Table 5 Multivariable cox proportional hazards model for overall survival
Initially included in the model and then reduced by stepwise selection method: histology diagnosis, status of malignancy, number of organ metastasis, number of organ failures, and reason for ICU admission: acidosis, acute renal failure, pancytopenia, respiratory failure, and septic shock. There were 13 patients without known malignancy status who were not included in this analysis
CI confidence interval, GIST Gastrointestinal stromal tumor, MFH Malignant fibrous histiocytoma, CCI Charlson comorbidities index, SOFA Sequential Organ Failure Assessment
a Ewing sarcoma, osteosarcoma, chondrosarcoma
b Angiosarcoma, epithelioid hemangioendothelioma
Variable Hazard
ratio 95 % CIP p
Histological diagnosis 0.006 Unclassified high-grade
sarcoma 1.000
Bonesa 0.881 0.516 1.506 0.64
Vascularb 1.657 0.862 3.185 0.13
GIST 0.281 0.119 0.662 0.004 MFH 0.674 0.236 1.929 0.46 Muscle 2.048 0.917 4.573 0.08 Leiomyosarcoma 0.375 0.160 0.880 0.02 Liposarcoma 1.412 0.575 3.468 0.45 Synovial sarcoma 0.793 0.293 2.143 0.65 Others 0.746 0.373 1.493 0.41 Status of malignancy 0.003
Complete remission 1.000
First course of chemotherapy 2.323 0.473 11.425 0.30 Mixed response 2.720 0.444 16.677 0.28 Progression 5.172 1.075 24.874 0.04 Stable disease 2.262 0.501 10.218 0.29 Reason for ICU admission pancytopenia
No
Yes 0.351 0.226 0.546 <0.0001 Reason for ICU admission respiratory failure
No
Yes 1.703 1.125 2.579 01 CCI (continuous) 1.139 1.023 1.268 02 SOFA score at discharge
in patients with hematological malignancies [31]. Fur-thermore, renal replacement therapy has been associated with high ICU mortality [24]. Given their bleak progno-ses, patients with these individual or combinations of clinical findings should be triaged early so that inappro-priate use of aggressive therapy can be avoided.
There are limited data evaluating long-term survival rates of critically ill cancer patients after their discharge from the ICU. Six-month OS in sarcoma patients was 41 % in our study, which is comparable to the 6-month mortality rates of 59.3 and 66 % reported in critically ill patients with hematological malignancies [28, 30]. How-ever, long-term mortality rates of 63 to 98 % have been reported in patients with lung cancer. The major pre-dictors of long-term prognosis in these patients were dependence on mechanical ventilation during the ICU stay and progression of cancer after discharge from the ICU [11]. In our study, we found that the status of malig-nancy, metastatic disease, Charlson comorbidity index and SOFA scores at discharge, and the presence of res-piratory failure or cytopenia at the time of ICU admis-sion were significant predictors of survival outcomes in both univariate and multivariate analyses (Table 4). Therefore, when looking at patterns of long-term sur-vival after ICU stay, the above-mentioned clinical prog-nostic factors should be considered early in the clinical course.
There were a number of limitations to this study. First, this is a single-institution retrospective study covering a limited number of years. We are a tertiary care referral center for sarcomas, so the results of our study may not be applicable to smaller hospitals or low-volume centers. Each hospital has its own ICU admission and discharge policies which may bias the results of a single center study. Second, our study did not have a control group to compare the outcomes of critically ill sarcoma patients who were not admitted to the ICU and were managed conservatively. Even though it is a large collection of a rare tumor our study outcomes were limited to only 40 events in the ICU. Due to a small number of events and multiple risk factors, it is difficult to make a generalized presumption of which risk factor individually impacted the short term survival. In addition, quality-of-life meas-ures and performance status scores could not be reliably collected in the retrospective setting.
In conclusion, our study is the largest study to date of OS in sarcoma patients admitted to the ICU. In our study span of 7 years, we have shown that OS in sarcoma is comparable with that of critically ill patients with other solid tumors. The admission SOFA scores and change in the SOFA scores during ICU stay are highly reliable indicators of probability of survival and should be used in decision making in critically ill patients. Our results
suggest that patients with advanced malignancy that are admitted to the ICU for respiratory failure, cardiac arrest, septic shock, acute renal failure or acidosis and have high SOFA score with subsequent worsening in the ICU have very poor prognosis. Based on the retrospec-tive data which needs further validation we can recom-mend that judicious approach should be taken in patients with predictors of poor survival before subjecting them to aggressive treatment.
Authors’ contributions
RG, DA, RB, SP, JL, and VR were responsible for the study concept. All authors contributed to the study design. RG, NR, and EJR collected and assembled these data. NR, JS, and XL analyzed and interpreted these data. RG and NH wrote the initial draft, and all the authors approved the final draft of the report. All authors read and approved the final manuscript.
Author details
1 The University of Texas at Houston Internal Medicine Residency Program, Houston, TX, USA. 2 The University of Texas Graduate School of Biomedical Sciences at Houston, Houston, TX, USA. 3 Division of Quantitative Sciences, The University of Texas MD Anderson Cancer Center, Houston, TX, USA. 4 Depart-ment of Critical Care, The University of Texas MD Anderson Cancer Center, Houston, TX, USA. 5 Department of Sarcoma Medical Oncology, The University of Texas MD Anderson Cancer Center, 1515 Holcombe Blvd # 450, Houston, TX 77030, USA.
Acknowledgements
We did not have any financial support. We thank critical care team for provid-ing the initial data and SOFA scores. We thank statisticians Naveen Ramesh, Xiudong Lei and Juhee Song. The statistical analysis work was supported in part by the Cancer Center Support Grant (NCI Grant P30 CA016672). We thank scientific editors, Bryan Tutt and Tamara Locke, in Department of Scientific Publications at MD Anderson for manuscript editing.
Poster presented at 2014 American Society of Clinical Oncology National Meeting, Chicago, IL.
Competing interests
The authors declare that they have no competing interests.
Received: 5 March 2016 Accepted: 17 June 2016
References
1. Fletcher CDM, Bridge JA, Hogendoorn P, Mertens F. World Health Organi-zation classification of tumors of soft tissue and bone. 4th ed. Lyon: IARC Press; 2013.
2. Mackall CL, Meltzer PS, Helman LJ. Focus on sarcomas. Cancer Cell. 2002;2:175–8.
3. Chassin MR. Costs and outcomes of medical intensive care. Med Care. 1982;20:165–79.
4. Turnbull A, Goldiner P, Silverman D, et al. The role of an intensive care unit in a cancer center. An analysis of 1035 critically ill patients treated for life-threatening complications editorial. Cancer. 1976;37:82–4.
5. Shapira DV, Studnicki J, Bradham DD. Intensive care, survival and expense of treating critically ill cancer patients. JAMA. 1993;269:783–6.
6. Azoulay E, Moreau D, Alberti C, et al. Predictors of short-term mortal-ity in critically ill patients with solid malignancies. Intensive Care Med. 2000;26:1817–23.
7. Lecuyer L, Chevret S, Thiery G, et al. The ICU trial: a new admission policy for cancer patients requiring mechanical ventilation. Critical Care Med. 2007;35:808–14.
• We accept pre-submission inquiries
• Our selector tool helps you to find the most relevant journal • We provide round the clock customer support
• Convenient online submission • Thorough peer review
• Inclusion in PubMed and all major indexing services • Maximum visibility for your research
Submit your manuscript at www.biomedcentral.com/submit
Submit your next manuscript to BioMed Central
and we will help you at every step:
9. Charlson ME, Pompei P, Ales KL, et al. A new method of classifying prog-nostic comorbidity in longitudinal studies: development and validation. J Chronic Dis. 1987;40:373–83.
10. Taccone FS, Artigas AA, Sprung CL, et al. Caracteristics and outcomes of cancer patients in European ICUs. Crit Care. 2009;13:R15.
11. Soubani AO, Ruckdeschel JC. The outcome of medical intensive care for lung cancer patients: the case for optimism. J Thorac Oncol. 2011;6:633–8.
12. Namendys-Silva SA, González-Herrera MO, Texcocano-Becerra J, et al. Outcomes of critically ill gynecological cancer patients admitted to intensive care unit. Am J Hosp Palliat Care. 2013;30:7–11.
13. Soares M, Salluh JI, Ferreira CG, et al. Prognosis of lung cancer patients with life-threatening complications. Chest. 2007;131:840–6.
14. Pène F, Azoulay E, Blot F, et al. Outcome of critically ill allogeneic hemat-opoietic stem-cell transplantation recipients: a reappraisal of indications for organ failure supports. J Clin Oncol. 2006;24:643–9.
15. Geerse DA, Span LF, Pinto-Sietsma SJ, et al. Prognosis of patients with haematological malignancies admitted to the intensive care unit: sequential Organ Failure Assessment (SOFA) trend is a powerful predictor of mortality. Eur J Intern Med. 2011;22:57–61.
16. Marshall JC, Cook DJ, Christou NV, et al. Multiple organ dysfunction score: a reliable descriptor of a complex clinical outcome. Crit Care Med. 1995;23:1638–52.
17. Vincent JL, Moreno R, Takala J, et al. The SOFA (Sepsis-related Organ Fail-ure Assessment) score to describe organ dysfunction/failFail-ure. On behalf of the Working Group on Sepsis-Related Problems of the European Society of Intensive Care Medicine. Intensive Care Med. 1996;22:707–10. 18. Knaus WA, Draper EA, Wagner DP, et al. APACHE II: a severity of disease
classification system. Crit Care Med. 1985;13:818–29.
19. Le Gall JR, Lemeshow S, Saulnier F. A new simplified acute physiology score (SAPS II) based on a European/North American multicenter study. JAMA. 1993;270:2957–63.
20. Reichner CA, Thompson JA, O’Brien S, et al. Outcome and code status of lung cancer patients admitted to the medical ICU. Chest. 2006;130:719–23.
21. Soares M, Caruso P, Silva E, et al. Characteristics and outcomes of patients with cancer requiring admission to intensive care units: a prospective multicenter study. Crit Care Med. 2010;38:9–15.
22. Owczuk R, Wujtewicz MA, Sawicka W, et al. Patients with haematologi-cal malignancies requiring invasive mechanihaematologi-cal ventilation differences between survivors and non-survivors in intensive care unit. Support Care Cancer. 2005;13:332–8.
23. Cárdenas-Turanzas M, Ensor J, Wakefield C, et al. Cross-validation of a sequential organ failure assessment score-based model to predict mor-tality in patients with cancer admitted to the intensive care unit. J Crit Care. 2012;27:673–80.
24. Heo SJ, Kim G, Lee CK, et al. Prediction of short- and long-term survival for advanced cancer patients after ICU admission. Support Care Cancer. 2014;1:1–9.
25. Wallace S, Ewer MS, Price KJ, et al. Outcome and cost implications of cardiopulmonary resuscitation in the medical intensive care unit of a comprehensive cancer center. Support Care Cancer. 2002;10:425–9. 26. Reisfield GM, Wallace SK, Munsell MF, et al. Survival in cancer patients
undergoing in-hospital cardiopulmonary resuscitation: a meta-analysis. Resuscitation. 2006;71:152–60.
27. Azevedo LC, Caruso P, Silva UV, et al. Outcomes for patients with cancer admitted to the ICU requiring ventilatory support: results from a prospec-tive multicenter study. Chest. 2014;146:257–66.
28. Bird GT, Farquhar-Smith P, Wigmore T, et al. Outcomes and prognostic fac-tors in patients with hematological malignancy admitted to a specialist cancer intensive care unit: a 5 yr study. Br J Anesth. 2012;108:452–9. 29. Soares M, Salluh JI, Toscano L, et al. Outcomes and prognostic factors in
patients with head and neck cancer and severe acute illnesses. Intensive Care Med. 2007;33:2009–13.
30. Benoit DD, Vandewoude KH, Decruyenaere JM, et al. Outcome and early prognostic indicators in patients with a hematologic malignancy admit-ted to the intensive care unit for a life-threatening complication. Crit Care Med. 2003;31:104–12.