R E S E A R C H A R T I C L E
Open Access
Associations between brain microstructures,
metabolites, and cognitive deficits during chronic
HIV-1 infection of humanized mice
Michael D Boska
1†, Prasanta K Dash
2†, Jaclyn Knibbe
2, Adrian A Epstein
1,2, Sidra P Akhter
2, Natasha Fields
2,
Robin High
3, Edward Makarov
2, Stephen Bonasera
4, Harris A Gelbard
5, Larisa Y Poluektova
2,
Howard E Gendelman
2,4*and Santhi Gorantla
2Abstract
Background:Host-species specificity of the human immunodeficiency virus (HIV) limits pathobiologic, diagnostic and therapeutic research investigations to humans and non-human primates. The emergence of humanized mice as a model for viral infection of the nervous system has overcome such restrictions enabling research for HIV-associated end organ disease including behavioral, cognitive and neuropathologic deficits reflective of neuroAIDS. Chronic HIV-1 infection of NOD/scid-IL-2Rgc
null
mice transplanted with human CD34+hematopoietic stem cells (CD34-NSG) leads to persistent viremia, profound CD4+T lymphocyte loss and infection of human monocyte-macrophages in the meninges and perivascular spaces. Murine cells are not infected with virus.
Methods:Changes in mouse behavior were measured, starting at 8 weeks after viral infection. These were recorded coordinate with magnetic resonance spectroscopy metabolites including N-acetylaspartate (NAA), creatine and choline. Diffusion tensor magnetic resonance imaging (DTI) was recorded against multispectral immunohistochemical staining for neuronal markers that included microtubule associated protein-2 (MAP2), neurofilament (NF) and synaptophysin (SYN); for astrocyte glial fibrillary acidic protein (GFAP); and for microglial ionized calcium binding adaptor molecule 1 (Iba-1). Oligodendrocyte numbers and integrity were measured for myelin associated glycoprotein (MAG) and myelin oligodendrocyte glycoprotein (MOG) antigens.
Results:Behavioral abnormalities were readily observed in HIV-1 infected mice. Longitudinal open field activity tests demonstrated lack of habituation indicating potential for memory loss and persistent anxiety in HIV-1 infected mice compared to uninfected controls. End-point NAA and creatine in the cerebral cortex increased with decreased MAG. NAA and glutamate decreased with decreased SYN and MAG. Robust inflammation reflected GFAP and Iba-1 staining intensities. DTI metrics were coordinate with deregulation of NF, Iba-1, MOG and MAG levels in the whisker barrel and MAP2, NF, MAG, MOG and SYN in the corpus callosum.
Conclusions:The findings are consistent with some of the clinical, biochemical and pathobiologic features of human HIV-1 nervous system infections. This model will prove useful towards investigating the mechanisms of HIV-1 induced neuropathology and in developing novel biomarkers and therapeutic strategies for disease.
Keywords:1H magnetic resonance spectroscopy, Behavioral and cognitive deficits, Diffusion tensor imaging, HIV-1, Humanized mice
* Correspondence:hegendel@unmc.edu
†Equal contributors
2
Department of Pharmacology and Experimental Neuroscience, University of Nebraska Medical Center, Omaha, NE 68198, USA
4
Department of Internal Medicine, University of Nebraska Medical Center, Omaha, NE 68198, USA
Full list of author information is available at the end of the article
Background
Persistent HIV-1 infection commonly leads to cognitive, behavioral and motor abnormalities called HIV-associated neurocognitive disorders (HAND) [1-3]. Despite intensive research, investigations seeking virus-associated central nervous system (CNS) biomarkers and HAND therapies have failed, in measure, due to the multifactorial nature of disease and by few relevant small animal models [4-6]. The obstacles in generating a small animal model require that viral tropism, neuroimmune activation, cognitive im-pairments and CD4+ T cell losses are operative [1,7,8]. This has remained an unmet goal. Added to these obsta-cles in mirroring human disease are the concomitant use of abuse drugs, common opportunistic infections, hepatic dysfunction, nutritional deficiencies, social demographics, ongoing antiretroviral therapies, psychiatric illness, aging and altered immune responses often seen in infected humans [9]. The shift in human disease severity, from overt dementia to subtle cognitive dysfunction, affects changes disease demographics and as such has also made modeling of human disease even more complex [10,11]. This has occurred as a consequence of the wide spread use of antiretroviral therapy (ART) [3,12].
Despite considerable improvements in disease severity up to half of infected patients show deficits in memory and psychomotor functions. Disease can readily be seen through neuropsychological testing using common met-rics of cognitive function [13-16]. Such deficits are im-portant as they can deeply affect the quality of life and making research into ways to find better diagnostics and therapeutic interventions timely and important [17-19]. However, in order to accomplish these goals model sys-tems of current human disease are needed. Divergent viral-induced immune and cognitive deficits seen as a consequence of viral infection and ART need be consid-ered. Indeed, early evidence that the terminal stages of end organ HIV disease could be reflected in rodent models of neuroAIDS was realized, over the past decade, within our own laboratories [5,20-23]. However, despite creating such models, no cross validation of the intersec-tion between immune and behavior abnormalities were realized. If this were possible, such a model could speed the discovery of new pathways of disease towards better understanding viral pathogenesis and even allow early diagnostic studies [5,24,25]. To these ends, we now dem-onstrate, for the first time, cross species transference of immune and viral factors that lead to neurocognitive deficits, neuropathology, brain metabolite alterations, and brain subregion damage in virus-infected NOD/scid -IL-2Rgcnull humanized mice (CD34-NSG). As such the work represents a substantive step forward from current models [22]. Remarkably, the observed metabolic [proton magnetic resonance spectroscopy (1H MRS)], microstruc-tural [diffusion tensor magnetic resonance imaging (DTI)],
histologic and behavioral aberrations that characterize hu-man disease are partially replicated in the mice and as such mirror components of neuroAIDS. The model none-theless provides unique insights in the biomolecular mech-anisms of how HIV-1 infection affects neural function.
Results
Overview
Humanized mice for studies were divided into replicate HIV-1 infected and uninfected animal groups. Imaging was performed and blood samples acquired from all ani-mals prior to and from four weeks to 16 weeks after in-fection. At 16 week animals were perfused with normal saline and the brains were harvested for histopatho-logical evaluations. The experimental scheme is outlined in Figure 1. The overall experimental design enabled cross validation of all bioimaging, viral and, immune tests with brain histopathology for each animal. In paral-lel experiments, mice were evaluated for behavior by open field activity (OFA). These were chosen to reflect memory and anxiety in mice. Using replicate animals for behavioral tests avoided confounding influences of the anesthesia which was required for all bioimaging tests.
Immunologic and virologic features of HIV-1 infection in humanized mice
CD34-NSG mice were monitored prospectively for blood CD4+and CD8+ T cells (Figure 2A). At 22 weeks of age, mice (n = 20) were infected with HIV-1ADA. VL and CD4+ and CD8+ T cells were analyzed at 4, 8, 12 and 16 weeks after infection (Figure 2B) from the 100 μl of blood col-lected immediately following MRS and DTI studies. Steady decreases in total CD4+T cells with concomitant increases in CD8+cells were observed (Figure 2A) during the course of HIV infection. Viral load (VL, copies/ml blood) peaked at eight weeks after viral infection and all infected animals had sustained VL (7.05 × 10⁵to 1.5 × 10⁷) until 16 weeks where reductions in total human cells (as measured by CD45) mirrored decreases in VL (4.77 × 10³to 5.1 × 10⁶). Replicate uninfected controls (n = 10) demonstrated stable CD45 and CD4/CD8 ratios throughout the study.
VL and identifications of infected cells
the cell targets for viral infection in the periphery (spleen) and nervous system (brain). In regards to the former, HIV-1 infected CD4+ T lymphocytes and monocyte-macrophages were readily seen in both the follicular and parafollicular areas, respectively (see Additional file 1A for high power illustration). In contrast, only few numbers of infected macrophages were observed in the brain as dual labeled CD163 and HIV-1p24 cells. These were identified in the meninges and perivascular spaces, as was reported previously [5,21] (Additional file 1B and C). This served to
highlight the lack of association between viral levels and neuropathology and differences in numbers of infected cells seen in the periphery (spleen) as compared to the brain. Indeed, large numbers of infected CD4+ T lympho-cytes and monocyte-macrophages were identified in the spleen.
Behavioral deficits
The behavioral phenotypes of the HIV-1 infected human-ized CD34-NSG mice were compared to uninfected
Figure 1Timings for data acquisition in combined blood, neuroimaging, and histology assessments.
Figure 2VL and immune profiles in HIV-1 infected humanized mice. (A)Flow cytometric analysis of CD4+and CD8+T cells in blood of
HIV-1 infected mice (n = 10). The x-axis is the weeks following HIV-1 infection.(B)VL dynamics in plasma of replicate blood samples from
A. Mice were bled once every 4 weeks starting from 2ndweek post-infection. Mean ± SEM are shown in bothAandB.(C)Total HIV-1gag RNA
controls by OFA testing [26-28] in a replicate mice. Here, mice are placed in an enclosure that permits exploration of a new environment. Spatial distribution, horizontal and ver-tical movements are then measured to assess exploratory behaviors. By the third trial, reductions in total horizontal distance and vertical movements in uninfected controls reflected mouse habituation associated with loss of anxiety
and memory of the environment [27,29]. Unlike uninfected controls, HIV-1 infected animals showed unremitting ac-tivity even at the third trial demonstrating continued anx-iety (Figure 3A). Implementing OFA measurements over successive trials at monthly intervals permitted inves-tigation of the level of memory with HIV-1 infection (Figure 3B). Analysis of central zone activities, expressed as
Figure 3Effect of HIV-1 infection of humanized CD34-NSG mice on cognition. (A)Schematic diagram is illustrated showing the
experimental plan used and results. Three consecutive trials of OFA testing were done at 12–13 weeks after HIV-1 infection. Replicate control mice were injected with PBS for OFA testing at the same time intervals. Mice were tested using 20 min sessions for three consecutive days (3 trials). Mice were bled from sub-mandibular vein under isoflurane inhalation anesthesia for flow cytometry and VL measurements. Total distance travelled measured in the floor plane and vertical entries were measured in the vertical plane. These reflect the exploratory and habituation behavior of the mice in a new environment. Both measurements were reduced by the 2ndand 3rdtrials in uninfected controls reflecting habituation. HIV-1 infected animals
exhibit continued anxiety. *, p < 0.05 compared to 1sttrial and #, p < 0.05 compared to 2ndtrial. Values are mean ± SEM.(B)OFA testing was performed
the ratio between times spent in the margin to total time (Figure 3B) indicated significant differences between animal groups at 4 and 8 weeks after repeated testing and infec-tion. Control animals demonstrated memory of the envir-onment that is not seen in the infected animal groups. Measures of central/total time 4 and 8 weeks demonstrated that loss of anxiety readily occurred in uninfected mice but not HIV-1 infected animals. These animals showed contin-ued anxiety by thigmotaxis [30]. These tests best assess ex-ploratory behavior, locomotor activity and anxiety-like behavior and were employed based on the fragile nature of the animals that would not tolerate the more rigorous Morris water maze testing.
Multispectral fluorescence imaging of immunohistology
Neuronal and glial antigens were analyzed by multispec-tral fluorescence imaging of replicate brain regions at study termination. Images of each fluorescent spectral component were analyzed following staining. Neuronal density was assessed using neuronal microtubule associ-ated protein-2 (MAP2) and neurofilament (NF). Synaptic density was assessed using synaptophysin (SYN). Activa-tion of astrocytes was assessed using glial fibrillary acidic
protein (GFAP). Microglial activation was measured using ionized calcium binding adaptor molecule 1 (Iba-1). Oligodendrocyte numbers and integrity were measured by myelin associated glycoprotein (MAG) and myelin oligodendrocyte glycoprotein (MOG) antigens. (Figure 4). These antigens are expressed as fluorescence intensity per μm2(Figure 4B). Data from 20 infected animals were com-pared to 10 uninfected controls.
SYN expression showed punctate and diffuse distribu-tion in cortical areas of control animals, but in case of HIV-1 infected animals, SYN labeled regions were ir-regularly shaped with significantly decreased expression and fluorescence intensity in the M2 region of the cortex (Additional file 2) with a trend towards decreased SYN in the whisker barrels (Figure 4B). No significant altered expressions of SYN were seen in the 4 subregions of hippocampus. GFAP expression was increased in 3 re-gions of hippocampus (CA1, CA3 (Additional file 2) and DG (Figure 4)). This reflects astrocyte activation re-sponses that commonly follow HIV-1 infection. Micro-glial expression, measured by Iba-1 staining, increased in the M2 region of the cortex (Additional file 2), the whis-ker barrels, and the dentate gyrus (Figure 4). In contrast,
Figure 4Immunofluorescence staining of neuronal and glial antigens following HIV-1 infection.Paraffin embedded 5μM brain sections were immunostained with MAP2, SYN, NF, GFAP, MAG and Iba1 antibodies.(A)Representative images captured at 40× magnification from whisker barrel (WB), corpus collosum (CC) and Dentate gyrus, (DG) are shown for those markers significantly deregulated after HIV-1 infection.
significant reductions in NF-positive fibers were ob-served in the whisker barrels and corpus callosum of HIV-1 infected mice (Figure 4) while changes in NF ex-pression between infected and uninfected brains were not seen in the hippocampus (Additional file 2). These results, taken together, demonstrate that HIV-1 infected humanized mice are distinct from previous injection models of HIV-1 encephalitis where glial inflammatory re-sponses drive more significant neurodegeneration [5,23]. Nonetheless, the reduced presynaptic and neurofilament expression seen in the cortical and white matter regions of the humanized virus-infected mice indicate ongoing neu-rodegeneration potentially compatible with an orthograde axonopathy.
We next analyzed MOG and MAG in the white and grey matter regions to assess oligodendrocyte and mye-lin density. MOG, is a myemye-lin component of the CNS and responsible for maintenance of the myelin sheath, cell adhesion and oligodendrocyte microtubule stability. MOG is localized on the oligodendrocyte cell surface and on the outermost lamellae of mature myelin. MAG is a nervous system cell surface adhesion protein that is involved in linking myelinated cells to neuronal axons. Like myelin, MAG inhibits axonal outgrowth and con-tributes to the inhibitory properties of myelin. We ob-served significantly decreased MAG expression in the whisker barrels, corpus callosum, and hippocampus re-gions DG (Figure 4), CA1, and CA3 (Additional file 2) in HIV infected animals. Decreased MOG expression was observed in the whisker barrels and corpus callosum of infected animals (Figure 4) suggesting loss of axonal fiber elements responsible for HIV-1 associated grey and white matter damage.
Correlations between antigens and viral load (VL)
Mean results provide a picture of damage focused in the cortex and white matter tracts. Hippocampus is affected primarily with inflammation. The degree of damage is as-sociated, in measure, with the mean virus concentration in the blood over the course of infection. We hypothesized that variability between individual mice infection level (VL range 5 × 10⁴to 6 × 10⁶copies/ml blood) would lead to differing severities of neuronal disease as reflected by quantitative histological measures. Surprisingly, there were no significant correlations between the virus levels and the quantitative immunohistology. Only trends between MAG reductions in the corpus callosum (r = -0.386, p = 0.1) and GFAP in the dentate gyrus (r = -0.399, p = 0.098) were found.
Neuroimaging
Within a subset of the animals studied we acquired 1H MRS and DTI at four week intervals from preinfection, to 16 weeks post infection in both infected animals (n = 8)
and uninfected humanized NSG mice as controls (n = 7). In addition to comparing the groups over time to deter-mine the kinetics of brain pathology in this model, results for the individual infected animals were tested for correla-tions to virus levels and histopathology to aid in the inter-pretation of changes observed.
1
H MRS
Mean metabolic consequences of HIV-1 infection as com-pared to uninfected animals can be seen in the cerebral cortex (Figure 5A, B). Reduced NAA and increased GABA were seen at 12 weeks and reversed at 16 weeks in the cerebral cortex but not in the cerebellum (Figure 5C, D). Notably, a large increase in lactate was observed in the cerebral cortex at 16 weeks after infection (Figure 5A, B). Other metabolic effects of infection include reductions of creatine and choline in the infected cerebral cortex over time (Additional file 3) which is not seen in the cerebel-lum (Additional file 4). These changes are subtle and not significantly different from what is generally observed in uninfected animals. Indeed, in the cerebral cortex of in-fected animals the reductions of choline and creatine were significantly different only from the preinfection levels of the same animals.
Correlations between cortical metabolites and VL
To further examine the relationship between blood virus levels and brain pathology, we investigated the correla-tions between end-stage (16 week post infection) metab-olite concentrations and the mean blood virus level over the course of infection. Only one of the metabolites had a significant correlation with mean virus concentration, lactate (r = 0.857, p = 0.024) with a trend towards correl-ation with myoinostitol (r = -0.714, p = 0.088). While in-creasing lactate would be expected with higher viral loads, decreasing myoinostitol with higher viral loads is unexpected, as increased neuroinflammation is pre-sumed to be associated with increased myoinostitol. In order to further explore these effects, we investigated the correlations between 16 week post infection metab-olite concentrations and quantitative immunohistology in the cerebral cortex.
1
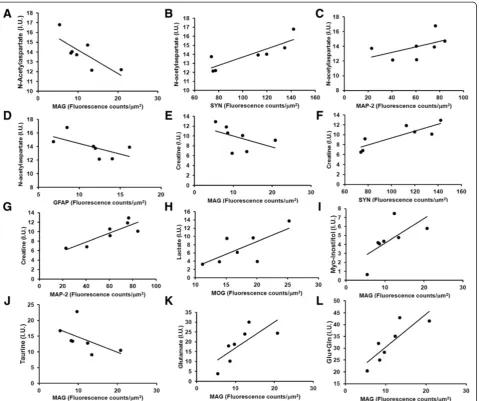
H MRS cortical metabolites and neuronal, oligodendrocyte and glial markers
glutamate (r = 0.929, p = 0.024), myoinostitol (r = 0.857, p = 0.024) as well as a trend for increased taurine (r = -0.750, p = 0.066) (Figure 6I-K). In addition, there was a trend for increased NAA (r = -0.714, p = 0.088) and creatine (r = -0.750, p = 0.066) to correlate with reduced M2c MAG (Figure 6A, E, I-L). Similar, but opposite relationships existed between SYN and NAA (r = 0.893, p = 0.012), and creatine (r = 0.857, p = 0.024) (Figure 6B, F). In addition, there was a tendency for increased GFAP levels to correlate with reduced NAA (r = -0.714, p = 0.088) (Figure 6D). Fi-nally, it was also found that levels of lactic acid showed a trend towards correlating with MOG (r = 0.750, p = 0.066) (Figure 6H). This provides an overall picture of cortical me-tabolism changes from HIV-1 infection showing that pro-cesses leading to synaptic loss are associated with loss of
NAA and creatine, neuroinflammation being associated with NAA loss, while reduced MAG are associated with increases in NAA, creatine, taurine, and reductions in glutamate and myoinostitol. Certainly, these associations cannot be over interpreted, but are generally in agreement with expected metabolic effects of inflammation, synaptic loss, and loss of oligodendrocytes-associated proteins in the cortex of these infected animals.
DTI
DTI metrics investigated include FA, Dav, longitudinal dif-fusivity (λl) and transverse diffusivity (λt) (see Materials and Methods) in brain regions. These were measured in the hippocampus [CA1, CA2, CA3 and dentate gyrus (DG)], in cortex (whisker barrels, middle cerebral cortex,
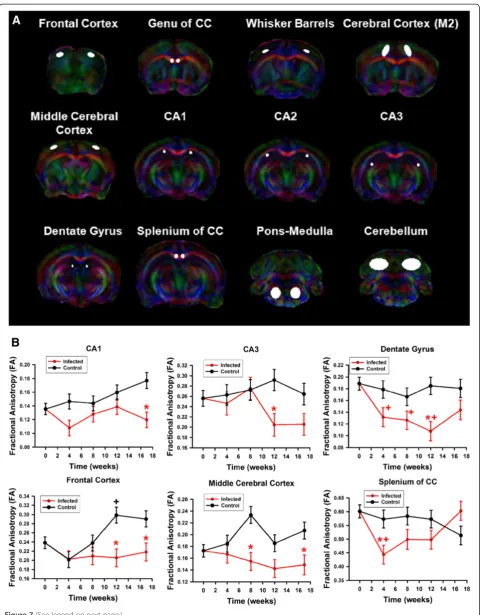
M2 cortical region, frontal cortex), and white matter regions (splenium and genu of the corpus callosum) (Figure 7A). Metrics of uninfected control and HIV-1 infected animals were compared over time. Results of individual mice and brain regions were evaluated independently with correc-tion for multiple comparisons. The most consistent and notable changes were seen as reduced FA in hippocampus and cortical regions relative to the uninfected controls (Figure 7B). Many of these differences are accompanied by increase in FA in the uninfected humanized mice that did not manifest in the infected mice. It is also notable that the cause(s) of such a reduction in FA in some regions are reversible, including the dentate gyrus and splenium of the corpus callosum, possibly indicating transient in-flammatory processes occurring in these regions during the course of infection. Other notable alterations included increased diffusivity in white matter (Additional files 5, 6 and 7).
DTI and VL
End-point values of DTI metrics were tested for correl-ation with mean viral loads in the individual infected mice (Figure 8). Correlations with virus level were weak and found only in cortical regions (M2 region of the cor-tex and whisker barrels) in multiple DTI measures, but only a trend of a single correspondence in DG and no other regions. This suggests that the cortical regions are the primary site of neuronal damage due to multifactor-ial HIV-1 induced injuries. Exactly which factors are pri-mary causes of this damage will be a matter for further exploration. Nevertheless, further details regarding spe-cific histological abnormalities and DTI metrics were then explored in the cortical regions, hippocampus, and corpus callosum.
DTI and neuronal, oligodendrocyte and glial markers
End-point values of DTI metrics were correlated with quantitative histopathology in the individual infected mice (Figure 9). Correlations were considered between the DTI metrics within spatial subregions used for histo-logical analysis which included cortical regions (M2
region of the cortex (M2c), whisker barrel regions (WB)), hippocampus regions (CA1, CA2, CA3 and the dentate gyrus (DG)), genu of the corpus callosum, cerebellum, and pons-medulla (brainstem) as delineated in Figure 7. The most significant correlations were found in the cortical re-gions, similar to virus level. It was observed that in the whisker barrel region increasing mean diffusivity and de-creasing FA correlate with inde-creasing MAG and with in-creasing Iba-1. In addition, FA reduced with NF loss. The CA2 region of the hippocampus shows correlation of in-creased diffusivity, especially the longitudinal diffusivity with decreasing SYN with a similar trend with MAP2. No significant correlations were found in the corpus callosum, brainstem, or the cerebellum.
Discussion
There are expected similarities and noted differences be-tween the neurological consequences of HIV-1 infection in humans and in this mouse model. As for the former, chronic infection in the mice leads to viral invasion of the central nervous system and ingress of monocyte-derived macrophages first into the meninges then the perivascular spaces. Behavioral abnormalities follow but more subtle in mice. They are coincident with CD4+ T cell loss and high peripheral viral loads. Notably, mouse infection leads to micro- and astro- gliosis and neuronal loss that, like in humans, are region and animal specific. Indeed, levels of infection and histopathological findings in brain vary. Such variability rests in the extent of in-flammation and neuronal damage. We have not yet ob-served a true multinucleated giant cell encephalitis in mice as is often present in humans and likely due to that primary microglia and astrocytes are rodent-in-origin and as such cannot be infected with the virus. Nonethe-less, the finding in these rodents underlies the central tenet of human disease in that few infected cells in the brain can give rise to more wide spread alterations in neural function underpinning the role of a virus-induced metabolic encephalopthy. Importantly, it is the engage-ment of the innate and adaptive immune system trig-gered by the virus that are not only operative in the
(See figure on previous page.)
Figure 7DTI metrics. (A)Brain regions analyzed for DTI metrics.(B)Fractional anisotropy (mean ± SEM) in (top) CA1, CA3, and dentate gyrus (from left to right) and (bottom) frontal cortex, middle cerebral cortex, and splenium of the corpus callosum (from left to right) as shown in
(A). (red“*”symbol) p < 0.05 control (n = 7) vs infected (n = 8) mice,+p < 0.05 versus time zero in control mice, (red“+”symbol) p < 0.05 versus pre-infection in HIV-1 infected animals.
infected reconstituted mice but the best reflection of hu-man disease [5]. While this model replicates hu-many of the features of human disease, limitations exist. These include the need for handling the animals in a P3 facility, the ex-tensive work required for humanization, and the sterilizing equipment and procedures necessary. In addition, as is known the virus infects only human cells. Thus the feature of infected microglia and astrocytes within the brain par-enchyma are not replicated. Only peripheral monocytes and macrophages and CD4+ T lymphocytes migrating across the blood-brain barrier are infected and that infec-tion is limited to the meninges and perivascular spaces [5,21]. The relatively few infected cells are a likely source for paracrine inflammatory responses that affect more wide spread neural injuries. This serves, in part, to explain the disconnection between absolute virus levels and neuropathology. Additional advantages of this humanized mouse model over more widely used transgenic mice that express viral proteins or injection of HIV-1 infected cells into brain areas affected by disease is that the current model can accurately reflect ongoing viral infections ra-ther that specific virotoxins or acutely generated cellular inflammatory factors [5,31]. The model is thus a signifi-cant step forward in studies of HIV-1 neuropathogenesis as relevant neuroAIDS models were previously only avail-able in nonhuman primates [32,33]. These were costly and
due to differences in viral dynamics did not always mimic natural progression of CNS dysfunction. Thus, we devel-oped this model as one possible solution. The new model is based on the fact that immunodeficient mice trans-planted with human hematopoietic CD34+ stem cells (HSC) (hu-NSG) at birth enable long-term engraftment of a functional human immune system and support chronic HIV-1 infection [21,22,34]. Whether this could lead to CNS consequences of persistent infections and the types of behavioral, histologic and imaging abnormalities com-mon in infected humans was not known. Our findings re-solve such an unknown, in part, by demonstrating that systemic HIV-1 infection leads to CNS damage and pro-viding opportunities to detail brain metabolic dysfunctions [35]. Interestingly, relationships between levels of viral replication and virus-associated pathology did not uni-formly occur. As ART is not always able to penetrate the blood-brain barrier permitting reservoirs for viral muta-tion; HIV infection of glia (astrocytes, microglia and blood borne macrophages) persists in humans [36-38].
We had originally thought that viral load would be the major determinant of neuronal dysfunction in the CD34-NSG mice. This proved wrong. It is the lack of correlation between virus levels and neurodegeneraation that demon-strates that, as in humans, the mechanisms of neuronal damage are complex and not simply a matter of absolute
viral load. While a clear hypothesis of what does cause neuronal damage is not possible using the present results, we find that the time course of chronic peripheral infec-tion in the mice from the neuroimaging results indicates initial inflammation, followed by neurodegeneration and subsequent oligodendrocyte degeneration. Factors influen-cing this progression likely include the pathobiologic de-tails of infected immune cells and the effects of cytokine and chemokine release on neuronal function. The ability to explore these factors will be the subject of future studies and likely will result in the ability to identify specific mech-anisms involved in HIV-1 neurocognitive dysfunction.
Developing a database of co-registered histology, DTI, and metabolic changes along with clinical indications in-cluding CD4/CD8 and virus levels, and in the future, protein, chemokine, cytokine and metabolomics, will aid in our abilities to develop non-invasive monitors of dis-ease status and understand the mechanisms of brain re-action to peripheral infection even with relatively few infected cells in brain.
Histological analyses demonstrated links between per-ipheral viral infection and cortical neuroinflammation, synaptic and neuronal loss, and damaged oligodendro-cytes. This was seen especially in the whisker barrels. Not surprisingly, NAA was reduced during chronic in-fection with neuronal damage and neuroinflammation. Also, increased NAA correlates with oligodendrocytes dysfunction at the endpoint of the 16 week time course of infection. Oligodendrocytes break down NAA to acet-ate and aspartacet-ate via the aspartoacylase enzyme. In a re-cent report oligodendrocytes have been shown to play an important role along with neurons and astrocytes to form a tri-cellular compartment [39]. Glial and neuronal cells communicate by interchange of NAA, with neur-onal NAA formation in synaptosomal mitochndria [40], oligodendrocytes breakdown of NAA to provide acetyl groups for myelin synthesis [41], and release aspartate and acetate to be taken up by neurons for resynthesis of NAA. The time course of NAA in infected animals sug-gests that inflammation and neuronal damage start early in infection, with oligodendrocyte dysfunction and loss occurring later in the time course of infection in this animal model. It was also found that creatine shows a similar correlation as neuronal damage correlates with decreased creatine and oligodendrocytes dysfunction correlates with a creatine increase. Dysfunction of oligo-dendrocytes have been seen in human HIV-1 infection as global reduction in myelination, reflected by reduced MRI magnetization transfer [42]. Creatine increase has been shown in the white matter during acute stages of accelerated simian immunodeficiency virus infection [43] and similarly increased in the frontal white matter of antiretroviral naïve HIV+ humans while decreasing in deep gray matter (basal ganglia) in relation to dementia
severity [44]. Creatine reduction has been shown in some neurodegenerative disorders using either internal water sig-nal or total metabolite concentrations as a normalization factor. Creatine reduction has been demonstrated in mild cognitive impairment [45] and in the prefrontal cortex of adults with autism spectrum disorders [46].
Correlations between DTI and histology provide clues to viral neuropathogenic mechanisms. Increased diffusivity and decreased fractional anisotropy were associated with both neuroinflammation and neuronal damage. Neuronal damage is mostly associated with increased transverse dif-fusivity, as opposed to gliosis which correlated with mean diffusivity. Conversely, loss of oligodendrocyte function is associated with decreased diffusivity and increased frac-tional anisotropy. These findings are clearly linked to MAG distribution and staining intensities in the infected animals. MAG may serve as a receptor for neuronal ligand (s) that modulate glial responses. The increase in activated microglia in the somatosensory cortex and white matter may be responsible for the NF and presynaptic reductions seen mediated through neurotoxic factors.
mouse model of chronic infection strengthens its relevance in mirroring some aspects of the human disease.
Persistent systemic viral replication affects memory and lead to anxiety, neuroinflammation and defects in neural metabolism [60-64]. The notable features of HIV neuropathogenesis include infection of the nervous sys-tem by invading leukocytes that traverse the blood-brain-barrier with blood borne perivascular macrophages and microglia infection. Glial activation, white matter pallor, neuronal injury and subsequent neuronal death occur through exposure to viral proteins and cellular neurotoxic factors [65]. These are also seen in HIV in-fected immune deficient mice [23]. Neuronal injuries may be sped by active viral replication in peripheral lymphoid tissues [66].
Conclusions
In conclusion, we provide evidence that this murine model of viral infection produces neurocognitive dysfunction as a consequence of systemic HIV-1 infection. This model will be useful for investigating mechanisms of HIV-1 neuro-pathogenesis. The combination of behavioral tests, ad-vanced neuroimaging, and histology are a powerful combination that is best used to detail some of the neuro-pathological processes caused by HIV-1 infection.
Methods
HIV infection of humanized mice
NOD/scid-IL-2Rgcnull (NSG) mice obtained from Jackson Laboratories established breeding colonies (stock number 005557) and housed under pathogen-free conditions; done in approval and in accordance with ethical guidelines for care of laboratory animals as set forth by National Insti-tute of Health and the University of Nebraska Medical Center (UNMC IACUC 06-071-02FC). Human CD34+ hematopoietic stem cells (HSC) were obtained from fetal liver (University of Washington, Laboratory of Develop-mental Biology, supported by NIH award 5R24HD000836) by magnetic bead selection (Miltenyi Biotech Inc., Au-burn, CA), and NSG mice were humanized as described previously [20]. Human immune system engraftment was determined by flow cytometry in rodent peripheral blood using antibodies to human pan-CD45, CD3, CD4, CD8, CD14 and CD19 in a six-color combination (BD Pharmin-gen, San Diego, CA). The percentages of CD4+and CD8+ T-lymphocytes were obtained from the gate set on human CD3+cells. Humanized CD34-NSG mice were infected in-traperitoneally with HIV-1ADA, a CCR5 utilizing virus at a dosage of 104 tissue culture infective dose 50 (TCID50)/ mouse at 22 weeks of age. The levels of viral replication were monitored and analyzed from plasma at defined time points by an automated COBAS Amplicor System V1.5 (Roche Molecular Diagnostics) and expressed as copies of viral RNA per ml sample (Viral load, VL) as previously
described [22]. HIV-1ADA used for infection was propa-gated in monocyte-derived macrophages [67].
Real-time RT PCR
Total RNA from cortex was extracted using TRIzol (Invitrogen, Carlsbad, CA) method. Recovered RNAs were reverse transcribed to cDNA with random hexamers (Invitrogen). Real-time quantitative PCR was performed using an ABI PRISM 7000 sequence detector (Applied Biosystems, Foster City, CA). Human CD45, and mouse GAPDH expressions were analyzed using TaqMan gene expression assays. For HIV-1 gag the primers and probe
used were: forward, 5′-ACATCAAGCAGCCATGCAA
AT-3′; and reverse, 5′
-ATCTGGCCTGGTGCAATAGG-3′ and probe (FAM), 5′-CATCAATGAGGAAGCT GC
AGAATGGGATAGA-3′(TAMRA). Viral copies were cal-culated from the standard curve using DNA from the 8E5 cell line (NIH AIDS reference reagent program).
Behavioral testing
the periphery is automatically measured to assess anx-iety behavior.
Neuroimaging
All neuroimaging studies were performed using a 7 Tesla/ 16 cm Bruker Pharmascan or a 7 Tesla 21 cm Bruker Biospec (Karlsure, Germany) MRI/MRS system. Prior to all scans, mice were anesthetized by inhalation of 1-2% isoflur-ane in a nitrous oxide/oxygen mixture. The animals were subsequently placed into a custom animal holder equipped with a receive only surface coil. Data were acquired using volume transmit and surface coil receive. Respiratory moni-toring, gating of the MRI system, and temperature monitor-ing were done usmonitor-ing an SA instruments model 1025 MRI compatible physiological monitoring system (Model 1025, SA Instruments, Stony Brook, NY).
1
H MRS acquisitions
Single voxel localized spectra were acquired in the cere-bral cortex (Figure 4A) and cerebellum (Figure 4C) using point resolved spectroscopy (PRESS) with outer volume suppression and high bandwidth pulses to optimize se-quence performance. Spectra were acquired with a repeti-tion time of 4 seconds, echo time of 50 ms, 320 averages.
Spectroscopic analyses
Spectroscopic data were processed by removal of residual water signal using the HLVSD filter. Spectra from 1H MRS data sets were curve fit in the time domain using the QUEST algorithm [68,69] in jMRUI version 4.0 (http:// www.mrui.uab.es/mrui), which fits results to a sum of in-dividual metabolite spectra (basis set, Figure 10A) to de-termine metabolite concentrations (Figure 10B) [22]. Results were expressed as a percentage of the sum of all 14 metabolites (alanine, aspartic acid, creatine, gamma-aminobutyric acid, glutamine, glucose, glutamate, glycine,
glycerophosphocholine, lactic acid, myoinostitiol, NAA, phosphocholine and taurine) as a semi-quantitative method for reporting metabolite concentrations in institutional units (I.U.). Glycerophosphocholine and phosphocholine were added and reported as total choline containing compounds.
DTI
DTI data were obtained using an actively decoupled 72 mm volume coil transmitter and a laboratory built 1.25 × 1.5 cm surface coil receiver. Reference coronal mouse brain images were obtained using 3D FLASH with acquisition parameters of 24 × 24 × 16 mm field-of-view (FOV), a 128 × 128 × 32 matrix, 35° flip angle, 50 ms repe-tition time (TR), 3 ms echo time (TE), and two averages for a total acquisition time of 7.5 min. DTI data were ac-quired using single-shot diffusion-weighted spin-echo echo-planar imaging (TE = 43 ms). Respiratory gating was used to prevent motion artifacts. Acquisition was repeated at TR = 10–15 s depending on respiratory rate and one shot per breath. EPI acquisition parameters included: 14 slices, 200 kHz bandwidth, 96 × 96 in-plane acquisition zero-filled to 256 × 256, and a 0.5-mm slice thickness. The diffusion encoding used was a balanced, rotationally in-variant and alternating polarity icosahedral scheme (12 di-rections) as detailed in our previous work [70].
Analyses of the diffusion-weighted data were performed using custom programs written in IDL as previously described [71-73]. Analyses produced maps of the tensor diffusivities (λ1,λ2,λ3), mean diffusivity (Dav) where:Dav= 1/3*(λ1+λ2+λ3) and fractional anisotropy (FA), where:
FA¼p1ffiffi2
ffiffiffiffiffiffiffiffiffiffiffiffiffiffiffiffiffiffiffiffiffiffiffiffiffiffiffiffiffiffiffiffiffiffiffiffiffiffiffiffiffiffi λ1−λ2
ð Þ2þλ 2−λ3 ð Þ2þλ
1−λ3 ð Þ2 λ2
1þλ22þλ23 r
. Transverse (λ⊥= (λ2+
λ3)/2) and longitudinal (λ||=λ1) components of the diffu-sion tensor were obtained as previously described [74].
Figure 101H MR spectrum and fit. A: Basis set showing the spectra used to deconvolute the individual components in the in-vivo localized
Histopathology
For immunocytochemical analyses mouse tissues were post-fixed for 24 hours in 4% paraformaldehyde (PFA) and embedded in paraffin. Brain sections were selected from the corresponding regions analyzed by DTI. Five micron paraffin embedded brain sections were stained with mouse monoclonal antibodies to 200 and 68 kDa neurofilaments (NF) (clone 2 F11; 1:200; Dako), synapto-physin (SYN) (clone SY38; 1:1000; EMD Millipore, Temecula, CA), myelin oligodendrocyte glycoprotein [(MOG (D-10): sc-166172; 1:500; Santacruz Biotech, Inc.] and myelin associated glycoprotein [MAG (G-11): sc-166780; 1:500; Santacruz Biotech]. Rabbit polyclonal antibodies were applied to glial fibrillary acidic protein (GFAP, 1:1000; Dako), microtubule-associated protein 2 (MAP2, 1:500; EMD Millipore) and ionized calcium binding adaptor molecule 1 (Iba1; 1:500; Wako chemi-cals). The signals were captured with secondary anti-mouse and rabbit antibodies conjugated to fluorescent probes Alexa Fluor 488 and Alexa Fluor 594 (1:200; Invitrogen). Nuclei were labeled with 4′, 6-diaminido-2-phenylindole (DAPI). Slides were then cover-slipped with ProLong Gold anti-fade reagent mounting media (Invitrogen, Carlsbad, CA). Images were captured at wavelengths (20 nm intervals between 420 nm to 720 nm) encompass-ing the emission spectra of the probes usencompass-ing separate fluorescent filter blocks (DAPI, FITC HYQ, Texas Red HYQ; Nikon Instruments, Inc.), with 20× and 40× objec-tives. The fluorescence emission of each probe and auto-fluorescence of the tissue samples were analyzed by the multispectral imaging/image analysis using a Nuance EX camera [22] fixed to a Nikon Eclipse E800 using Nuance software (Cambridge Research and Instrumentation, Wo-burn, MA). Two to four images per region were obtained for each protein from two to four brain sections/mouse. Results were averaged from each individual area for each antigen to represent density and used as a single result per mouse for statistical analysis. The design for statistical analysis consisted of one between subject factor consid-ered as a fixed effect and evaluated with a random effects ANOVA model to account for the anticipated correlated data due to multiple observations from each animal. Dif-ferences between infected and uninfected brain staining are illustrated in Figure 4B. The quantitation data were expressed as average ± SEM of signal counts relative fluor-escence units/μm2.
Statistical analyses
Statistical analyses were performed in SAS 9.4 (SAS Insti-tute, Inc, Cary, N.C.). The design consisted of one between factor (infected/control) and one within factor (time, con-sisting of 5 measurement collected over 4-week intervals). The data were evaluated with a repeated measures ANOVA model that applied an autoregressive covariance
structure to account for the correlated nature of the data. Time and treatment were entered as fixed effects and their main effects and interactions were evaluated. Average DTI measures for the infected versus the uninfected control group were compared at each of the five time points (0, 4, 8, 12, 16 weeks). Within each group, the measurements at times 4, 8, 12, and 16 were compared to week 0. To ac-count for multiple comparisons among the group means, adjustments to the p-values and confidence intervals for the differences were computed with simulation tech-niques, the recommended method for adjustments due to multiplicity for the repeated measures ANOVA model [75]. The means with confidence intervals were then depicted with graphs, which indicate whether a signifi-cance difference exists between the two group means at each time point (*) and the difference of the means for week with the pre-infection time for each group (^). Histological results provided with up to eight response variables in each section. The design consists of one be-tween subject factors (HIV infected compared to unin-fected controls), treated as a fixed effect. Data existing in a section for the response variables contained from 2 to 4 measurements collected from each subject. The data were evaluated with a random effects ANOVA model to ac-count for the correlation within each mouse. Correlations were performed using Spearman correlations with exact p-values to account for small numbers of samples. All stat-istical significance tests were two-sided. All statstat-istical ana-lyses were generated with PROC MIXED and PROC FREQ from SAS/STAT. Behavioral data obtained from OFA were analyzed using SAS/STAT and statistical signifi-cance was calculated using post-hoc t-test. Graphs were produced with Microsoft Excel software. A p less than 0.05 was considered significant.
Additional files
Additional file 1: Figure S1.Identification of HIV-1 infected human cells in spleen and brain. A. Five micron thick paraffin-embedded tissue sections were double florescent stained for human CD14 (macrophages) and HIV-1p24 (viral core protein, top panels) or human CD4 (T lymphocytes) and HIV-1p24 on the bottom panels. Merged pictures show HIV-1 infected (pictured in yellow) human CD14 or CD4 positive cells, original magnification 400×. B. Sections of brain tissues were peroxidase-stained for HLA-DR (human immunocytes) in meninges, brain parenchyma and perivascular spaces. HIV-1p24 cells are pictured on corresponding adjacent sections. Top insets show a magnified view of identified cells (see arrows). Top panel shows a HIV-1p24 cell simultaneously stained for human CD163 (macrophages). C. Sections showing perivascular human CD163 positive macrophages. B and C are at original magnification 200× and insets at 1000×.
Additional file 3: Figure S3.Cerebral Cortex Metabolite Levels (Means ± SEM) expressed as a percentage of total signal contribution from1H MRS
scans of (red) HIV-1 infected humanized mice (n = 7) and (black) uninfected humanized mice (n = 7) over time. Time zero in infected mice is preinfection with subsequent spectra acquired every four weeks up to 16 weeks in both infected and uninfected mice. *p < 0.05 control vs infected mice, ^p < 0.05 vs time zero in control mice, (red“^”symbol) p < 0.05 vs preinfection in infected mice.
Additional file 4: Figure S4.Cerebellum Metabolite Levels (Means ± SEM) expressed as a percentage of total signal contribution from1H MRS
scans of (red) HIV-1 infected humanized mice (n = 7) and (black) uninfected humanized mice (n = 7) over time. Time zero, in infected mice is preinfection with subsequent spectra acquired every four weeks up to 16 weeks in both infected and uninfected mice. *p < 0.05 control vs infected mice, ^p < 0.05 vs time zero in control mice, (red“^”symbol) p < 0.05 vs preinfection in infected mice.
Additional file 5: Figure S5.Comparison of DTI metrics (mean ± SEM) in CA1, CA2, CA3, and Dentate Gyrus (from left to right) as shown in Figure 7 in uninfected (black, n = 7) and HIV-1 infected (red, n = 8) humanized mice. Shown are (from top to bottom) Mean diffusivity (Dav),
Fractional anisotropy (FA), transverse component of diffusivity ((λt), and
longitudinal component of diffusivity ((λl). (red“*”symbol) p < 0.05
control vs infected mice,tp < 0.05 vs time zero in control mice,
(red“^”symbol) p < 0.05 vs preinfection in infected mice.
Additional file 6: Figure S6.Comparison of DTI metrics (mean ± SEM) in frontal cortex, middle cerebral cortex, M2 region of cerebral cortex, and whisker barrels (from left to right) as shown in Figure 7 in uninfected (black, n = 7) and HIV-1 infected (red, n = 8) humanized mice. Shown are (from top to bottom) Mean diffusivity (Dav), Fractional anisotropy (FA),
transverse component of diffusivity (λt), and longitudinal component of
diffusivity (λl). (red“*”symbol) p < 0.05 control vs infected mice,tp < 0.05
vs time zero in control mice, (red“t”symbol) p < 0.05 vs preinfection in infected mice.
Additional file 7: Figure S7.Comparison of DTI metrics over time (mean ± SEM) from left to right in the Genu of the Corpus Callosum (CC) and the Splenium of the CC, as shown in Figure 7. Results are shown from uninfected (black, n = 7) and HIV-1 infected (red, n = 8) humanized mice. Shown are (from top to bottom) Mean diffusivity (Dav), Fractional
anisotropy (FA), transverse component of diffusivity (λt), and longitudinal
component of diffusivity ((λl). (red“*”symbol) p < 0.05 control vs infected
mice,tp < 0.05 vs time zero in control mice, (red“t”symbol) p < 0.05 vs
preinfection in infected mice.
Abbreviations
ART:Antiretroviral therapy; CNS: Central nervous system; cART: Combination antiretroviral therapy; DTI: Diffusion tensor magnetic resonance imaging; FACS: Fluorescence-activated cell sorting; FA: Fractional anisotropy; GABA: Gamma-amino butyric acid; GFAP: Glial fibrillary acidic protein; HAND: HIV-associated neurocognitive disorders; Iba-1: Ionized calcium binding adaptor molecule 1;λl: Longitudinal Diffusivity; M2c: M2 region of the cerebral
cortex; Dav: Mean diffusivity; MAP2: Microtubule-associated protein 2;
MAG: Myelin associated glycoprotein; MOG: Myelin oligodendrocyte glycoprotein; NAA: N-acetyl aspartate; NF: Neurofilament protein; NSG: NOD/ scid-IL-2Rgcnull; OFA: Open field activity;1H MRS: Proton magnetic resonance
spectroscopy; SYN: Synaptophysin; TCID50: Tissue culture infective dose
50;λt: Transverse diffusivity; VL: Viral load.
Competing interests
The authors declare that they have no competing interests.
Authors’contributions
MDB was responsible for the neuroimaging studies, provided all experimental design advice for each of the sections with HEG and participated directly in manuscript preparation and editing. PKD participated in the animal infections, blood sampling, virology, immunology and histology tested. He participated in behavioral testing and supported the manuscript preparation and editing. JK participated in histology and blood work analyses for the animals. AAE was involved in the neuroimaging and behavioral testing of animals. SPA was involved in histology and blood work for the animals. NF participated in
histologic and immune testing of the animals. RH was responsible for design and performance of statistical analyses, EM participated in the histology, viral and immune studies for the animals. SB participated in the design and interpretation of behavioral tests and manuscript preparation, HAG was involved in experimental design and manuscript preparation and editing, LYP participated in experimental design, interpretation, and manuscript preparation, HEG designed the overall experimental schemes with MDB and participated in each part of the experimental design, interpretation, and manuscript preparation and editing, and SG was involve in mouse model preparation, experimental design and manuscript preparation and editing. All authors read and approved the final manuscript.
Acknowledgements
The MRUI software package was kindly provided by the participants of the EU Network programmes: Human Capital and Mobility, CHRX-CT94-0432 and Training and Mobility of Researchers, ERB-FMRX-CT970160. This work was supported by the University of Nebraska Foundation which includes individual donations from Dr. Carol Swarts and Frances and Louie Blumkin, the Vice Chancellor’s office of the University of Nebraska Medical Center, ViiV Healthcare and National Institutes of Health grants P01 MH64570, RO1 MH104147, P01 DA028555, R01 NS36126, P01 NS31492, 2R01 NS034239, P01 NS43985, P30 MH062261, R01 AG043540 and a grant from the Nebraska Research Initiative.
Author details
1Department of Radiology, University of Nebraska Medical Center, Omaha,
NE 68198, USA.2Department of Pharmacology and Experimental
Neuroscience, University of Nebraska Medical Center, Omaha, NE 68198, USA.
3College of Public Health, University of Nebraska Medical Center, Omaha, NE
68198, USA.4Department of Internal Medicine, University of Nebraska
Medical Center, Omaha, NE 68198, USA.5Department of Neurology, Center
for Neural Development and Disease, University of Rochester Medical Center, Rochester, NY 14642, USA.
Received: 26 August 2014 Accepted: 7 December 2014 Published: 18 December 2014
References
1. Kraft-Terry SD, Stothert AR, Buch S, Gendelman HE:HIV-1 neuroimmunity in the era of antiretroviral therapy.Neurobiol Dis2010,37:542–548. 2. Robertson K, Liner J, Heaton R:Neuropsychological assessment of
HIV-infected populations in international settings.Neuropsychol Rev2009,
19:232–249.
3. Heaton RK, Franklin DR, Ellis RJ, McCutchan JA, Letendre SL, Leblanc S, Corkran SH, Duarte NA, Clifford DB, Woods SP, Collier AC, Marra CM, Morgello S, Mindt MR, Taylor MJ, Marcotte TD, Atkinson JH, Wolfson T, Gelman BB, McArthur JC, Simpson DM, Abramson I, Gamst A, Fennema-Notestine C, Jernigan TL, Wong J, Grant I, CHARTER Group, HNRC Group:
HIV-associated neurocognitive disorders before and during the era of combination antiretroviral therapy: differences in rates, nature, and predictors.J Neurovirol2011,17:3–16.
4. Pozniak A, Rackstraw S, Deayton J, Barber T, Taylor S, Manji H, Melvin D, Croston M, Nightingale S, Kulasegaram R, Pitkanen M, Winston A:
HIV-associated neurocognitive disease: case studies and suggestions for diagnosis and management in different patient sub-groups.Antivir Ther 2014,19(1):1–13.
5. Gorantla S, Poluektova L, Gendelman HE:Rodent models for HIV-associated neurocognitive disorders.Trends Neurosci2012,35:197–208. 6. Jaeger LB, Nath A:Modeling HIV-associated neurocognitive disorders in
mice: new approaches in the changing face of HIV neuropathogenesis.
Dis Model Mech2012,5:313–322.
7. Koppensteiner H, Brack-Werner R, Schindler M:Macrophages and their relevance in Human Immunodeficiency Virus Type I infection.
Retrovirology2012,9:82.
8. Palmer S, Josefsson L, Coffin JM:HIV reservoirs and the possibility of a cure for HIV infection.J Intern Med2011,270:550–560.
9. Gelbard HA, Gendelman HE:Lipids and cognition make good bedfellows for neuroAIDS.Neurology2013,81(17):1480–1481.
10. Gannon P, Khan MZ, Kolson DL:Current understanding of HIV-associated neurocognitive disorders pathogenesis.Curr Opin Neurol2011,
11. del Palacio M, Alvarez S, Munoz-Fernandez MA:HIV-1 infection and neurocognitive impairment in the current era.Rev Med Virol2012,
22:33–45.
12. Yilmaz A, Price RW, Gisslen M:Antiretroviral drug treatment of CNS HIV-1 infection.J Antimicrob Chemother2012,67:299–311.
13. Kahouadji Y, Dumurgier J, Sellier P, Lapalus P, Delcey V, Bergmann J, Hugon J, Paquet C:Cognitive function after several years of antiretroviral therapy with stable central nervous system penetration score.HIV Med 2013,14:311–315.
14. McCombe JA, Vivithanaporn P, Gill MJ, Power C:Predictors of symptomatic HIV-associated neurocognitive disorders in universal health care.HIV Med 2013,14:99–107.
15. Smurzynski M, Wu K, Letendre S, Robertson K, Bosch RJ, Clifford DB, Evans S, Collier AC, Taylor M, Ellis R:Effects of central nervous system antiretroviral penetration on cognitive functioning in the ALLRT cohort.Aids2011,
25:357–365.
16. Airoldi M, Bandera A, Trabattoni D, Tagliabue B, Arosio B, Soria A, Rainone V, Lapadula G, Annoni G, Clerici M, Gori A:Neurocognitive impairment in HIV-infected naive patients with advanced disease: the role of virus and intrathecal immune activation.Clin Dev Immunol2012,2012:467154. 17. Alfahad TB, Nath A:Update on HIV-associated neurocognitive disorders.
Curr Neurol Neurosci Rep2013,13:387.
18. Clark US, Cohen RA:Brain dysfunction in the era of combination antiretroviral therapy: implications for the treatment of the aging population of HIV-infected individuals.Curr Opin Investig Drugs2010,
11:884–900.
19. Spudich SS, Ances BM:Neurologic complications of HIV infection: highlights from the 2013 conference on retroviruses and opportunistic infections.Topics in antiviral Med2013,21:100–108.
20. Gorantla S, Makarov E, Finke-Dwyer J, Gebhart CL, Domm W, Dewhurst S, Gendelman HE, Poluektova LY:CD8+ cell depletion accelerates HIV-1 immunopathology in humanized mice.J Immunol2010,184:7082–7091. 21. Gorantla S, Makarov E, Finke-Dwyer J, Castanedo A, Holguin A, Gebhart CL,
Gendelman HE, Poluektova L:Links between progressive HIV-1 infection of humanized mice and viral neuropathogenesis.Am J Pathol2010,
177:2938–2949.
22. Dash PK, Gorantla S, Gendelman HE, Knibbe J, Casale GP, Makarov E, Epstein AA, Gelbard HA, Boska MD, Poluektova LY:Loss of neuronal integrity during progressive HIV-1 infection of humanized mice.
J Neurosci2011,31:3148–3157.
23. Dash PK, Gendelman HE, Roy U, Balkundi S, Alnouti Y, Mosley RL, Gelbard HA, McMillan J, Gorantla S, Poluektova LY:Long-acting nanoformulated antiretroviral therapy elicits potent antiretroviral and neuroprotective responses in HIV-1-infected humanized mice.Aids2012,26:2135–2144. 24. Sun B, Abadjian L, Rempel H, Calosing C, Rothlind J, Pulliam L:Peripheral
biomarkers do not correlate with cognitive impairment in highly active antiretroviral therapy-treated subjects with human immunodeficiency virus type 1 infection.J Neurovirol2010,16:115–124.
25. Norman LR, Basso M, Kumar A, Malow R:Neuropsychological consequences of HIV and substance abuse: a literature review and implications for treatment and future research.Curr Drug Abuse Rev2009,2:143–156. 26. Stanford SC:The open field test: reinventing the wheel.
J Psychopharmacol2007,21:134–135.
27. Bolivar VJ, Caldarone BJ, Reilly AA, Flaherty L:Habituation of activity in an open field: a survey of inbred strains and F1 hybrids.Behav Genet2000,
30:285–293.
28. Prut L, Belzung C:The open field as a paradigm to measure the effects of drugs on anxiety-like behaviors: a review.Eur J Pharmacol2003,463:3–33. 29. Willi R, Winter C, Wieske F, Kempf A, Yee BK, Schwab ME, Singer P:Loss of
EphA4 impairs short-term spatial recognition memory performance and locomotor habituation.Genes Brain Behav2012,11(8):1020–1031. 30. Lamprea MR, Cardenas FP, Setem J, Morato S:Thigmotactic responses in
an open-field.Braz J Med Biol Res2008,41:135–140.
31. Fox HS, Gendelman HE:Commentary: animal models of neuroAIDS.
J Neuroimmune Pharmacol2012,7:301–305.
32. Weed MR, Steward DJ:Neuropsychopathology in the SIV/macaque model of AIDS.Front Biosci2005,10:710–727.
33. Gold LH, Fox HS, Henriksen SJ, Buchmeier MJ, Weed MR, Taffe MA, Huitron-Resendiz S, Horn TF, Bloom FE:Longitudinal analysis of behavioral, neurophysiological, viral and immunological effects of SIV infection in rhesus monkeys.J Med Primatol1998,27:104–112.
34. Gorantla S, Sneller H, Walters L, Sharp JG, Pirruccello SJ, West JT, Wood C, Dewhurst S, Gendelman HE, Poluektova L:Human immunodeficiency virus type 1 pathobiology studied in humanized BALB/c-Rag2-/-gammac-/- mice.
J Virol2007,81:2700–2712.
35. Epstein AA, Narayanasamy P, Dash PK, High R, Bathena SP, Gorantla S, Poluektova LY, Alnouti Y, Gendelman HE, Boska MD:Combinatorial assessments of brain tissue metabolomics and histopathology in rodent models of human immunodeficiency virus infection.J Neuroimmune Pharmacol2013,8(5):1224–1238.
36. Koopmans PP, Ellis R, Best BM, Letendre S:Should antiretroviral therapy for HIV infection be tailored for intracerebral penetration?Neth J Med2009,
67:206–211.
37. Kranick SM, Nath A:Neurologic complications of HIV-1 infection and its treatment in the era of antiretroviral therapy.Continuum2012,18:1319–1337. 38. Price RW, Swanstrom R:Targeting chronic central nervous system HIV
infection.Antivir Ther2012,17:1227–1231.
39. Amaral AI, Meisingset TW, Kotter MR, Sonnewald U:Metabolic aspects of neuron-oligodendrocyte-astrocyte interactions.Front Endocrinol2013,
4:54.
40. Madhavarao CN, Chinopoulos C, Chandrasekaran K, Namboodiri MA:
Characterization of the N-acetylaspartate biosynthetic enzyme from rat brain.J Neurochem2003,86:824–835.
41. Chakraborty G, Mekala P, Yahya D, Wu G, Ledeen RW:Intraneuronal N-acetylaspartate supplies acetyl groups for myelin lipid synthesis: evidence for myelin-associated aspartoacylase.J Neurochem2001,
78:736–745.
42. Dousset V, Armand JP, Lacoste D, Mieze S, Letenneur L, Dartigues JF, Caill JM:Magnetization transfer study of HIV encephalitis and progressive multifocal leukoencephalopathy. Groupe d’Epidemiologie Clinique du SIDA en Aquitaine.AJNR Am J Neuroradiol1997,18:895–901. 43. Ratai EM, Pilkenton SJ, Greco JB, Lentz MR, Bombardier JP, Turk KW, He J,
Joo CG, Lee V, Westmoreland S, Halpern E, Lackner AA, González RG:In vivo proton magnetic resonance spectroscopy reveals region specific metabolic responses to SIV infection in the macaque brain.BMC Neurosci 2009,10:63.
44. Chang L, Ernst T, Witt MD, Ames N, Gaiefsky M, Miller E:Relationships among brain metabolites, cognitive function, and viral loads in antiretroviral-naive HIV patients.Neuroimage2002,17:1638–1648. 45. Tumati S, Martens S, Aleman A:Magnetic resonance spectroscopy in mild
cognitive impairment: systematic review and meta-analysis.Neurosci Biobehav Rev2013,37:2571–2586.
46. Horder J, Lavender T, Mendez MA, O’Gorman R, Daly E, Craig MC, Lythgoe DJ, Barker GJ, Murphy DG:Reduced subcortical glutamate/glutamine in adults with autism spectrum disorders: a [(1)H]MRS study.Transl Psychiatry2013,
3:e279.
47. Barber TJ, Bradshaw D, Hughes D, Leonidou L, Margetts A, Ratcliffe D, Thornton S, Pozniak A, Asboe D, Mandalia S, Boffito M, Davies N, Gazzard B, Catalan J:Screening for HIV-related neurocognitive impairment in clinical practice: challenges and opportunities.AIDS Care2014,26(2):160–168. 48. Zipursky AR, Gogolishvili D, Rueda S, Brunetta J, Carvalhal A, McCombe JA,
Gill MJ, Rachlis A, Rosenes R, Arbess G, Marcotte T, Rourke SB:Evaluation of brief screening tools for neurocognitive impairment in HIV/AIDS: a systematic review of the literature.Aids2013,27(15):2385–2401. 49. Zink WE, Anderson E, Boyle J, Hock L, Rodriguez-Sierra J, Xiong H, Gendelman
HE, Persidsky Y:Impaired spatial cognition and synaptic potentiation in a murine model of human immunodeficiency virus type 1 encephalitis.
J Neurosci2002,22:2096–2105.
50. Avgeropoulos N, Kelley B, Middaugh L, Arrigo S, Persidsky Y, Gendelman HE, Tyor WR:SCID mice with HIV encephalitis develop behavioral
abnormalities.J Acquir Immune Defic Syndr Hum Retrovirol1998,18:13–20. 51. Hahn YK, Podhaizer EM, Farris SP, Miles MF, Hauser KF, Knapp PE:Effects of
chronic HIV-1 Tat exposure in the CNS: heightened vulnerability of males versus females to changes in cell numbers, synaptic integrity, and be-havior.Brain Struct Funct2013, in press.
52. D’Hooge R, Franck F, Mucke L, De Deyn PP:Age-related behavioural deficits in transgenic mice expressing the HIV-1 coat protein gp120.
Eur J Neurosci1999,11:4398–4402.
53. Paris JJ, Singh HD, Ganno ML, Jackson P, McLaughlin JP:Anxiety-like behavior of mice produced by conditional central expression of the HIV-1 regulatory protein, Tat.Psychopharmacology (Berl)2014,
54. Carey AN, Sypek EI, Singh HD, Kaufman MJ, McLaughlin JP:Expression of HIV-Tat protein is associated with learning and memory deficits in the mouse.Behav Brain Res2012,229:48–56.
55. Avgeropoulos NG, Burris GW, Ohlandt GW, Wesselingh SL, Markham RB, Tyor WR:
Potential relationships between the presence of HIV, macrophages, and astrogliosis in SCID mice with HIV encephalitis.J NeuroAIDS1998,2:1–20. 56. Robertson K, Jiang H, Kumwenda J, Supparatpinyo K, Evans S, Campbell TB,
Price R, Tripathy S, Kumarasamy N, La Rosa A, Santos B, 5199 Study Team, Silva MT, Montano S, Kanyama C, Faesen S, Murphy R, Hall C, Marra CM, Marcus C, Berzins B, Allen R, Housseinipour M, Amod F, Sanne I, Hakim J, Walawander A, Nair A, AIDS Clinical Trials Group:Improved neuropsychological and neurological functioning across three antiretroviral regimens in diverse resource-limited settings: AIDS Clinical Trials Group study a5199, the International Neurological Study.Clin Infect Dis2012,55:868–876. 57. Al-Khindi T, Zakzanis KK, van Gorp WG:Does antiretroviral therapy
improve HIV-associated cognitive impairment? A quantitative review of the literature.J Int Neuropsychol Soc2011,17:956–969.
58. Crusio WE:Genetic dissection of mouse exploratory behaviour.Behav Brain Res2001,125:127–132.
59. Jost CR, Van Der Zee CE, In‘t Zandt HJ, Oerlemans F, Verheij M, Streijger F, Fransen J, Heerschap A, Cools AR, Wieringa B:Creatine kinase B-driven energy transfer in the brain is important for habituation and spatial learning behaviour, mossy fibre field size and determination of seizure susceptibility.Eur J Neurosci2002,15:1692–1706.
60. Johnson RT, McArthur JC, Narayan O:The neurobiology of human immunodeficiency virus infections.FASEB J1988,2:2970–2981. 61. Ances BM, Ellis RJ:Dementia and neurocognitive disorders due to HIV-1
infection.Semin Neurol2007,27:86–92.
62. Anderson E, Zink W, Xiong H, Gendelman HE:HIV-1-associated dementia: a metabolic encephalopathy perpetrated by virus-infected and immune-competent mononuclear phagocytes.J Acquir Immune Defic Syndr2002,31(Suppl 2):S43–S54.
63. Valcour V, Sithinamsuwan P, Letendre S, Ances B:Pathogenesis of HIV in the central nervous system.Curr HIV/AIDS Rep2011,8:54–61. 64. Kraft-Terry SD, Buch SJ, Fox HS, Gendelman HE:A coat of many colors:
neuroimmune crosstalk in human immunodeficiency virus infection.
Neuron2009,64:133–145.
65. Spudich S, Gonzalez-Scarano F:HIV-1-related central nervous system disease: current issues in pathogenesis, diagnosis, and treatment.Cold Spring Harb Perspect Med2012,2:a007120.
66. Burdo TH, Lackner A, Williams KC:Monocyte/macrophages and their role in HIV neuropathogenesis.Immunol Rev2013,254:102–113.
67. Gendelman HE, Orenstein JM, Martin MA, Ferrua C, Mitra R, Phipps T, Wahl LA, Lane HC, Fauci AS, Burke DS, Skillman D, Meltzer MS:Efficient isolation and propagation of human immunodeficiency virus on recombinant colony-stimulating factor 1-treated monocytes.J Exp Med 1988,167:1428–1441.
68. Ratiney H, Coenradie Y, Cavassila S, van Ormondt D, Graveron-Demilly D:
Time-domain quantitation of 1H short echo-time signals: background accommodation.MAGMA2004,16:284–296.
69. Ratiney H, Sdika M, Coenradie Y, Cavassila S, van Ormondt D, Graveron-Demilly D:Time-domain semi-parametric estimation based on a metabolite basis set.NMR Biomed2005,18:1–13.
70. Boska MD, Hasan KM, Kibuule D, Banerjee R, McIntyre E, Nelson JA, Hahn T, Gendelman HE, Mosley RL:Quantitative diffusion tensor imaging detects dopaminergic neuronal degeneration in a murine model of Parkinson’s disease.Neurobiol Dis2007,26:590–596.
71. Basser PJ, Mattiello J, LeBihan D:Estimation of the effective self-diffusion tensor from the NMR spin echo.J Magn Reson B1994,103:247–254. 72. Basser PJ, Mattiello J, LeBihan D:MR diffusion tensor spectroscopy and
imaging.Biophys J1994,66:259–267.
73. Hasan KM, Basser PJ, Parker DL, Alexander AL:Analytical computation of the eigenvalues and eigenvectors in DT-MRI.J Magn Reson2001,152:41–47.
74. Hasan KM:Diffusion tensor eigenvalues or both mean diffusivity and fractional anisotropy are required in quantitative clinical diffusion tensor MR reports: fractional anisotropy alone is not sufficient.Radiology2006,
239:611–612. author reply 612-613.
75. Westfall PH, Manage A:How well do multiple testing methods scale up when both n and k increase?J Biopharm Stat2011,21:583–594.
doi:10.1186/1750-1326-9-58
Cite this article as:Boskaet al.:Associations between brain
microstructures, metabolites, and cognitive deficits during chronic HIV-1 infection of humanized mice.Molecular Neurodegeneration20149:58.
Submit your next manuscript to BioMed Central and take full advantage of:
• Convenient online submission
• Thorough peer review
• No space constraints or color figure charges
• Immediate publication on acceptance
• Inclusion in PubMed, CAS, Scopus and Google Scholar
• Research which is freely available for redistribution