www.the-cryosphere.net/5/821/2011/ doi:10.5194/tc-5-821-2011
© Author(s) 2011. CC Attribution 3.0 License.
The Cryosphere
Recent wind driven high sea ice area export in the Fram Strait
contributes to Arctic sea ice decline
L. H. Smedsrud1,2, A. Sirevaag3,2, K. Kloster4, A. Sorteberg3,2, and S. Sandven4
1Uni Research, Bergen, Norway
2Bjerknes Center for Climate Research, Bergen, Norway 3Geophysical Institute, Univ. of Bergen, Norway
4Nansen Environmental and Remote Sensing Centre, Bergen, Norway
Received: 5 April 2011 – Published in The Cryosphere Discuss.: 5 May 2011
Revised: 26 September 2011 – Accepted: 3 October 2011 – Published: 14 October 2011
Abstract. Arctic sea ice area has been decreasing for the past two decades. Apart from melting, the southward drift through Fram Strait is the main ice loss mechanism. We present high resolution sea ice drift data across 79◦N
from 2004 to 2010. Ice drift has been derived from radar satellite data and corresponds well with variability in lo-cal geostrophic wind. The underlying East Greenland cur-rent contributes with a constant southward speed close to 5 cm s−1, and drives around a third of the ice export. We use geostrophic winds derived from reanalysis data to calculate the Fram Strait ice area export back to 1957, finding that the sea ice area export recently is about 25 % larger than during the 1960’s. The increase in ice export occurred mostly during winter and is directly connected to higher southward ice drift velocities, due to stronger geostrophic winds. The increase in ice drift is large enough to counteract a decrease in ice concentration of the exported sea ice. Using storm tracking we link changes in geostrophic winds to more intense Nordic Sea low pressure systems. Annual sea ice area export likely has a significant influence on the summer sea ice variabil-ity and we find low values in the 1960’s, the late 1980’s and 1990’s, and particularly high values during 2005–2008. The study highlights the possible role of variability in ice export as an explanatory factor for understanding the dramatic loss of Arctic sea ice during the last decades.
1 Introduction
Arctic sea ice area has decreased since the 1990’s (Gloersen and Campbell, 1991). Regardless of the definition of the summer minimum sea ice area (average sea ice extent for
Correspondence to: L. H. Smedsrud
September, minimum of daily sea ice area, or the local tem-poral minimum), the trend is now close to−9 % per decade (Zwally and Gloersen, 2008). Much discussion arose after the minimum September ice cover in 2007 (Stroeve et al., 2007), but the ice area loss has reverted to a linear trend re-cently (Stroeve and Meier, 2010). These linear trends sug-gest a summer ice free Arctic between 2050 and 2080, com-parable to 1-D models applying increased long wave radia-tion due to ongoing global warming (Smedsrud et al., 2008). Less predictable future changes are related to changes in cloud cover (Sorteberg et al., 2007) and atmospheric circu-lation (Overland et al., 2008) .
The destiny of many Arctic sea ice floes is to leave the Arctic Ocean along the eastern coast of Greenland (Fig. 1). As first documented by the passive drift of the ship Fram (Nansen, 1906), a large area of sea ice is lost annually from the Arctic Ocean to the Greenland Sea through what was later termed the Fram Strait. Historically around 10 % of the Arc-tic sea ice cover is exported annually. With the decreasing ice covered area, and recent high area export documented here, this has now increased to above 15 %. Estimates of area ex-port have improved over the last decade (Vinje, 2001; Kwok et al., 2004; Kwok, 2009).
We present and discuss data on ice area export in this pa-per. Below we use the term ice export to refer to the ice area export. To discuss the volume or mass export of sea ice our data would have to be combined with ice thickness data as was done by Spreen et al. (2009). Along with the general thinning of the Arctic sea ice (Kwok and Rothrock, 2009), the Fram Strait thickness may also have thinned over the last decades. Changes in area transport may be, or may not be, balanced by changes in thickness regarding mass and volume. Trends in Fram Strait sea ice area export have previ-ously not been found (Vinje, 2001; Kwok et al., 2004; Kwok, 2009). However, within the Arctic Ocean sea ice drift speed has increased based on ice station and buoy data since the 1950’s, and increased speed has also been detected in the Fram Strait after 1979 (Hakkinen et al., 2008; Rampal et al., 2009).
Section 3 presents southward ice velocities across 79◦N
in the Fram Strait based on high accuracy Synthetic Aperture Radar (SAR) data onwards from 2004. High correlations be-tween the ice drift and geostrophic winds from atmospheric reanalysis data allow for calculations of the sea ice export back to the 1950’s. Earlier estimates of sea ice export and speed have mostly been based on passive microwave satel-lite data with coarser spatial resolution (Rampal et al., 2009; Kwok, 2009). We find that the ice area export has been high in recent years, and discuss likely consequences and causes of this high export in Sect. 4. Section 5 gives our conclusions on influence of the recent high ice area export on the Septem-ber minimum ice cover of the last few years, and the general thinning of Arctic sea ice.
2 Data and methods
Sea ice area export was calculated from sea ice motion and ice concentration profiles along 79◦N. Onwards from Au-gust 2004 ice drift vectors were calculated from pairs of En-visat ASAR WideSwath images captured 3 days apart with uninterrupted year-round coverage. Images were averaged to 300m/pixel spatial resolution, corresponding to a speckle noise well below 0.3 dB.
The manually recognised persistent ice features were grid-ded to 2 km accuracy and the corresponding displacement vectors that cross 79◦N were linearly interpolated to bins
Fig. 1. The Fram Strait between Greenland and Svalbard and mean sea ice properties for 2004–2010. Ice cover for summer (red, June through August) and winter (black, December through February) as solid (50 %) and dashed lines (15 %) . Above: southward ice drift
across 79◦N from August 2004 to July 2010 in 1◦ bins based on
SAR imagery, and ice concentration from SSMI and AMSR data. The ice area export is found by multiplying the ice drift and ice concentrations. Yellow circles show locations for surface pressure data used.
(1◦ longitude, each 21 km) from 15◦W to 5◦E. For most 3-day image pairs, displacement vectors with accuracy of about 10 % were found with a spacing of 30–50 km, including in-terpolation/extrapolation in the shear/ice edge zones. As the vectors can be assumed to be non-biased, cumulative motion over longer periods will have improved accuracy. We based ice concentration on Norsex algorithms used respectively on DMSP F13 SSMI and AQUA AMSR-E brightness temper-ature data, giving the combined ice-area flux along 79◦N, between 2004 and 2010 (Kloster and Sandven, 2011). Our mean of approx. 4500 observations of sea ice velocity along 79◦N was 12.0 cm s−1 southward (s.d. ±8.7) with a small westward component (4.3 cm s−1, s.d.±5.7). Monthly mean area export uncertainties were estimated to 5 %.
in 1957 we have omitted the 1948–57 period. Pressure differ-ence (1P) from 25◦W and 5◦E was extracted (Fig. 1), and
used to estimate correlations and linear regression estimates between geostrophic wind (Vg) and sea ice drift speed (Vice)
or ice area export (Fice).
Estimation of confidence levels takes into account serial correlation in the data sets by using the effective number of observations instead of the sample size in the significance es-timate (Quenouille, 1952; Sorteberg and Kvingedal, 2006). The number of independent observations was typically re-duced by∼50 % using this procedure.
An algorithm for feature tracking developed by Hodges (1994) and Hodges (1999) was used to construct storm tracks from the 6 hourly NCEP/NCAR reanalysis data from 1957 to 2007. The data set is an updated version of the one used in Sorteberg and Walsh (2008) where 850 hPa relative vorticity was used to identify the cyclones. To remove the influence of the background flow (pressure in cyclones moving northward tends to drop faster than a system moving southward due to the ambient pressure being lower at northern latitudes) the large scale flow was filtered out (Anderson et al., 2003) be-fore the synoptic low pressures were identified. For details see Sorteberg and Walsh (2008).
3 Results
Sea ice drift in general is created largely by the wind above, and the ocean current below the sea ice (Thorndike and Colony, 1982). The short-term variability is mostly wind driven, and this is also the case for Fram Strait ice speed and the related sea ice export (Vinje, 2001; Widell et al., 2003; Kwok et al., 2004; Tsukernik et al., 2009). In addition the Fram Strait ice export is constrained by the nearby Green-land coast, and amplified by the East GreenGreen-land Current. 3.1 Relationship between ice export and local wind
Figure 2 shows our linear fit for geostrophic wind and ice velocity (Eq. 1). The Fram Strait average ice velocity is 1.4 % of the geostrophic wind speed. The linear regression between
1P and Vice (1) gave coefficients comparable to classical
values (Thorndike and Colony, 1982).
Vice=0.014×Vg+0.050 [m s−1] (1)
where
Vg=(1/fρa)×(1P /1x) [m s−1]. (2)
Here f =2sin(80)=1.436×10⁻⁴s−1, the Coriolis pa-rameter, ρa=1.3 kg m−3, the density of air, and 1x=
573 km, the distance over the 1P from 25◦W to 5◦E on 80◦N. The correlation for the NCEP based1P drivenVice
(Eqs. 1 and 2) and the observedVicewas good (rspeed=0.83,
with the 95 % confidense interval [0.74–0.90]). Figure 2
−2 0 2 4 6 8 10 12 14
−5 0 5 10 15 20 25 30
Geostrophic wind [m/s]
Southward ice speed [cm/s]
Vice = 0.014Vg + 0.050 m/s
Fig. 2. Linear fit between Fram Strait southward ice speed and geostrophic wind. Monthly averages are shown as black dots and
are averaged along 79◦N. Red circles show values binned for each
m/s of wind. The shaded area is the standard error estimate of the linear fit.
shows the linear regression and that monthly averages of the ice speed ranges between zero and 25 cm s−1.
We found a similar relationship as Eq. (1) between 1P
and the ice area export:
Fice=87371P+24562 [km2month−1]. (3)
Correlation between sea ice area export and pressure differ-ence (3) was also good (rarea=0.80, with the 95 %
confi-dense interval [0.68–0.87]). A similar relationship between the pressure difference and sea ice area export was obtained using the ERA40 data and the correlation between NCEP and ERA40 (Uppala et al., 2005) reanalysis pressure difference was excellent (r=0.96).
Some of the variability in Fig. 2 is clearly caused by other factors than the geostrophic wind. Equation (1) integrates the ice speed over a long section, and among the likely candi-dates for the non-described variability is a varying ocean cur-rent and changes in sea ice properties (concentration, thick-ness, strength). Errors, either in the reanalysis or the drift speed, would also contribute. In general the sea ice thickness and concentration likely decreased, producing a weaker ice cover that responds better to wind forcing, i.e. the 0.014 fac-tor in Eq. (1) may have increased. Our value is an average over the period 2004–2010, but we did not find any system-atic shift with different behavior before and after 2007. Be-cause the linear relationship works for the 2004–2010 period, we also take it to be the best possible value before 2004. An attempt was additionally made to correlate the ice drift with the wind stress (Vg2), but that produced lower values forrspeed
3.2 Ice export variability
Along 79◦N ice area export is limited at both sides. In win-ter, the sea ice is stationary as fast ice westward of 16◦W
to 12◦W (Fig. 1). A relatively narrow shear zone is found
eastward, with a gradual increase in speed further east. On the whole western side ice concentration is close to 100 % during winter, but ice drift is low (Fig. 1). On the eastern end ice export is limited by zero concentration, varying be-tween 5◦W and 5◦E. Ice velocity generally increases east-ward, while sea ice concentration decreases, creating a peak in ice area export near 5◦W (Fig. 1). The yearly cycle in area export is pronounced. Figure 3 shows that the major export occurs between October and April, and that there is close to zero export in July and August. The Fram Strait ice speed is out of phase with the ice inside the Arctic Basin, where drift is slower during winter due to a more compact sea ice cover (Rampal et al., 2009).
The East Greenland Current flows below the sea ice in the Fram Strait. We found no evidence for a seasonality in this current, apart from that driven by the local cross-strait wind. Foldvik et al. (1988) analysed one year long time series from three moorings along 79◦N between 6 and 2◦W and found large mesoscale eddies meandering southwards, but no ob-vious seasonal variability. Southward flow was in the range 6.2 to 9.5 cm s−1, decreasing east of 2◦W. The East Green-land Current is in part driven by the local wind, and a re-lated change in cross-strait sea surface height will drive a barotropic part of the current. This wind-related variability is included in theVg term of Eq. (1). Figure 4 shows that
since 2004 the ice export approaches zero for two to three summer months every year. This is caused by winds from the south (negative cross-strait pressure gradient) opposing the steady southwards flowing current below the sea ice.
Assuming that the internal stresses in the sea ice can be ignored Eq. (1) also provides an estimate of the underlying non wind driven current. This is the constant term of Eq. (1), and is the speed of the ice given no local wind forcing. The mean current we get is 4.95 cm s−1, a value also consistent
with measurements from 79◦N 5◦W (Widell et al., 2003) between 1996 and 2000. Our results with a mean southward flow throughout the year between 2004 and 2010 is thus con-sistent with earlier studies. In the case of no wind forcing, or zero cross-strait pressure difference, there is still a steady export of sea ice. Our contribution from this steady current is an ice area flux of 24,562 km2per month. This steady current not driven by local wind, is related to horizontal density gra-dients and difference in the along-strait sea surface height, and has driven∼33 % of the ice export since 2004.
Compared to previous area export estimates at 81◦N (Kwok, 2009, Fig. 2) calculated in the same way, our val-ues in Eq. (3) differ substantially. Our value represent-ing the constant contribution from the East Greenland cur-rent (24,562 km2month−1, Eq. 3) is 12 % lower than Kwok (2009), and the term stating the dependency on the
cross-0 20 40 60 80 100 120
Ice area flux [1000 km
2/month]
Sep Oct Nov Dec Jan Feb Mar Apr May Jun Jul Aug
Autumn Winter Spring
NCEP (1957 − 2010) SAR (2004 − 2010) Kwok (1978 − 2007)
Fig. 3. Monthly mean Fram Strait sea ice area export during the year. Values from Kwok (2009) are added for comparison. Standard deviations of the NCEP values are shaded in grey. Increase due to the linear trend of each seasons ice export from 1957 to 2010 are plotted at the bottom.
2004 2005 2006 2007 2008 2009 2010 2011
0 20 40 60 80 100 120 140 160 180 200
Time
Ice area flux [1000 km
2/month]
NCEP SAR
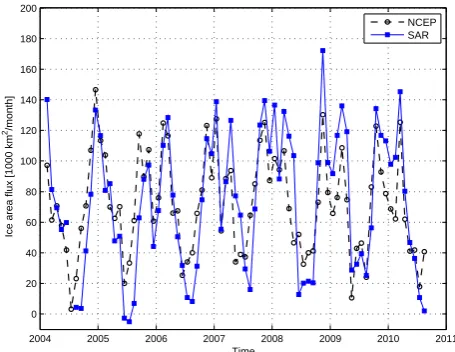
Fig. 4. Monthly ice area export values based on SAR velocity com-pared to the NCEP pressure difference formula (Eq. 3.)
strait pressure difference is 19 % larger (87371P, Eq. 3). Ice speed correlates better with geostrophic wind than ice area export (rspeed> rarea), probably because geostrophic
wind influences ice concentration to a small degree. 3.3 SAR-AMSR comparison
in the same longitude bins as for the SAR data. Figure 5 compares the northward velocity components for time pe-riods and longitude intervals where velocity data exists in both data sets. AMSR data exist for overall 34 % of the total number of longitude bins. The linear fit in Fig. 5 shows that there is good correspondence in the mean between SAR and AMSR derived southward ice drift. The considerable spread may be caused by several factors, but we hold these to be the most important: (1) the vectors’ time-of-day may differ, (2) AMSR has many non-zero drifts in the fast ice (at zero SAR speed), and (3) AMSR under-estimates at times speeds for the whole range of SAR speeds. The last factor likely causes the slight shift from diagonal at the largest velocities. However, on the average the figure gives a good reassurance in the two data sets, and indicates that the magnitude of the northward velocity estimates over the 6 years are close to re-ality.
Figure 6 shows the temporal coverage of the AMSR data in each longitude bin. The AMSR data has good coverage in the westernmost longitude bins, but it is dropping below 10 % east of 3◦W. The relative contribution to the total ice area flux for each longitude bin, derived from the SAR ice drift velocities, is also included in Fig. 6. In the bins between 15 and 10◦W AMSR coverage is above 50 %, but these bins carry a very small part of the ice export. The average AMSR coverage in the longitude bins which accounted for more than 90 % of the total ice area flux (Figs. 6, 11 to 0◦W), was as low as 29 %. The low temporal coverage of AMSR data in the longitude range which house most of the ice export dur-ing the winter season, is a likely explanation for why the variability demonstrated by our SAR based ice area fluxes has not been detected in other data sets.
4 Discussion
4.1 Mean export and variability
Figure 4 shows that our pressure based estimate of monthly ice export (Eq. 3) captures the observations faithfully. The mean yearly ice export based on the SAR velocities since 2004 is 0.888 million km2, while the similar NCEP based value (Eq. 3) is 0.883 million km2. The largest bias is found during large export events in the winter time (Fig. 4), but the bias is generally lower than∼10 %. The large export events during winter are usually caused by a combination of high ice speed (above 30 cm s−1), and high ice concentrations. Using
the full 50 years time series, our annual mean value is 0.76 million km2, clearly reflecting high values in recent years. This long term average is∼10 % higher than the 1979–2007 value from Kwok (2009).
−40 −35 −30 −25 −20 −15 −10 −5 0 5 10
−40 −35 −30 −25 −20 −15 −10 −5 0 5 10
AMSR northward ice drift [cm s−1]
SAR northward ice drift [cm s
−1]
Fig. 5. Comparison between southward ice drift speeds across
79◦N in the Fram Strait from SAR and AMSR data. The data
covers winters (October through April) between 2004 and 2010. Individual values are estimated 3-days drift velocities for a given longitude bin. Red line is a linear fit.
−15 −10 −5 0 5 0
1 2 3 4 5 6 7 8 9 10
Fraction of total ice flux [%]
−15 −10 −5 0 5
0 10 20 30 40 50 60 70 80 90 100
Longitude (deg)
AMSRE coverage [%]
4.2 Long term trends
We find a decrease in sea ice concentration across 79◦N for the period 1979 to 2009 (not shown), consistent with Kwok (2009). The overall decrease is−1.3 % per decade, but con-centrations fluctuate on seasonal and monthly timescales. Kwok (2009) found that the decrease in ice concentration since 1979 balanced increasing ice speed leading to no trend in ice area export in that data set. In our data set the sensi-tivity towards the increasing pressure gradient is higher, and we therefore also get a larger increase in ice speed. Figure 7 shows that annual Fram Strait mean speed has increased on-wards from 1957. This is consistent with increasing 1979– 2004 winter mean speed from passive micro-wave sensors (Rampal et al., 2009), and increasing ice drift speed within the Arctic Ocean (Hakkinen et al., 2008). The increasing southward ice drift velocity is large enough to create an in-crease in ice area flux. The annual means until 1970 are close to 10 cm s−1, while in the recent decade speeds were close to
12 cm s−1(Fig. 7) . The trend is +4.3 % per decade, about
half that observed in the Arctic Ocean (Rampal et al., 2009). Figure 8 shows that the increasing ice speed creates a clear positive trend in sea ice area export over the last 50 years. Af-ter 2004 all years had an ice export larger than the long Af-term average of 0.761 million km2. Trends are close to the over-all 5 % increase per decade throughout the period, and no particular shift can be seen, but there are large year to year fluctuations. The cross-strait pressure difference trend is sea-sonally strongest during winter, weaker during autumn and spring, and close to zero during summer, consistent with ear-lier results (Hakkinen et al., 2008; Kwok, 2009). This makes the seasonal increase in ice export strongest during winter, smaller during spring and autumn, and practically zero dur-ing summer (Fig. 3). As a test of the sensitivity of the trend estimate to the choice of reanalysis we redid the calcula-tions using the ERA40 reanalysis (Uppala et al., 2005) for the 1957–2003 period. A similar, but slightly weaker trend (13 % smaller) was found which confirms that the trend es-timates are not overly sensitive to the choice of reanalysis product.
In relative numbers the ice area export increase is larger than in absolute numbers, caused by the loss of around 2 million km2 over Arctic sea ice the last 30 years. While the export around 1980 was close to 10 % of the area of the Arctic sea ice, it has now increased to above 15 %. Using representative recent values (from 2007 and 2008), an export of 900×103km2year−1(Fig. 8) and an Arctic sea ice area of 4500×103km2, makes the present annual ice area export 20 % of the Arctic sea ice area.
The positive trend in sea ice export since 1957 (Fig. 8) is produced by a trend in the local pressure gradient (Eq. 3). The trend could be produced both by an increase in pressure on the Greenland (west) side, or a decrease on the Svalbard (east) side. We found that most of the trend is created by lower pressure in the east, and therefore searched for changes
1960 1965 1970 1975 1980 1985 1990 1995 2000 2005 2010
7 8 9 10 11 12 13 14 15
1957 − 2010 trend: 4.3 ± 2.5 % decade−1
Ice speed [cm/s]
Time
Fig. 7. Annual mean southward Fram Strait sea ice speed based on the NCEP surface pressure difference (Eq. 1). The linear trend for 1957–2010 is included.
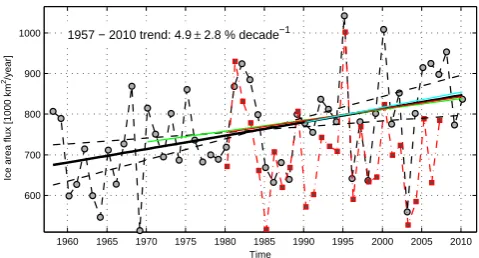
1960 1965 1970 1975 1980 1985 1990 1995 2000 2005 2010
600 700 800 900
1000 1957 − 2010 trend: 4.9 ± 2.8 % decade−1
Ice area flux [1000 km
2/year]
Time
Fig. 8. Annual mean Fram Strait sea ice area export values as driven by NCEP surface pressure difference. Values are averages for 1 September. through 31 August. Dashed lines indicate the 95 % confidence interval of the trend. Linear trends are added on-wards from 1970, 1980 and 1990 (different colours). Values from Kwok (2009) are added for comparison (red dash-dotted line).
in the low pressure systems entering the region from the south-west. The cross-strait trend is consistent with a sink-ing trend in sea level pressure in the Svalbard area in general as noted by Vinje (2001), and confirmed by updated sea level pressure data from Longyearbyen, Svalbard (not shown). Us-ing the cyclone track data set (Sorteberg and Walsh, 2008) we found a link between the wintertime local pressure gradient trend and the intensification of cyclones over the Nordic Seas (intensity measure was relative vorticity in 850 hPa). The correlation between the local winter pressure difference and the intensity of the Nordic Seas (60–85◦N and 20◦W–30◦E) cyclones (rcyclone=0.75) indicates that the local pressure
The overall trend in the Fram Strait pressure difference has been noted and used earlier (Widell et al., 2003; Kwok, 2009). Kwok (2009) also noted that the trend is strongest for January through March. Throughout the year we found the correlations between the cyclones and the pressure trends to be weaker, but still present for autumn and spring. Direct ob-servations from ships confirm the trend in the NCEP reanal-ysis mean sea level pressure over the North Atlantic (Chang, 2007). However, the trends in filtered mean sea level pres-sure variance statistics (mainly a meapres-sure of cyclone inten-sity) was about 70 % to 80 % of that found in the NCEP re-analysis, indicating that reanalysis trends may be influenced by density changes of the observational network.
A trend in Fram Strait sea ice area export has not been detected by most previous studies. Vinje (2001) found no visible trend for the period 1950–2000, but based on our re-lation between pressure difference and area export (Eq. 3) we get a trend of 3.8 % per decade for the years 1957–2000. Kwok (2009) did also not find a trend for the period 1979– 2007. Using our data we find a trend of 4.5 % per decade for these years. Overall we find a robust trend for 1957– 2010 with a magnitude close to 5 % per decade, and similar trends onwards from 1970, 1980 and 1990. This indicates a gradually increasing ice export over the last 50 years. This trend directly impacts boundary conditions of the Arctic sea ice cover. It is likely that the low export during the 1960’s (Fig. 8) contributed directly to a thicker ice cover during that decade than for the long-term average (Kwok and Rothrock, 2009). The seemingly constant Arctic sea ice thickness dur-ing the 1990’s (Winsor, 2001) is consistent with the low ex-port between 1996 and 1999 (Fig. 8). Recent thinning and less extensive sea ice cover reflects the increasing export on-wards from 2003.
Prior to 2004, the reanalysis based (Fig. 8 and Eq. 3) time series does not carry any information of possible cross-strait changes in width, ice speed, or ice concentration. We did consider blending in the ice concentration data back to 1979 with the slightly higher correlation of the ice speed (Eq. 1). However, because our results for 1979–2004 are similar to Kwok (2009) we believe any cross-strait changes have minor importance for this period. For the period 1957–1979 only the re-analysis is available, and any estimates of ice area flux will have to be model-based for this period. A more compact ice cover will have larger resistance towards wind forcing (Rampal et al., 2009). Because the ice concentration overall is decreasing, the same wind forcing would likely produce a higher speed now than prior to 2004. This would lead to a further increase in the area export than that indicated in Fig. 8.
4.3 The SAR-AMSR differences
Figure 6 shows the winter AMSR data coverage since 2004. An estimate of the ice area export along 79◦N based on these data would be highly dependent on interpolation, especially
for the region where most of the ice export occurs. Our SAR based ice area export estimates shows larger annual values and variability than earlier estimates of ice export (Vinje, 2001; Widell et al., 2003; Kwok, 2009), which were based on east-west extrapolation between single moorings, or pas-sive microwave satellite data. It is not the lack of data from the passive microwave satellites during summer that creates the difference, our summer values (Fig. 3) are close to exist-ing estimates (Kwok, 2009). The largest and most important ice export occurs during winter and in a longitudinal band that have previously not been adequately sampled.
The yearly cycle (Fig. 3) and periods with high and low ice export (Fig. 8) are consistent with earlier estimates (Kwok, 2009). We find a similar maximum for the sea ice export occurring in 1995, and low values in the late 80’s and 90’s. Because the SAR based ice speed coverage is much better for the area where most of the sea ice export occurs than the passive microwave satellites, our estimates should be the most accurate available today. For the SAR based time series (Fig. 4) we are using the same observations of ice concentra-tion as Kwok (2009), so differences in sea ice concentraconcentra-tion can not explain the difference. The increasing trend of 5 % per decade is largely created by low values in the 1960’s and higher values since 1980. The trend is maintained by the re-cent high SAR based values, but are not dependent on these. 4.4 Implications for summer sea-ice extent
Year to year variability of the summer ice cover could be produced within the Arctic Ocean by winter growth, summer melt, or ridging, or by ice export at the boundary (Perovich et al., 2008; Kwok and Cunningham, 2010; Ogi et al., 2008; Ogi et al., 2010). Figure 8 shows that the annual variabil-ity in ice export is 0.1 million km2, about 20 % of the vari-ability in summer sea ice area (0.5 million km2) (Stroeve and Meier, 2010). For 2005–2008 the annual ice export was high for four consecutive years, with values above 0.9 million km2 each year. This is unique over the last 50 years, is consistent with recent large scale wind shifts (Ogi et al., 2010), and must have contributed to the recent low summer sea ice cov-ers. The Arctic seasonal maximum sea ice cover occurs in late February or early March (Zwally and Gloersen, 2008). This suggests that the spring and summer (March–August) ice export should directly influence the following summer sea ice minimum (Kwok and Cunningham, 2010). We find support for such influence, and see potential for a seasonal prediction of the summer minimum using the spring export.
annual (Fig. 8) as well as spring and summer export (2009: 0.381 million km2 and 2010: 0.321 million km2) ended up lower than 2007. A new record in September minima for 2009 and 2010 was thus not expected based on the sea ice export forcing.
5 Conclusions
We presented Fram strait southward ice velocity based on high accuracy Synthetic Aperture Radar (SAR) data on-wards from 2004. Using available ice concentration data we found the mean yearly ice area export for 2004–2010 to be 0.888 million km2. This value is∼25 % higher than the 1979–2007 average from Kwok (2009). The high sea ice area export must have been a significant contributor to the low September sea ice covers observed in recent years. The sea ice area export in 2009 and 2010 was lower than for the previous years, 2005, 2006, 2007 and 2008, perhaps indicat-ing that the sea ice export may return to more moderate levels again soon.
High correlations between the ice drift and geostrophic winds from atmospheric reanalysis data allowed for calcula-tions of the sea ice area export back to the 1950’s. Our long term mean value (1957–2010) is 0.761 million km2, 10 % higher than the earlier estimate (Kwok, 2009). We found a robust trend for 1957–2010 with a magnitude of 5 % per decade, and similar trends onwards from 1970, 1980 and 1990. This indicates a gradually increasing ice export over the last 50 years, and is a direct change in boundary condi-tions to the Arctic sea ice. The positive trend is produced by a trend in the local pressure gradient, related to intensification of cyclones over the Nordic Seas.
The dramatic loss of Arctic sea ice the last decades is clearly related to increased long-wave radiation caused by ongoing atmospheric CO2 increase, but other factors have
also contributed (Smedsrud et al., 2008). Once the ice thick-ness decreased substantially a number of feedback effects may have contributed (Perovich et al., 2008; Rampal et al., 2009; Screen and Simmonds, 2010). Because General Circu-lation Models presently underestimate the decrease (Stroeve et al., 2007), additional factors have likely contributed that are not captured by the models. Contrary to previous con-clusions (Vinje, 2001; Kwok, 2009), the ice export has likely increased since the 1960’s. We therefore hold that the ice ex-port has been an effective contributor to Arctic sea ice loss so far, and that it will play an important part in the years to come as well.
Acknowledgements. The reanalysis data were obtained from the National Center for Environmental Prediction (NCEP) data server, and the ERA-40 data from the European Centre for Medium-Range Weather Forecasts (ECMWF) data server. We would like to thank Jerome Weiss and an anonymous reviewer for helpful suggestions, the editor Hajo Eicken, and Ron Kwok for supplying his ice export
data. This work was supported by the NorClim, Pocahontas and Damocles projects, and is publication A327 from the Bjerknes Centre for Climate Research.
Edited by: H. Eicken
References
Anderson, D., Hodges, K. I., and Hoskins, B. J.: Sensitivity of feature-based analysis methods of storm tracks to the form of background field removal, Mon. Weather Rev., 131, 565–573, 2003.
Bj¨ork, G.: The relation between ice deformation, oceanic heat flux, and the ice thickness distribution in the Arctic Ocean, J. Geo-phys. Res., 102, 18689–18698, 1997.
Boe, J., Hall, A., and Qu, X.: September sea-ice cover in the Arctic Ocean projected to vanish by 2100, Nat. Geosci., 2, 341–343, doi:10.1038/NGEO467, 2009.
Chang, E. K. M.: Assessing the increasing trend in Northern Hemi-sphere winter storm track activity using surface ship observations and a statistical storm track model, J. Climate, 20, 5607–5628, doi:10.1175/2007jcli1596.1, 2007.
Ezraty, R., Girard-Ardhuin, F., and Croiz-Fillon, D.: Sea ice drift in the central Arctic using the 89 GHz brightness temperatures of the Advanced Microwave Scanning Radiometer, http://www. ifremer.fr/cersat, 2010.
Foldvik, A., Aagaard, K., and Tørresen, T.: On the velocity field of the East Greenland Current, Deep-Sea Re.s, 35, 1335–1354, 1988.
Gloersen, P. and Campbell, W. J.: Recent variation in Arctic and Antarctic sea-ice covers, Nature, 352, 33–36, 1991.
Haas, C., Pfaffling, A., Hendricks, A. S., Rabenstein, L., Etienne, J. L., and Rigor, I.: Reduced ice thickness in Arctic Transpolar Drift favors rapid ice retreat, Geophys. Res. Lett., 35, L17501, doi:10.1029/2000JC000723, 2008.
Hakkinen, S., Proshutinsky, A., and Ashik, I.: Sea ice drift
in the Arctic since 1950s, Geophys. Res. Lett., 35, L19704, doi:10.1029/2008GL034791, 2008.
Hodges, K. I.: A general method for tracking analysis and its ap-plication to meteorological data, Mon. Weather Rev., 122, 2573– 2586, 1994.
Hodges, K. I.: Adaptive constraints for feature tracking, Mon. Weather Rev., 127, 1362–1373, 1999.
Kalnay, E., Kanamitsu, M., Kistler, R., Collins, W., Deaven, D., Gandin, L., Iredell, M., Saha, S., White, G., Woollen, J., Zhu, Y., Chelliah, M., Ebisuzaki, W., Higgins, W., Janowiak, J., Mo, K. C., Ropelewski, C., Wang, J., Leetmaa, A., Reynolds, R., Jenne, R., and Joseph, D.: The NCEP/NCAR 40-year reanaly-sis project, B. Am. Meteorol. Soc., 77, 437–471, 1996.
Kloster, K. and Sandven, S.: Ice Motion and Ice Area Flux in
Fram Strait at 79◦N using ASAR and passive microwave for Feb.
2004–Jul. 2010, Tech. Rep. 322, Nansen Environmental and Re-mote Sensing Centre, Bergen, Norway, 2011.
Kwok, R.: Outflow of Arctic Ocean sea ice into the Greenland and Barents Seas: 1979–2007, J. Climate, 22, 2438–2457, doi:10.1175/2008JCLI2819.1, 2009.
Kwok, R. and Cunningham, C. F.: Contribution of melt in
coverage: 1993–2009, Geophys. Res. Lett., 37, L20501, doi:10.1029/2010gl044678, 2010.
Kwok, R. and Rothrock, D. A.: Decline in Arctic sea ice thickness from submarine and ICESat records: 1958–2008, Geophys. Res. Lett., 36, L15501, 2009.
Kwok, R., Cunningham, G., and Pang, S.: Fram Strait
sea ice outflow, J. Geophys. Res., 109, C01009,
doi:10.1029/2003JC001785, 2004.
Nansen, F.: The Norwegian North Polar Expedition 1893–1896, Scientific Results, The Fridtjof Nansen fund for the advancement of science, 1906.
Ogi, M., Rigor, I. G., McPhee, M. G., and Wallace, J. M.: Summer retreat of Arctic sea ice: Role of summer winds, Geophys. Res. Lett., 35, L24701, doi:10.1029/2008gl035672, 2008.
Ogi, M., Yamazaki, K., and Wallace, J. M.: Influence of winter and summer surface wind anomalies on summer Arctic sea ice extent, Geophys. Res. Lett., 37, L07701, doi:10.1029/2009gl042356, 2010.
Overland, J., Wang, M., and Salo, S.: The recent Arctic
warm period, Tellus A, 60, 589–597, doi:10.1111/j.1600-0870.2008.00327.x, 2008.
Perovich, D. K., Richter-Menge, J. A., Jones, K. F., and Light, B.: Sunlight, water and ice: Extreme Arctic sea ice melt dur-ing the summer of 2007, Geophys. Res. Lett., 35, L11501, doi:10.1029/2008GL034007, 2008.
Quenouille, M. H.: Associated Measurements, 242 pp., Butter-worths Scientific, 1952.
Rampal, P., Weiss, J., and Marsan, D.: Positive trend in the mean speed and deformation rate of Arctic sea ice, J. Geophys. Res., 114, C05013, doi:10.1029/2008jc005066, 2009.
Screen, J. A. and Simmonds, I.: The central role of diminishing sea ice in recent Arctic temperature amplification, Nature, 464, 1334–1337, 2010.
Smedsrud, L. H., Sorteberg, A., and Kloster, K.: Recent and future changes of the Arctic Sea Ice Cover, Geophys. Res. Lett., 35, L20503, doi:10.1029/2008GL034813, 2008.
Sorteberg, A. and Kvingedal, B.: Atmospheric Forcing on the Bar-ents Sea Winter Ice Extent, J. Climate, 19, 4772–4784, 2006. Sorteberg, A. and Walsh, J. E.: Seasonal cyclone variability at
70◦N and its impact on moisture transport into the Arctic, Tellus,
60, 570–586, doi:10.1111/j.1600-0870.2008.00314.x, 2008.
Sorteberg, A., Kattsov, V., Walsh, J., and Pavlova, T.: The Arctic surface enrgy budget as simulated with the IPCC AR4 AOGCMs, Clim. Dynam., 29, 131–156, doi:10.1007/s00382-006-0222-9, 2007.
Spreen, G., Kern, S., Stammer, D., and Hansen, E.: Fram
Strait sea ice volume export estimated between 2003 and 2008 from satellite data, Geophys. Res. Lett., 36, L19502, doi:10.1029/2009GL039591, 2009.
Stroeve, J. and Meier, W.: Sea Ice Trends and Climatologies from SMMR and SSM/I, edited, http://nsidc.org/data/seaice/ data summaries.html, 2010.
Stroeve, J., Holland, M., Meier, W., Scambos, T., and Serreze, M.: Arctic sea ice decline: Faster than forecast, Geophys. Res. Lett., 34, L09501, doi:10.1029/2007GL029703, 2007.
Thorndike, A. and Colony, R.: Sea Ice Motion in Response to Geostrophic Winds, J. Geophys. Res., 87, 5845–5852, 1982. Tsukernik, M., Deser, C., Alexander, M., and Tomas, R.:
Atmo-spheric forcing of Fram Strait sea ice export: a closer look, Clim. Dynam., 1349–1360, doi:10.1007/s00382-009-0647-z, 2009. Uppala, S. M., Kallberg, P. W., Simmons, A. J., Andrae, U.,
Bech-told, V. D., Fiorino, M., Gibson, J. K., Haseler, J., Hernandez, A. Kelly, G. A., Li, X., Onogi, K. Saarinen, S., Sokka, N., Al-lan, R. P., Andersson, E., Arpe, K., Balmaseda, M. A. Beljaars, A. C. M., Van De Berg, L., Bidlot, J., Bormann, N., Caires, S., Chevallier, F., Dethof, A., Dragosavac, M., Fisher, M., Fuentes, M., Hagemann, S., Holm, E., Hoskins, B. J., Isaksen, L. Janssen, P. A. E. M., Jenne, R., McNally, A. P., Mahfouf, J. F., Morcrette, J. J., Rayner, N. A., Saunders, R. W., Simon, P., Sterl, A., Tren-berth, K. E., Untch, A., Vasiljevic, D., Viterbo, P., and Woollen, J.: The ERA-40 re-analysis, Q. J. Roy. Meteor. Soc., 131, 2961– 3012, 2005.
Vinje, T.: Fram strait ice fluxes and atmospheric circulation: 1950– 2000, J. Climate, 14, 3508–3517, 2001.
Widell, K., Østerhus, S., and Gammelsrød, T.: Sea ice velocity in the Fram Strait monitored by moored instruments, Geophys. Res. Lett., 30, 1982, doi:10.1029/2003GL018119, 2003.
Winsor, P.: Arctic Sea Ice Thickness Remained Constant During the 1990s, Geophys. Res. Lett., 28, 1039–1041, 2001.