Quantifying hydrogen peroxide in iron-containing solutions using leuco
crystal violet
Corey A. Cohna兲
Department of Geosciences and Center for Environmental Molecular Science, Stony Brook University, Stony Brook, New York 11794-2100
Aimee Pak
Department of Chemistry and Center for Environmental Molecular Science, Stony Brook University, Stony Brook, New York 11794-2100
Daniel Strongin
Department of Chemistry, Beury Hall 201, 1901 North 13th Street, Temple University, Philadelphia, Pennsylvania 19122 and Center for Environmental Molecular Science, Stony Brook University, Stony Brook, New York 11794-2100
Martin A. Schoonen
Department of Geosciences and Center for Environmental Molecular Science, Stony Brook University, Stony Brook, New York 11794-2100
共Received 24 February 2005; accepted 26 April 2005; published 14 June 2005兲
Hydrogen peroxide is present in many natural waters and wastewaters. In the presence of Fe共II兲, this species decomposes to form hydroxyl radicals, that are extremely reactive. Hence, in the presence of Fe共II兲, hydrogen peroxide is difficult to detect because of its short lifetime. Here, we show an expanded use of a hydrogen peroxide quantification technique using leuco crystal violet共LCV兲for solutions of varyingpH and iron concentration. In the presence of the biocatalyst peroxidase, LCV is oxidized by hydrogen peroxide, forming a colored crystal violet ion共CV+兲, which is stable for
days. The LCV method uses standard equipment and allows for detection at the low microM concentration level. Results show strongpH dependence with maximum LCV oxidation atpH 4.23. By chelating dissolved Fe共II兲with EDTA, hydrogen peroxide can be stabilized for analysis. Results are presented for hydrogen peroxide quantification in pyrite–water slurries. Pyrite–water slurries show surface area dependent generation of hydrogen peroxide only in the presence of EDTA, which chelates dissolved Fe共II兲. Given the stability of CV+, this method is particularly useful for field work
that involves the detection of hydrogen peroxide. © 2005 American Institute of Physics.
关DOI: 10.1063/1.1935449兴
INTRODUCTION
Hydrogen peroxide is an important reactant in natural aquatic systems, environmental remediation technologies, and in biological systems. Reactive oxygen species 共ROS兲, which include hydrogen peroxide共H2O2兲and hydroxyl
radi-cals共·OH兲occur in rain1,2and surface waters.3,4ROS play an important role in natural processes in aquatic systems, in-cluding, radiolysis,5,6pyrite oxidation,7–9and photochemical oxidation.10,11Hydrogen peroxide also is intentionally added to wastewaters to promotein situoxidation processes12,13by leveraging the extreme reactivity of radicals toward organic pollutants. The generation of·OH, via the decomposition of H2O2, degrades contaminants when methods involving mi-crobiological degradation are ineffective. In organisms, in-cluding humans, ROS are produced during metabolic and immune system function.14 When ROS concentrations are above normal for prolonged periods of time, however, their presence can lead to oxidative stress.15 Oxidative stress is now recognized to be an important factor in the development or enhancement of many diseases.16
Among ROS, H2O2is relatively stable,17in the presence
of ferrous iron, H2O2forms·OH via the Fenton reaction
Fe共II兲+ H2O2→
·
OH + OH−+ Fe共III兲. 共1兲
·
OH is far more reactive than H2O2 and its reaction with
aqueous species is diffusion limited.17 Therefore, H2O2, in
the presence of Fe共II兲, represents great potential for reactiv-ity.
In natural systems, ·OH is a transient species and its steady-state concentration may only be in the nM range. The inherent reactivity of·OH precludes its detection via a direct measurement, and hence, methods generally rely on the de-tection of a stable reaction product resulting from the reac-tion of ·OH and a target molecule. One strategy is to add a reactant as a target species that will oxidize in the presence of ·OH and form a product that can be analyzed by UV–Vis spectroscopy2 or fluorescence.18 Verifying·OH involvement in oxidation of the target species is difficult. Addition of competing scavengers that react with ·OH may inhibit oxi-dation of the target molecule; however, there is little confor-mity when using different scavengers and target molecules.19 Another strategy that is often employed is to “trap” the un-paired electron of the radical into a compound that is less
a兲Author to whom correspondence should be addressed; electronic mail:
reactive. By using electron paramagnetic resonance 共EPR兲, the EPR intensity of the spin-trapped molecule can be di-rectly related to the concentration of ·OH in the solution. EPR spin-trapping is a very sensitive technique and has been widely used in chemistry, environmental sciences, and
bio-共medical兲 sciences; however, it does require a significant capital investment and spin-trapping cannot be conducted in the field. The spin-trapping technique has also been used for ·
OH detection from aqueous mineral slurries, however reac-tion between Fe共III兲 and the spin-trap complicates interpre-tation of the data.20
Where detection of ·OH is impracticable, identifying H2O2 may elucidate a reaction mechanism involving ·OH
formation. In iron-containing systems, both H2O2 and ·OH are short-lived. However, chelation of iron 关i.e., Fe共II兲兴 avoids its interaction and decomposition of H2O2. Hence, we argue that hydrogen peroxide detected in iron-containing systems with an iron-chelator added is a proxy for the capac-ity of the system to generate ·OH in the absence of an iron chelator. This strategy may prove useful as an alternative method for radical detection in natural systems.
Several methods are available for quantifying H2O2.
UV–Vis absorbance共240 nm,⑀= 43.6 M−1cm−1兲21
is conve-nient for H2O2 solutions containing no other UV absorbing
chromophores. Another spectrophotometric method uses copper共II兲 and 2,9-dimethyl-1,10-phenanthroline 共DMP兲 for M H2O2 detection in wastewater.22 The colored complex
does not change in the presence of humic acid; however, metal chelators affect the copper reactivity, complicating its use when iron chelation is necessary. For higher sensitivity detection, fluorometric techniques are available. The scopoletin/horseradish peroxidase method23allows for detec-tion of low nM concentradetec-tions, but the need for standard additions and quantification via a decrease in fluorescence prove to be time consuming. Another fluorometric technique involves the oxidation of non-fluorescent 2
⬘
, 7⬘
-dichloro-fluorescin 共DCFH兲 to fluorescent 2⬘
, 7⬘
-dichlorofluorescein共DCF兲in the presence of H2O2 and peroxidase.18This tech-nique is often used to detect the formation of H2O2 in cells.
The technique makes use of the non-fluorescent 共 DCFH-diacetate兲 crossing of cell membranes, which is enzymati-cally deacetylated to non-fluorescent DCFH. Cellular pro-duction of H2O2 produces the fluorescent DCF. The deacetylation process can be achieved chemically, but H2O2
may be produced in the process,24 resulting in background levels of H2O2. Another disadvantage for using the DCFH
technique is the necessity for daily preparation of the DCFH reagent.
Here, we present results on an improved method for H2O2 detection in the M to several hundred nM range,
which has several advantages over preexisting methods. The leuco crystal violet 共LCV兲 method25 involves oxidation of 4 , 4
⬘
4⬙
-methylidynetris 共N,N-dimethylaniline兲 共C25H31N3兲共LCV兲 in the presence of H2O2 and horseradish peroxidase
共HRP兲to form the crystal violet ion, CV+, which absorbs at
590 nm. CV+remains stable for several days, which makes it
possible to treat samples upon collection and perform the analysis at a later time. This is of value in field studies or
shipboard analysis.26 Daily preparation of new reagents is not required and iron chelators do not affect the analysis.
In this report, the LCV method was employed for analy-sis of H2O2 in pyrite/aqueous slurries. Recently,9 pyrite
共FeS2兲, the most abundant metal sulfide mineral on Earth,
has been shown to produce H2O2in aqueous solutions.
Sev-eral adjustments were made to the original LCV method so that it is now possible to determine H2O2 concentration in
aqueous systems that contain iron-bearing minerals. Here, we determined effects of iron,pH, and addition of EDTA. To verify that our technique was specific to the presence of H2O2, and that other species were not responsible for the
oxidation of LCV in the presence of HRP, we carried out experiments in the presence of catalase. This enzyme selec-tively decomposes H2O2, and its addition to the solution
prior to the addition of LCV and HRP eliminates the produc-tion of the CV+species.
EXPERIMENT
Leuco crystal violet 共Spectrum兲 in the presence of the enzyme horseradish peroxidase 共HRP兲 type II 共Aldrich兲 forms a crystal violet cation, which has an absorbance maxi-mum at 590 nm. The absorbance of CV+was measured with
a Hach DR4000 spectrometer interfaced with a laptop for data storage. Calibration curves were used to quantify the effects ofpH, iron共Fisher brand ferrous ammonium sulfate兲, and EDTA 共Sigma兲 on the absorbance of CV+. Catalase
共Sigma 40 000 to 60 000 units/ mg bovine liver兲was used at a concentration around 100 000 units per sample vial to verify the presence of H2O2. Pyrite共Wards brand from
Hua-nzala, Peru兲was crushed and sieved under an ambient atmo-sphere, acid washed共0.1 M HCl兲, and then thoroughly rinsed with N2-purged water 共Easy Pure 18.3 M⍀cm,
UV-irradiated, and ultrafiltered兲under N2atmosphere to remove
surface oxides. The acid-washed and cleaned pyrite was sub-sequently dried in a vacuum desiccator and stored under vacuum. The size fraction used in these experiments was between 10 and 90m with a five point N2adsorption BET surface area of roughly 1.25 m2/ g. This BET surface area is
an approximation due to the inherent variations for low sur-face area measurements.27 Varying amounts of the pyrite were mixed with water in the absence or presence of 1 – 10 mM EDTA, then immediately filtered 共Millipore 0.45m兲. Reagents 关all stored at 4 ° C and brought up to room temperature共22± 1 ° C兲before analyses兴were added to the aqueous filtrate in the following order for a total volume of 2 ml共also shown in Table I兲: 100 mM KH2PO4共Aldrich兲
pH 4 buffer, 41M leuco crystal violet 共dissolved with HCl兲, and 4 mg/ 50 ml HRP 关containing 1.5 mM azide
共Sigma兲 to prevent bacterial growth兴. Samples were kept in the dark at room temperature 共22± 1 ° C兲 for 30 min, upon which absorbance stabilized. Absorbance measurements were taken in 1 cm path-length cuvettes.
RESULTS AND DISCUSSION
Compared to the concentrations used by Zhanget al.forpH buffer, LCV, and HRP, we used 1.25, 4, and 10 times those previously used, respectively, to increase共1兲the buffer con-centration,共2兲the higher range of detection共more LCV兲, and
共3兲the reaction rate共more HRP兲. By increasing the concen-tration of our reagents, we were able to limit the volume of reagent addition so that a maximum volume would be avail-able for the sample.
Figure 1 shows color development over time after the last reagent, HRP, is added to hydrogen peroxide and LCV. Absorbance levels plateau in 5 – 10 min and remain stable for several days. Zhanget al.26 waited 5 min before taking ab-sorbance measurements; we waited 30 min just as a caution-ary measure to ensure stability of the absorbance. The inset is a plot of wavelength scans showing maximum absorbance at 590 nm and an overlapping of scans after 2 min. Absor-bance measurements at 590 nm共A590兲were taken at 30 min
for all other samples.
Addition of catalase is important for verifying the pres-ence of H2O2, since other ROS or other reactions may also
oxidize LCV. When catalase is added, no H2O2 is detected,
which limits the possibility of false positives.
The LCV method is strongly affected bypH, and Fig. 2 shows A590 as a function of pH. The optimal pH range is
3.6–4.2, where the peak intensity is the highest, but the in-tensity decreases by half as thepH increases to 4.37共Fig. 2兲. Zhang et al.26 have shown a similar increase in absorbance up to aroundpH 4.5. They report CV+precipitation at higher
pH, and here, the effect at pH greater than 4.5 is shown. AlthoughA590is significantly reduced and the solutions are
slightly turbid, calibration curves can still be produced and H2O2quantified.
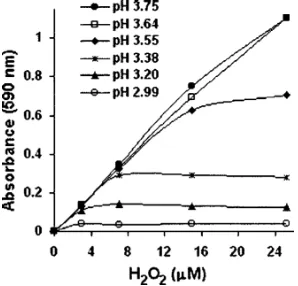
Figure 3 shows calibration curves made between pH 2.99 and 3.75 with 0 – 24M H2O2. At pH values of 3.20 and less, the method is not valid. In thepH range of 3.38– 3.55, the calibration curves are only useful at low H2O2
con-centrations. AtpH 3.64 and 3.75, the curves are nearly linear. These results are consistent with those presented in Fig. 1, which showed the optimalpH range of around 3.6–4.2; here, the calibration curves are nearly linear atpH 3.64 and 3.75. AbovepH 3.75, the slopes are expected to be linear共results from higher-pH experiments are presented in the following兲. In separate experiments, which are not shown, calibration curves were extended into the nM region indicating a lower limit around 0.5M.
In the presence of Fe共II兲, EDTA is necessary for stabi-lizing H2O2. As solution pH is increased, EDTA is de-protonated, therefore having a higher capacity for chelation
共the EDTA stock solution is pH 8兲. In our experiments, 1 mM EDTA with LCV reagents resulted in a pH around 3.67. At this pH, calibration curves with EDTA are equiva-lent to those without EDTA. Figure 4 shows the effect of iron on A590 at several H2O2 concentrations in the presence of 1 mM EDTA. Even without H2O2, EDTA and iron oxidize
LCV in the presence of HRP. This may be due to reaction of
TABLE I. LCV method details.a
Reagent
Reagent preparation
Stock concentration
Volume added
共l兲
Final concentration
Sampleb ¯ ¯ 1700 ¯
KH2PO4
pH buffer
136.07 g + 0.5 L H2O,
pH adjusted to 4.2
with H3PO4
1 M 200 100 mM
LCV 31 mg LCV+ 30 ml
H2O + 19.2 ml of 0.25 N HCl
1.65 mM 50 41M
HRP 4.0 mg HRP+ 50 ml
H2O + 92l of 1 M sodium azide
0.08 mg/ ml共14.4
units/ml兲
50 1g共0.18
units兲
aReagent preparations, concentrations, volume added, and final concentrations of the solutions added to a 4 ml
cuvette and kept in the dark before analysis. Reagents listed in order of addition. H2O2calibration solutions
were prepared by dilutions of a stock.
bSamples containing pyrite were filtered.
FIG. 1. Oxidation of LCV in the presence of 20M H2O2and HRP as a
function of time after addition of all reagents. Insert shows wavelength scans of the solutions showing maximum absorbance at 590 nm.
FIG. 2. Absorbance of the buffered LCV and HRP solution as a function of
LCV with either the electron-deficient chelated iron or iron-EDTA complex. When ferrous iron is added at low concen-trations 共0 – 15M兲 there is an increase in absorbance but theA590is not affected as the iron concentration is increased
above 15M iron. At low iron concentrations共0 – 15M兲, the slopes of the calibration curves are nearly identical to those calculated from experiments without EDTA and iron. As iron is increased, H2O2decreases. This experimental
ob-servation is due to a higher proportion of nonchelated iron, which reacts with H2O2. Although some of the H2O2 was
decomposed in the presence of iron, linear calibration curves can still be generated. In these experiments, the concentra-tion of EDTA is much greater than that for iron. EDTA che-lation capacity decreases with decreasing pH. The optimal
pH for the LCV technique is around 4, which necessitates the addition of high concentrations of EDTA.
Figure 5 shows calibration curves with 10 mM EDTA solutions at varying ferrous iron concentrations. The pH of these solutions is between 5.9 and 5.6. The A590 does not
vary by much as a function of pH in this region. Therefore, differences in the curves are due to iron. Compared to the high EDTA concentration, relatively low iron concentrations decompose H2O2. This is probably due to the lowpH where
EDTA has a lower chelation capacity. At higher iron concen-trations, around 150– 200M, only the higher H2O2
concen-trations are detected. ThepH for EDTA-containing solutions was buffered but thepH was not forced to the optimalpH of 4.23 because addition of highly acidic buffers alter EDTA chelation capacity and, in the field, it is easier to quantify H2O2by using apH-specific calibration curve than trying to
force thepH to 4.23.
Using the DMP method28and an ultrahigh vacuum mass spectroscopy technique,9 pyrite has recently been shown to produce H2O2. Here, we used the LCV method and
em-ployed EDTA to verify H2O2 at several particle loadings
共Fig. 6兲. These results show a surface area dependence on H2O2generation. The H2O2concentrations reported here are
about 200 times lower than those obtained previously
共34M at a 4 g / L loading兲.28 The higher readings in the prior study may have been due to the presence of dissolved Fe共II兲, which enhances H2O2 readings with the DMP
method. The DMP method uses Cu, so EDTA would inter-fere with the analysis. Hence the values reported in our ear-lier work based on the DMP method are overestimated.
Addition of catalase to the solution prior to the addition of LCV results in a colorless solution, suggesting that hydro-gen peroxide was not present upon addition of LCV and HRP共Fig. 7兲. Catalase specifically reacts with H2O2, so that
it will remove any H2O2from the EDTA-treated solution. By
performing two measurements, one with EDTA and one with EDTA plus catalase, we rule out false positives due to other reactions that could conceivably lead to the formation of CV+. Without EDTA, there is no LCV oxidation, since in this
case ferrous iron, either on the pyrite surface or in solution, is not chelated and it can react with hydrogen peroxide to form·OH. In a separate study,29we have shown that without
FIG. 3. Calibration curves as a function ofpH. H2O2quantification using
Beer’s law is only applicable at H2O2ⱗ12M forpH = 3.55 andⱗ6M
forpH = 3.38.
FIG. 4. Effect of dissolved ferrous iron onA590at several H2O2
concentra-tions共given inµm兲in the presence of 1 mM EDTA atpH = 3.67.
FIG. 5. Calibration curves as a function of ferrous iron共added as ferrous
ammonium sulfate, given inµm兲in 10 mM EDTA.
FIG. 6. Pyrite-generated H2O2 as a function of particle loadings. 1 mM
EDTA was used for the 20 and 40 g / L loadings and 10 mM EDTA was used for the 80 and 160 g / L loadings. The EDTA solutions were quickly mixed with pyrite particles for about 3 s and filtered. LCV and HRP were then
added to the filtrate. When catalase is added prior to LCV, H2O2 is not
EDTA, pyrite readily degrades biomolecules including RNA, presumably due to hydroxyl radical generation from the re-action of ferrous iron with hydrogen peroxide. This study also showed that addition of EDTA protects the biomol-ecules, which are only degraded if·OH is formed.
For H2O2detection in natural waters, the LCV technique
may be one of the more suitable methods. It has already been shown that the method can be used for seawater analyses26 and here we show that it can be used for a pH range of around 3.5–6.0 and in the presence of EDTA. Compared to techniques involving fluorescence, where reagents are pre-pared on the day of analyses, our solutions of LCV and HRP remained stable for months at 4 ° C in opaque centrifuge vials. The stability of CV+ upon reaction of H2O2 and the
LCV reagents makes it possible to quantify H2O2 several
days after sampling. This can be exploited in field studies. For example, the LCV technique could be used to study the spatial and temporal distribution of H2O2 in hot spring
wa-ters in Yellowstone National Park. It has been shown that steady-state levels of photochemically produced H2O2in the
surface geothermal waters at Yellowstone National Park reach 200– 600 nM by late afternoon and decrease to less than 50 nM during the night.30 With the LCV technique a large number of water samples can be collected and prepared for later analysis. Temperature is expected to affect the rate of the HRP-mediated reaction and it could possibly also af-fect the stability of the LCV or CV+. Probably the best
strat-egy working with hydrothermal waters is to rapidly cool the sample down to a temperature between 20 and 30 ° C before adding the reagents. Cooling the samples to much lower tem-perature may impede the enzyme reaction. Further experi-mental work would be needed to resolve this temperature dependence. The LCV technique may also prove to be useful to evaluate the performance of environmental remediation projects involving the injection of H2O2 into contaminated
waters. Many groundwaters contain dissolved iron, which could make it difficult to determine the residual H2O2
con-centration. With the LCV techniques samples can be treated with ETDA and preserved for latter analysis.
CONCLUSION
This study demonstrates a reliable and efficient method for quantifying H2O2 from iron-containing mineral slurries
and waste by use of separate calibration curves to account for
pH and iron concentrations. The stability of the colored CV+
makes this method suitable for the field or when immediate access to a spectrophotometer is not possible. Relative to the concentration of H2O2 consumed, the reported25 high molar
absorptivity of 75 000 M−1cm−1 for CV+ makes it possible
to determine H2O2at sub-M concentration levels. In
iron-containing systems at low pH, hydrogen peroxide reacts to form ·OH. Under those conditions, the presence of H2O2 as
an intermediate to ·OH formation would be extremely diffi-cult to detect. The LCV technique as outlined provides a relatively simple method to demonstrate the involvement of H2O2under those conditions.
ACKNOWLEDGMENTS
This work was funded by the Department of Energy through grants to D.R.S. and M.A.S., Basic Energy Sciences Grant Nos. DEFG029ER14644 and DEFG0296ER14633, re-spectively. The Center for Environmental Molecular Science
共NSF CHE 0221934兲 facilitated the contribution of A.P. to this project. C.C. would like to acknowledge support from a National Defence Science and Engineering Fellowship.
1J. D. Willey, R. J. Kieber, and R. D. Lancaster, J. Atmos. Chem. 25, 149
共1996兲.
2B. C. Faust and J. M. Allen, Environ. Sci. Technol. 27, 1221共1993兲.
3P. J. Hakkinen, A. M. Anesio, and W. Graneli, Can. J. Fish. Aquat. Sci.
61, 1520共2004兲.
4L. J. A. Gerringa, M. J. A. Rijkenberg, K. R. Timmermans, and A. G. J.
Buma, Netherlands J. Sea Res. 51, 3共2004兲.
5M. Ammeet al., Environ. Sci. Technol. 39, 221共2005兲. 6F. Clarenset al., Environ. Sci. Technol. 38, 6656共2004兲. 7E. Ahlberg and A. E. Broo, Int. J. Min. Process. 47, 49共1996兲.
8J. M. Allen, S. Lucas, and S. K. Allen, Envir. Toxicol. Chem. 15, 107
共1996兲.
9M. J. Borda, A. R. Elsetinow, D. R. Strongin, and M. A. Schoonen, Croat.
Chem. Acta 67, 935共2003兲.
10W. Stumm and J. J. Morgan,Aquatic Chemistry: Chemical Equilibria and
Rates in Natural Waters, 3rd ed.共Wiley-Interscience, New York, 1995兲, p. 1022.
11P. Vaughan and N. Blough, Environ. Sci. Technol. 32, 2947共1998兲.
12P. R. Gogate and A. B. Pandit, Adv. Environ. Res. 8, 501共2004兲.
13M. Arienzo, Chemosphere 39, 1629共1999兲.
14W. Dröge, Physiol. Rev. 82, 47共2002兲.
15J. Nordberg and E. S. J. Arnér, Free Radic Biol. Med. 31, 1287共2001兲.
16T. Finkel and N. J. Holbrook, Nature共London兲 408, 239共2000兲.
17W. A. Pryor, Annu. Rev. Physiol. 48, 657共1986兲.
18C. P. Lebel, H. Ischiropoulos, and S. C. Bondy, Chem. Res. Toxicol. 5,
227共1992兲.
19C. C. Winterbourn, Free Radic Biol. Med. 3, 33共1987兲.
20K. Makino, T. Hagiwara, A. Hagi, M. Nishi, and A. Murakami, Biochem.
Biophys. Res. Commun. 172, 1073共1990兲.
21A. G. Hildebrandt and I. Roots, Arch. Biochem. Biophys. 171, 385
共1975兲.
22K. Kosaka, H. Yamada, S. Matsui, S. Echigo, and K. Shishida, Environ.
Sci. Technol. 32, 3821共1998兲.
23T. Holm, G. George, and M. Barcelona, Anal. Chem. 59, 582共1987兲.
24C. Rota, C. F. Chignell, and R. P. Mason, Free Radic Biol. Med. 27, 873
共1999兲.
25H. A. Mottola, B. E. Simpson, and G. Gorin, Anal. Chem.42, 410共1970兲.
26L. S. Zhang and G. T. F. Wong, Talanta 41, 2137共1994兲.
27S. J. Gregg and K. S. W. Sing,Adsorption, Surface Area and Porosity
共Academic, London, 1982兲.
28M. Borda, A. Elsetinow, M. Schoonen, and D. Strongin, Astrobiology 1,
283共2001兲.
29C. A. Cohn, M. J. Borda, and M. A. Schoonen, Earth Planet. Sci. Lett.
225, 271共2004兲.
30C. L. Wilsonet al., Environ. Sci. Technol. 34, 2655共2000兲.
FIG. 7. 共Color兲Photograph of the cuvettes containing pyrite slurry filtrate
and LCV reagents. Both contain 1 mM EDTA. The left cuvette is purple due
to CV+. On the right, catalase was added before addition of LCV. Catalase
reacts rapidly with H2O2, preventing LCV oxidation and resulting in a