R E S E A R C H
Open Access
ZFAS1:
a long noncoding RNA associated
with ribosomes in breast cancer cells
Herah Hansji
1,2, Euphemia Y. Leung
1,2, Bruce C. Baguley
1, Graeme J. Finlay
1,2, David Cameron-Smith
3,
Vandre C. Figueiredo
3and Marjan E. Askarian-Amiri
1,2*Abstract
Background:Most of the eukaryotic genome is transcribed, yielding a complex network of transcripts including thousands of lncRNAs that generally lack protein coding potential. However, only a small percentage of these molecules has been functionally characterised, and discoveries of specific functions demonstrate layers of complexity. A large percentage of lncRNAs is located in the cytoplasm, associated with ribosomes but the function of the majority of these transcripts is unclear. The current study analyses putative mechanisms of action of the lncRNA species member
ZFAS1that was initially discovered by microarray analysis of murine tissues undergoing mammary gland development. As developmental genes are often deregulated in cancer, here we have studied its function in breast cancer cell lines. Results:Using human breast cancer cell lines,ZFAS1was found to be expressed in all cell lines tested, albeit at different levels of abundance. Following subcellular fractionation, humanZFAS1was found in both nucleus and cytoplasm (as is the mouse orthologue) in an isoform-independent manner. Sucrose gradients based on velocity sedimentation were utilised to separate the different components of total cell lysate, and surprisinglyZFAS1was primarily co-localised with light polysomes. Further investigation into ribosome association through subunit dissociation studies showed thatZFAS1was predominantly associated with the 40S small ribosomal subunit. The expression levels ofZFAS1and of mRNAs encoding several ribosomal proteins that have roles in ribosome assembly, production and maturation were tightly correlated.ZFAS1knockdown significantly reduced RPS6 phosphorylation. Conclusion:A large number of lncRNAs associate with ribosomes but the function of the majority of these lncRNAs has not been elucidated. The association of the lncRNAZFAS1with a subpopulation of ribosomes and the correlation with expression of mRNAs for ribosomal proteins suggest a ribosome-interacting mechanism pertaining to their assembly or biosynthetic activity.ZFAS1may represent a new class of lncRNAs which associates with ribosomes to regulate their function.
Reviewers:This article was reviewed by Christine Vande Velde, Nicola Aceto and Haruhiko Siomi.
Keywords:ZFAS1, lncRNA, Ribosome, Protein translation, Breast cancer, Small subunit of ribosome
Background
Long non-coding RNAs (lncRNAs) comprise a large proportion of the transcribed RNA species in cells, and are responsible for a diversity of functions [1]. Early studies of lncRNAs showed that they are located in the nucleus, in which they interact with different chromatin-modifying complexes, resulting in a paradigm in which
lncRNAs regulate transcription through chromatin modi-fication [2]. The field of lncRNA research has rapidly expanded, and novel functions have been identified. LncRNAs are versatile molecules that function also in the cytoplasm where they interact with other RNA species to regulate their processing and post-transcriptional regu-lation, with numerous proteins to regulate their func-tion and with ribonucleoprotein complexes to modulate translation, either of specific genes or of protein syn-thesis globally [3].
LncRNAs are involved in complex biological processes such as normal development and disease pathogenesis * Correspondence:[email protected]
1
Auckland Cancer Society Research Centre, University of Auckland, 85 Park Rd, Grafton, Auckland 1023, New Zealand
2Department of Molecular Medicine and Pathology, University of Auckland,
85 Park Rd, Grafton, Auckland 1023, New Zealand
Full list of author information is available at the end of the article
[4]. Several lncRNAs are associated with known develop-mental protein-coding genes, and many lncRNAs are differentially expressed during induced differentiation of embryonic stem cells [5]. Loss of function of a subset of lncRNAs involved in embryonic development leads to loss of pluripotency or commitment to differenti-ation programmes [6, 7]. LncRNAs have also been iden-tified as establishing and maintaining gene expression patterns during the development of different tissues and organs, including breast tissue, in which they con-tribute to the differentiation and organisation of the mammary epithelium [8].
Recent studies have found that a large proportion of long non-coding RNAs, despite lacking protein-coding potential, are associated with the ribosomes [9–11]. The precise function of the majority of these transcripts interacting with ribosomes remains unknown, although those few that have been studied in detail have been found to regulate translation by associating with the polysomes during stress conditions and regulating the translation of specific mRNAs, such asUchl1AS, an anti-sense lncRNA which regulates its protein-coding partner UCHL1 [12]. This however is unlikely to be the main mechanism of action of ribosome-associated lncRNAs as few antisense lncRNAs colocalise with their protein-coding partners [9]. Other lncRNAs associate with ribo-somes for targeted degradation, but transcriptome-wide studies of ribosome-mediated degradation have found only a few lncRNAs utilising this pathway [13]. Given the complexity of ribosomes, from their biogenesis to their synthetic function, there are many possible avenues by which lncRNAs could regulate ribosomal activity. Ribosomes have long been known to be deregulated in tumourigenesis, with a large number of tumour suppressor genes and oncogenes modifying the trans-lational activity of ribosomes [14].
Recent microarray analyses of tissue from mouse mammary glands at different stages of post-pubertal de-velopment have revealed that several lncRNAs are differ-entially expressed in developing mammary glands [15]. Of these lncRNAs, a previously uncharacterised lncRNA (GenBank ID AK005231) was studied, as it is differen-tially expressed during mouse mammary gland develop-ment and also found at the syntenic region in the human genome. This lncRNA, Zfas1, is located on the antisense strand of the Znfx1 (zinc finger NFX-1-type containing) promoter region and is host to three snoR-NAs. Further analysis of this lncRNA showed that it is expressed in most tissues, but showed greatest abun-dance in developing mammary glands [15]. In vivo, Zfas1was found to be restricted to the epithelial cells of the mammary gland ducts and alveoli of pregnant mice. Knockdown of Zfas1 by siRNA in a mouse mammary epithelial cell line increased cellular differentiation
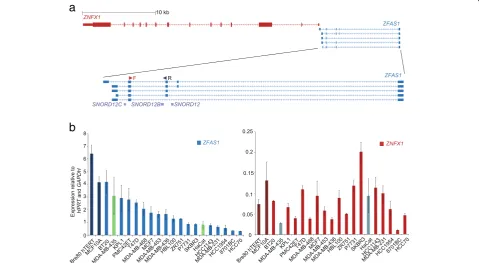
significantly and to a lesser extent induced proliferation [15]. These experiments suggested that Zfas1 plays im-portant roles in mammary gland development. In the human genome the lncRNA antisense toZNFX1showed similar structure to Zfas1 in mouse (Fig. 1a). Given its role in mammary epithelial proliferation and differenti-ation, ZFAS1 expression was compared in human inva-sive ductal carcinoma and in normal breast tissue, and was found to be decreased in abundance in the former [15]. These results prompted further study of the func-tion ofZFAS1using human breast cancer cell lines.
According to the Mar 2006 NCBI36.1/hg18 genome assembly, at least five different isoforms of ZFAS1exist [16]. They vary in size from 516 to 1006 bases with exons two and five common to all isoforms. In the present study, we sought to identify different isoforms of ZFAS1 and to investigate their cellular localisation. We confirmed that ZFAS1 is expressed as at least five different isoforms, found in both cytoplasmic and nu-clear compartments. We also found that cytoplasmic ZFAS1 is localised primarily with 80S ribosomes and light polysomes, and ribosome dissociation studies showed thatZFAS1is associated with the small subunit of the ribosome. Global inhibition of ribosome activity through growth arrest and treatment with the transla-tion inhibitor puromycin leads to an increase ofZFAS1 content in certain cell lines. ZFAS1 expression is strongly correlated with that of a number of mRNAs encoding ribosomal proteins involved in ribosome bio-genesis, and its abundance also increases upon induced ribosome biogenesis. Knockdown of ZFAS1 decreases the phosphorylation state of the ribosomal protein RPS6. ZFAS1 may be involved in the regulation of the ribosome through interactions with mature ribosomes in the cytoplasm as well as through interactions with immature ribosomes in the nucleus.
Results
Protein-coding potential forZFAS1
another lncRNA that is host to several snoRNAs as de-scribed by Ingolia et al. [18]. A peak in ribosomal occu-pancy was observed in exon 2 of the ZFAS1 isoforms, which corresponded to an open reading frame (ORF) that predicted a peptide of 25 amino acids (M D F G R G S H H W T S K E A T C R H L Q P S I S Stop). A query of PeptideAtlas, a database of peptide sequences deduced from proteomic analyses [19], showed that no peptides have been identified that correspond to this particular ORF. Together, these observations led us to conclude that the human isoforms ofZFAS1are unlikely to encode a peptide.
Expression ofZFAS1andZNFX1in breast cancer: cell line and The Cancer Genome Atlas data
ZFAS1 is expressed in mouse mammary gland tissues, and was previously found to be downregulated in human invasive ductal breast carcinoma, as compared to normal breast tissue [15]. To further analyse ZFAS1 expression and to characterise its function, we have used breast cancer as our model system. We performed qPCR on cDNA prepared from 17 breast cancer cell lines, a kera-tinocyte cell line (HaCat), a melanoma cell line
(MDA-MB-435) and two breast epithelial cell lines, Bre80hTert and MCF10A. Different levels of expression of ZFAS1 were detected in these cell lines, as shown in Fig. 1b. ZNFX1 was also expressed in these cell lines, and as with previous results [15], was approximately 25 fold less abundant thanZFAS1(Fig. 1b). The expression levels of ZFAS1 and ZNFX1 were not significantly correlated (Pearson correlation coefficient, R =−0.0021, p= 0.93), further suggesting thatZFAS1andZNFX1are independ-ently regulated (Fig. 1b). We also could not detect any significant difference inZFAS1orZNFX1expression be-tween ER+ (n= 9) and ER- (n= 5) cell lines (P= 0.38) (data not shown). Many lncRNAs regulate the protein-coding genes incis. If this was the case withZFAS1and ZNFX1, it would be expected that the abundance of their transcripts should be related. The lack of any cor-relation is evidence thatcisregulation involving this pair of genes does not apply, and provides a basis for seeking alternativeZFAS1activities.
samples from normal breast tissue. The expression of ZFAS1 was not significantly different in breast cancer patients as compared to healthy controls (P= 0.4941) as shown in Additional file 2: Figure S2A(i). However, ZFAS1 expression was significantly reduced in basal (p= 0.0331) and HER2 (p= 0.0011) breast cancer sub-types (Additional file 2: Figure S2A(ii)) compared to normal breast tissue. ER+ (n= 601) breast tumours also displayed higher expression of ZFAS1 compared to ER- (n= 179) negative breast tumours (p= 0.0212) (Additional file 2: Figure S2A(iii)). Our earlier publi-cation (2011), using a limited number of samples, suggested that ZFAS1 expression was down-regulated in breast cancer cells relative to normal breast epithelial cells. Our current study sought to investigate this finding more thoroughly, using large TCGA datasets, and found no differences between unselected neoplastic and normal breast samples. The possible subtle differences between ZFAS1expression in certainsubtypesof breast cancer and normal cells (Additional file 2: Figure S2A) could reflect the large number of samples examined, and thus be of minimal clinical impact.
Additional file 2: Figure S2B displays a Kaplan-Meier plot generated from http://www.oncolnc.org of TCGA breast cancer data set. High expressers are those 50% of patients with the highestZFAS1expression, and low ex-pressers are those 50% of patients with the lowestZFAS1 expression. These groups do not show significant differ-ences in survival up to 6000 days.
ZFAS1isoforms are located in the cytoplasm
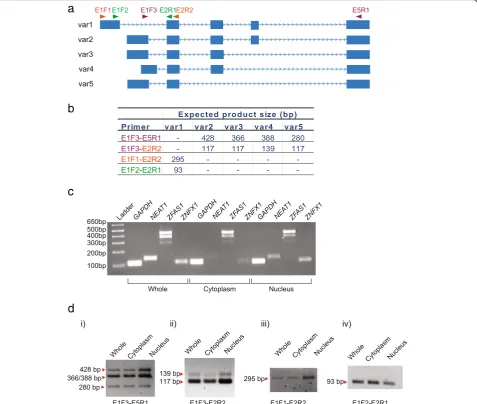
Previous experiments in mice showed that Zfas1 was found in both cytoplasm and nucleus, whereas Znfx1 mRNA was restricted to the nucleus [15]. Since cellular location will dictate function of lncRNA, cellular frac-tionation was performed to identify the subcellular local-isation of ZFAS1 in MDA-MB-468 and MDA-MB-231 breast cancer cells. Cell lysates were separated into cyto-plasmic and nuclear fractions, total RNA extracted and analysed by RT-PCR. ZFAS1 is present as 5 isoforms (Figs. 1a and 2a) and primers were designed to amplify all isoforms while allowing differentiation of these iso-forms through product size (Fig. 2b). For the purpose of validating the effectiveness of the fractionation proced-ure, we used NEAT1, a nuclear lncRNA, as a nuclear marker, and GAPDH as a positive control as it is found in both the cytoplasm and nucleus (Fig. 2c). As indicated for MDA-MB-468 cell extracts, ZFAS1 was found in both the cytoplasm and nucleus, indicating that ZFAS1 is not restricted to a specific cellular compartment. ZNFX1 on the other hand is enriched in the nucleus (Fig. 2c) as previously reported [15]. All the isoforms of ZFAS1 identified were present in both the cytoplasm and the nucleus; therefore the functions of the isoforms
are not distinguishable by compartmentalisation (Fig. 2d). No difference between the two cell lines was observed.
Identification of aZFAS1binding partner in cytoplasm
The functions of numerous lncRNAs have been deduced by identifying their binding partners. To infer possible ZFAS1functions, we explored whetherZFAS1was asso-ciated with macromolecular complexes. Total cell lysate was separated on a sucrose gradient by the principle of velocity sedimentation. If ZFAS1 was associated with large structures such as ribosomes or spliceosomes, it would migrate further down the sucrose gradient. Con-versely, ifZFAS1was associated with small protein com-plexes, it would remain near the top of the gradient.
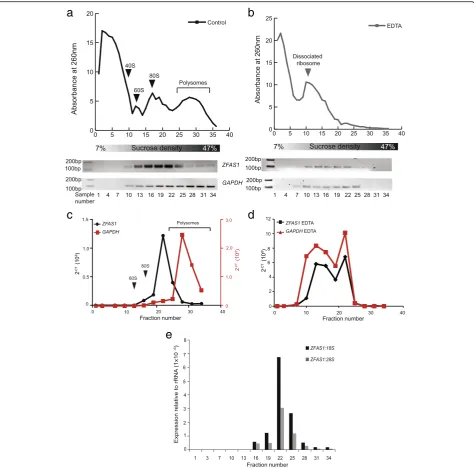
Representative fractions from the gradient were assayed for the presence of ZFAS1 molecules by RT-PCR.ZFAS1 was found in the bottom half of the gradi-ent, and its distribution matched regions of the A260 nm profile corresponding to the position of 80S riboso-mal subunits and light polysomes (Fig. 3a). GAPDH, a constitutively translated mRNA, was used as a positive control for association with polysomes.
To distinguishZFAS1interactions with ribosomal com-ponents rather than with other non-ribosomal RNA-protein complexes, the sedimentation profile of ZFAS1 was analysed by RT-PCR after sucrose-density centrifuga-tion in the presence of 15 mM EDTA. The sequestracentrifuga-tion of Mg2+by EDTA leads to dissociation of ribosomes from mRNAs without disrupting non-ribosomal RNA-protein complexes [20]. Figure 3b shows that EDTA treatment disrupted the ribosome profile, leading to the loss of poly-somes and a leftwards shift of the A260-absorbing species, indicating that ribosomes and free mRNAs had dissoci-ated from each other. It also leads to the loss of the mRNAGAPDHand of the lncRNAZFAS1from the lower polysome fractions and a concomitant shift of their distri-bution to the upper fractions of the gradient. These results indicate that the loss ofZFAS1from the lower fractions is due to its dissociation from ribosomes, and not from non-ribosomal protein and/or RNA complexes (Fig. 3b), sug-gesting thatZFAS1is a ribosome-bound lncRNA.
ZFAS1binds to the small ribosomal subunit
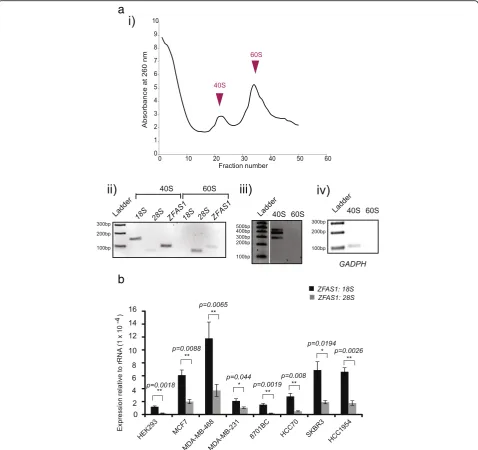
To elucidate the role of ribosome-associated ZFAS1 in regulating ribosome function, we sought to iden-tify the subunit with which ZFAS1 was associated. Crude ribosome pellets from MDA-MB-468 cells were incubated with 0.5 M KCl and 1.5 mM MgCl2 buffer and separated in 15–30% sucrose gradients [21]. Fractions from the peaks of the ribosome gradi-ent profile corresponding to 40S and 60S subunits (Fig. 4aai) were isolated and extracted RNA was used for cDNA synthesis and analysis by RT-PCR. The
18S and 28S rRNA molecules were used as controls to confirm the identity of the ribosomal subunit that was present in particular fractions and extracted RNA was used for cDNA synthesis and further ana-lysis by PCR. We confirmed that ZFAS1 is predomin-antly associated with the small ribosomal subunit (Fig. 4aii), in an isoform-independent manner (Fig. 4a(iii)) similar to GAPDH mRNA (Fig. 4(aiv)), and thus is unlikely to play a role in elongation or ter-mination of protein translation which engages the large ribosomal subunit.
Fig. 3ZFAS1is associated with actively translating ribosomes.aPolysome distribution of MDA-MB-468 cell lysates as separated on a 7–47% sucrose gradient. Absorbance at 260 nm is shown on the Y axis. Fractions from the top of the gradient to the bottom are shown from left to right on the X axis. Fractions were collected in 36 equal volumes, of which every third was used for RNA extraction, and cDNA synthesised for PCR. The presence ofZFAS1expression was assessed using primers described in Fig. 1, withGAPDHacting as a positive control. Both species were enriched in the bottom fractions of the gradient, corresponding to polysomes.bPolysome distribution of MDA-MB-468 cell lysate separated on a 7–47% sucrose gradient containing EDTA instead of MgCl2. Loss of the polysome peak is observed, together with a leftward shift of the ribosome subunits. RT-PCR analysis (lower panels) showed thatZFAS1andGAPDHare no longer enriched in the lower peaks, and show concomitant shifts to the upper fractions.canddQuantitative expression ofZFAS1andGAPDHmeasured by qPCR relative to18Sand28SrRNAs prepared with and without the addition of EDTA (black graph forZFAS1,red graph forGAPDH).ZFAS1andGAPDHare no longer enriched in the lower fractions corresponding to polysomes following polysome disruption by EDTA. Arrows indicate where ribosomal features are observed on profiles in relation to fraction number.eRatio ofZFAS1to18Sand28SrRNA in fractions from MDA-MB-468 polysome gradients. qPCR was performed using samples from polysome separation and expression ofZFAS1relative to18Sand28Swas calculated.ZFAS1was detected in fractions 16–34 and showed greatest abundance in fraction 22, corresponding to light polysomes. The ratio ofZFAS1: 18Sis also greater than that of
Further analysis in different cell lines of ZFAS1 abundance relative to that of 18S and 28S rRNA cor-rected for dilution factor showed that the ratio of ZFAS1:18S is greater than that of ZFAS1:28S (Fig. 4b) with approximately 1500–8000 and 2500–50,000 18S and 28S rRNA molecules to each ZFAS1 molecule, respectively.
ZFAS1expression is correlated with expression of genes encoding proteins involved in ribosome biogenesis Zfas1is differentially expressed during successive stages of mammary gland development [15]. We revisited our original microarray data of mouse mammary gland tran-scriptomes [15] and found that the expression of several ribosomal protein genes was correlated with Zfas1 Fig. 4ZFAS1is predominantly associated with the small ribosomal subunit.a(i) Ribosomal subunit profile of MDA-MB-468 cells. The Y and X axes represent the A260 and fraction numbers respectively. Sample 1 is from the top of the gradient while 50 is the bottom fraction. (ii)ZFAS1RT-PCR products using primers as described in Fig. 1 from each peak, fractions 22 and 34.18Sand28SrRNA are used to indicate the small and large subunit distribution in the gradient. (iii)ZFAS1RT-PCR products using primers E1F3-E5R1 from each peak, showing thatZFAS1is expressed with the 40S subunit in an isoform-independent manner. (iv)GAPDHRT-PCR products from each peak, used as a positive control.bRatio ofZFAS1to
18Sand28SrRNA in different cell lines. qPCR was performed on extracts from various cell lines and expression ofZFAS1relative to18Sand28S
expression during mammary gland development (Table 1). We selected these transcripts for further analysis of human expression data derived from TCGA dataset as described above. The expression of ZFAS1 was not significantly different in breast cancer patients as compared to healthy controls (P= 0.4941), which was the case also with RPS3 (P= 0.14) (Add-itional file 3: Figure S3A and B).
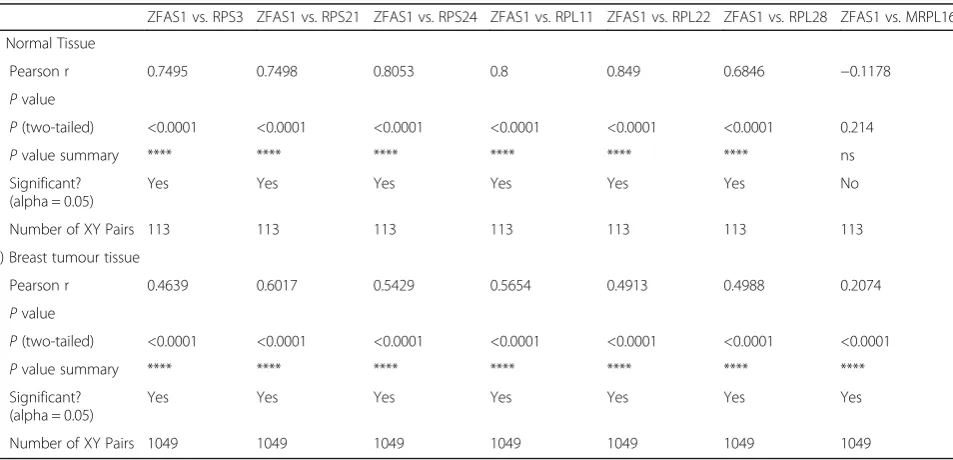
The other ribosomal protein gene transcripts identified in mouse mammary gland to correlate [15] with ZFAS1, i.e.RPS21,RPS24,RPL22andRPL28, showed significant expression differences between normal and tumour sam-ples (*P< 0.05, **P< 0.01, ***P< 0.001, ****P < 0.0001; Additional file 3: Figure S3D, F, H and J). However, the actual difference in expression between cancer and nor-mal tissue is negligible and the significance reflects the large sample size. The expression of these ribosomal protein genes was strongly and positively correlated with ZFAS1 expression in normal human tissues (Table 2,
Additional file 3: Figure S3) (Spearman correlation, r= 0.68-0.85, p> 0.001). The expression of these ribosomal protein genes was also correlated with that of ZFAS1in breast cancer samples, showing moderate positive corre-lations (r= 0.41–0.60). To confirm that this was not a random phenomenon, genes were randomly selected and possible correlations withZFAS1 investigated (Additional file 4: Table S1). These genes exhibited either weak or no correlation withZFAS1 indicating thatZFAS1 is specific-ally correlated with genes encoding cytoplasmic ribosomal proteins.
ZFAS1increases during ribosome biogenesis
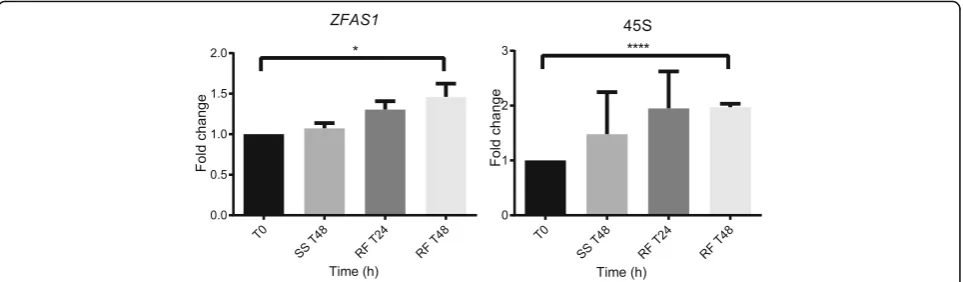
To investigate whetherZFAS1expression changes in par-allel with transcripts of ribosomal proteins, we induced ribosome biogenesis in MDA-MB-468 cells by starving them for 48 h in medium containing 0.5% serum, followed by refeeding with medium containing 10% serum.45S, the pre-rRNA transcript, was used as a marker of ribosome biogenesis. During starvation, expression of ZFAS1 and 45Sremained the same as in untreated cells. At 48 h after refeeding with serum-supplemented medium, the abun-dance ofZFAS1 increased by 46% (p= 0.048), and of45S increased by 97% (p< 0.0001) (Fig. 5).
ZFAS1knockdown: a subtle phenotype with a ribosomal connection
The MDA-MB-468 cell line was selected for knock down of ZFAS1 by shRNA as this cell line has moder-ately high expression of the gene. Four different shRNAs targeting ZFAS1 as well as a control scrambled shRNA were used. The level of downregulation of ZFAS1 Table 1Genes encoding ribosomal proteins, expressed
differentially during successive stages of mouse mammary gland development and concordantly withZfas1(microarray data)
Target uniGene symbol
Target uniGene name
Log2 fold change (lactating/pregnant)
Zfas1 AK005231,BC042795 −5.106
Rpl22 Ribosomal protein L22 −6.18
Rps24 Ribosomal protein S24 −6.007
Rps3 Ribosomal protein S3 −5.665
Rps21 Ribosomal protein S21 −5.435
Rpl28 Ribosomal protein L28 −4.577
Table 2Correlation ofZFAS1 expression with that of ribosomal protein genes in human (i) non-tumour and (ii) breast cancer samples (TCGA data)
ZFAS1 vs. RPS3 ZFAS1 vs. RPS21 ZFAS1 vs. RPS24 ZFAS1 vs. RPL11 ZFAS1 vs. RPL22 ZFAS1 vs. RPL28 ZFAS1 vs. MRPL16
i) Normal Tissue
Pearson r 0.7495 0.7498 0.8053 0.8 0.849 0.6846 −0.1178
Pvalue
P(two-tailed) <0.0001 <0.0001 <0.0001 <0.0001 <0.0001 <0.0001 0.214
Pvalue summary **** **** **** **** **** **** ns
Significant? (alpha = 0.05)
Yes Yes Yes Yes Yes Yes No
Number of XY Pairs 113 113 113 113 113 113 113
ii) Breast tumour tissue
Pearson r 0.4639 0.6017 0.5429 0.5654 0.4913 0.4988 0.2074
Pvalue
P(two-tailed) <0.0001 <0.0001 <0.0001 <0.0001 <0.0001 <0.0001 <0.0001
Pvalue summary **** **** **** **** **** **** ****
Significant? (alpha = 0.05)
Yes Yes Yes Yes Yes Yes Yes
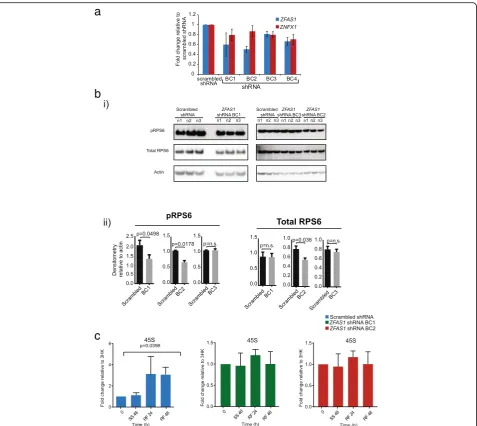
following shRNA transfection was determined by qPCR using the scrambled shRNA to normalize the expression level (Fig. 6a). The result confirmed that the two shRNAs that achieved the greatest knockdown effects wereZFAS1 shRNA BC1 and BC2, which achieved reductions of ZFAS1 to 60 and 50% respectively. These shRNA trans-fected cell lines were chosen for further analysis.
Previous work in mouse cell lines has suggested that ZFAS1 acts as a regulator of proliferation [15]. Using cells transfected with ZFAS1 shRNA BC2 as described above, we measured cell proliferation over 7 days using the SRB assay (Additional file 5: Figure S4A). No signifi-cant differences were observed between cells transfected with scrambled control andZFAS1 shRNA BC2. Trans-fection with the scrambled control and ZFAS1 shRNA BC2 also did not result in significant differences in cell size (Additional file 5: Figure S4B) or global nascent pro-tein synthesis (Additional file 5: Figure S4C).
AsZFAS1was found associated with the small riboso-mal subunit we postulated that ZFAS1 may regulate ribosome activity through interactions with components of the 40S subunit. We chose to examine ribosomal pro-tein S6 (RPS6), one of the major propro-teins on the small ribosomal subunit. It undergoes inducible phosphoryl-ation mediated through TORC1 and promotes protein synthesis [22]. To examine whether ZFAS1 affects the phosphorylation state of RPS6 we performed Western blot analysis by using total protein from cells containing ZFAS1 shRNA BC1 and BC2 and scrambled controls shRNA, investigating the relative abundance of phos-phorylated RPS6 (the functionally active form) and total RPS6 (Fig. 6bi). Knockdown of ZFAS1 decreased the phosphorylation level of RPS6 in ZFAS1 BC1 and BC2 shRNA transfected cells by 36 and 35% respectively (Fig. 6bii). Total RPS6 also decreased in ZFAS1 BC2 shRNA transfected cells (28%), although to a lesser ex-tent than phospho-RPS6. When compared to BC3,
which did not decrease ZFAS1, there was no change in either phospho-RPS6 or total RPS6 protein abundance (Fig. 6b). The decrease in abundance and phosphoryl-ation state of RPS6 supports the hypothesis of functional interactions betweenZFAS1and the 40S subunit.
As ZFAS1 was induced during ribosome biogenesis, we hypothesised thatZFAS1may play a role in ribosome induction. To determine whether induction of ribosome biogenesis was affected by ZFAS1, qPCR was performed on cells transfected with ZFAS1 shRNA BC1, BC2 and scrambled controls after serum starvation and subse-quent refeeding with normal medium (Fig. 6c). The abundance of45Sincreased 3-fold (p= 0.0398) in scram-bled controls 48 h after the reintroduction of normal medium. This response is similar to that shown by non-transfected MDA-MB-468 cells in an earlier experiment (Fig. 5).ZFAS1knockdown cells displayed no significant change in 45S abundance after serum starvation or refeeding, a finding that supports the hypothesis of its role in ribosome production.
ZFAS1(variant 4) has a 5’TOP sequence and may resist NMD
Five different isoforms of ZFAS1 have been reported (Fig. 2a and d), of which the sequence of the 5’ end is predicted to be repeats of pyrimidines, indicative of the 5’TOP structural motif. 5’-RACE (rapid amplification of cDNA ends) was performed to confirm sequences indi-cated by the current genomic assembly. Due to the GC-rich nature of the 5’-end of exon 1, only exon 1 of vari-ant 4 was identified (Additional file 6: Figure S5A). This exon aligned to RefSeq Accession Number NR_003604, March 2006 NCBI36/hg18 with a variable number of thymidine residues at the 5’end found in different tran-scripts (Additional file 6: Figure S5A).
mRNAs encode ribosomal proteins and elongation fac-tors, while other previously studied 5’TOP lncRNAs in-clude transcripts containing snoRNAs in intronic sequences. Upon inhibition of protein synthesis, these transcripts accumulate as they are no longer able to enter the ribosome wherein they would be degraded by the nonsense-mediated decay (NMD) pathway [23]. As ZFAS1is host to three snoRNAs as well as containing a
5’TOP, we hypothesised thatZFAS1 might be regulated by a similar pathway.
GAS5, with HEK293 cells showing greater accumulation (15 fold increase) than MDA-MB-231 cells (3 fold in-crease) at 72 and 48 h respectively. These cells, as well as 8701BC cells, also showed a significant increase in ZFAS1 (Additional file 6: Figure S5B). Thus, our results suggest that the accumulation of ZFAS1and GAS5 dur-ing serum starvation is cell line-specific.
To further investigate the possible role of ZFAS1 in ribosome function, we treated breast cancer cells with the translation elongation inhibitors puromycin and cy-cloheximide. Puromycin induced a significant increase of ZFAS1 abundance in MB-231, HeLa and MDA-MB-468 cells (Additional file 7: Figure S6), but no sig-nificant differences in the abundance ofZFAS1following treatment with cycloheximide were detected (Additional file 8: Figure S7). These results suggest that inhibiting ri-bosomes at specific sites in certain cell lines induces the accumulation ofZFAS1.
Discussion
Zfas1 was discovered as a lncRNA that is differentially expressed during mouse mammary gland development with the highest level detected during pregnancy [15]. Many antisense lncRNAs regulate the associated protein coding genes in cis. The lack of correlation between ZFAS1andZNFX1 expression indicates that there is no apparent cis regulation between them, and provides a basis for seeking alternative ZFAS1 activities. In this study, we have shown thatZFAS1is expressed in all cell lines tested, although the abundance varies between cell lines.ZFAS1expression is not correlated with that of its protein coding counterpart, ZNFX1 (Fig. 1b). Analysis of TCGA data indicated that ZFAS1 expression was not reduced in breast cancers in general (Additional file 2: Figure S2A i), but suggested that particular subtypes (basal, HER2-positive) show reduced expres-sion (Additional file 2: Figure S2A ii, iii).
Studies in hepatocellular carcinoma and colorectal cancer have found that ZFAS1is more highly expressed in these cancers as compared to normal tissues [25, 26], and that higher expression of ZFAS1 is associated with tumour metastasis and poor patient prognosis. It has been hypothesised that ZFAS1 acts as a miRNA sponge [25, 26]. However, we found no correlation between ZFAS1 and previously described miRNA tar-get genes [25, 26] in breast cancer according to TCGA data (analysis not shown).
In our current studies, ZFAS1 was localised to both the cytoplasm and nucleus in a non-isoform specific manner (Fig. 2c and d), as with our previous study of mouse mammary epithelial cells [15], in which only one isoform was detected. Whether different isoforms in hu-man have different functions remains to be elucidated.
Significant findings arising from this study are that ZFAS1 isoforms are associated with ribosomes (Fig. 3) and are bound to the small 40S subunit (Fig. 4). Many lncRNAs appear to be ribosome-associated [9, 10]. We found that cytoplasmicZFAS1is associated with actively translating ribosomes, with light polysomes showing the greatest concentration of ZFAS1. This suggests that ZFAS1 is associated with only a small proportion of ribosomes at any given time. Ribosomes exhibit het-erogeneous composition, which is thought to evince diverse functionality [27]. The widespread association of lncRNAs with ribosomes contributes to this het-erogeneity and may reflect possible mechanisms for regulating ribosome function.
Microarray data from mouse mammary glands at dif-ferent stages of development have shown that ZFAS1 and genes encoding several ribosomal proteins show similar changes in expression level during pregnancy and lactation (Table 1, Additional file 3: Figure S3). These transcripts for ribosomal proteins, likeZFAS1,do not exhibit appreciable differences in expression be-tween human breast cancer and normal breast tissue samples. They do, however, exhibit stronger correlations withZFAS1in normal tissue compared to breast cancer tissue. This may be a reflection of deregulated ribosome function and synthesis that occurs in neoplastic cells [28]. Interestingly, the respective ribosomal proteins have been found to participate in ribosome synthesis as regulators of ribosomal structure [29, 32, 33] and in for-mation of mature rRNA [30, 31]. Induction of ribosome biogenesis, confirmed by the increased expression of 45S, also induced expression of ZFAS1 (Fig. 5). These findings suggest that ZFAS1 may be involved in early stages of ribosome induction or production.
ZFAS1is host to three C/D box snoRNAs which target rRNA for post-transcriptional modification. snoRNAs are often located within the introns of protein-coding genes, many of which have functions in ribosome bio-genesis and/or translation [34]. Additionally, at least one of the five ZFAS1 isoforms contains a 5’TOP motif. 5’TOP function is manifested by selective unloading of mRNAs from polysomes during repression of the cell cycle, or recruitment to polysomes during cell prolifera-tion or refeeding of starved cells [35]. It is possible that lncRNAs with similar motifs also engage in regulatory activities with ribosomes [22].
cell lines during serum starvation (MDA-MB-231, 8701BC, HEK293) and with puromycin treatment (MDA-MB-468, HeLa, MDA-MB-231), but not with cyclohexi-mide treatment (Additional file 6: Figure S5; Additional file 7: Figure S6 and Additional file 8: Figure S7). Serum starvation causes global ribosomal inhibition, whereas cy-cloheximide and puromycin target the ribosome at differ-ent sites inhibiting elongation of polypeptide synthesis [37, 38], and premature chain release and subsequent dis-sociation of ribosomes [39] respectively. Such alternative mechanisms may explain why these drugs have different effects onZFAS1abundance, as the dissociation of riboso-mal subunits may be required to releaseZFAS1. Our data suggest that theGAS5andZFAS1transcripts function dif-ferently in cells despite their similarity in structural motifs. We sought to identify the possible functions ofZFAS1 through shRNA knockdown. We were able to achieve 40 and 50% knockdown using different shRNAs (BC1 and BC2), and observed that upon reduced expression of ZFAS1, phosphorylation of RPS6 decreased (Fig. 6b). RPS6 is a component of the 40S small subunit, and undergoes phosphorylation induced by anabolic signals. The molecular mechanisms underlying the diverse ef-fects of RPS6 phosphorylation on cellular and organis-mal physiology are still poorly understood [22].
RPS6 is thought to regulate translation, proliferation and cell size, but we did not observe appreciable dif-ferences in ZFAS1 knockdown cells (Additional file 5: Figure S4). However, S6 kinases, responsible for RPS6 phosphorylation, have been implicated as regulators of ribosome biogenesis factors [39]. RPS6 also has dis-tinct functions in the cytoplasm and nucleus. In the cytoplasm, phosphorylation of RPS6 promotes transla-tion of specific transcripts [40], whereas in the nu-cleus it binds to the pre-rRNA after transcription as part of the small subunit processome for generation of mature 18S [41, 42]. Knockdown of ZFAS1 may interfere with this ribosome biogenesis programme reflected in reduced phosphorylation and abundance of RPS6.
Knockdown ofZFAS1abolishes increases in 45S abun-dance after ribosome induction through serum refeeding after prior starvation compared to scrambled control siRNAs (Fig. 6c). This supports a role of ZFAS1in ribo-some biogenesis and may suggest that ZFAS1 functions to promote 45S transcription or processing. However, serum starvation affects a plethora of responses, and ZFAS1may modulate several divergent pathways.
We have shown thatZFAS1binds to ribosomes and in particular, the small 40S subunit. We propose a novel function for this lncRNA, in which it is translocated to the cytoplasm while still associated with the small ribo-somal subunit. We suggest thatZFAS1may not regulate translation directly, but instead regulate ribosome
production and assembly, which adds another layer of complexity to ribosome regulation and function.
The description of ribosome processing and synthesis in humans has lagged far behind that of budding yeast, due to the questionable assumption that these processes are phylogenetically conserved. Studies in yeast experi-mental systems may have limited applicability to mam-malian systems as ribosome biogenesis trends towards increased evolutionary complexity [43].
A large number of lncRNAs associate with ribosomes and may act as possible ribosomal regulators [9–11]. Add-itionally, multiple ribosomal factors often perform redun-dant tasks, so investigating the function of a specific lncRNA by knockdown may not exhibit an appreciable ef-fect as it may be compensated by similarly redundant lncRNAs and will require complementary approaches.
Conclusions
We propose a novel role for lncRNAs in which they as-sociate with ribosomes and regulate their function. The majority of lncRNAs exhibit low stoichiometry and the association of each lncRNA with highly abundant somes may confer fine tuning and selectivity upon ribo-some function or synthesis. Our lncRNA of interest, ZFAS1 is induced upon ribosome biogenesis, suggesting a role in synthesis or assembly of ribosomes. ZFAS1 knockdown decreases RPS6 phosphorylation and ribo-some biogenesis induction, suggesting thatZFAS1, in its association with the 40S subunit, may not regulate trans-lation directly and instead may be involved in ribosome production and assembly.
Methods Cell culture
Cells were sourced and cultured as described previ-ously [44].
RNA extraction, reverse transcription, qPCR and PCR
RNA extraction has been described previously [15]. Briefly, total RNA from cultured cells was purified using Trizol (Life Technologies). To remove genomic DNA, total RNA was treated with DNAse I for 30 min at 37 °C followed by incubation at 75 °C for 10 min to deactivate DNAse I. To assess the quality and yield of RNA, absorb-ance at 260, 280 and 230 nm was measured with a Nano-drop 1000 spectrophotometer. The ratios of optical density at 260/230 and 260/280 nm were≥1.8 in all cases.
For non-quantitative analysis, cDNA was diluted 1:20 and PCR-amplified for 30 cycles in a PCR thermocycler (95 °C for 5 min, followed by 30 cycles of 95 °C for 30 s, 60 °C for 30 s, 72 °C for 1 min/kb, followed by 72 °C for 5 min). For PCR of exon 1, Kapa Hifi Taq was used ac-cording to the manufacturer’s instructions with a touch down procedure [45] (98 °C for 5 min, followed by 10 cy-cles of 98 °C for 20 s, 75 °C for 15 s and 72 °C for 30 s in which annealing temperature was decreased by 1 °C each cycle). After this, PCR products were amplified by 30 cycles of 98 °C for 20 s, 65 °C for 15 s and 72 °C for 30 s). Products were visualised on a 2% agarose gel stained with ethidium bromide. The list of primer se-quences is provided in Additional file 9: Table S2, and the sizes of products were estimated by running a 1 kb ladder alongside the PCR products.
For quantitative PCR, a 1:20 dilution of cDNA was used to measure the abundance of all transcripts studied here except for the 18S and 28S rRNAs. In the latter cases, 1:1000 dilutions were used. Reactions contained SYBR Green PCR master mix (Applied Biosystems), and primers were diluted to 8μM. Cycling conditions are de-tailed in ref [15]. For all qPCR data, experiments were performed three times as biological replicates.
5′Rapid Amplification of cDNA Ends (RACE)
RNA derived from MDA-MB-468 was converted into cDNA as described above and tailed with poly G using terminal transferase according to the manufacturer’s de-scription (New England Bio labs, Cat. No. M0315S). PCR was performed as described above using primers AN polyC + E2R2 for 10 cycles with an annealing temperature of 65 °C, after which 1μL of the PCR reac-tion was used as the template for a subsequent PCR using AN F and E2R1 primers for 30 cycles at an anneal-ing temperature of 65 °C. PCR samples were purified and ligated into pGEMT Easy Vector and cloned into E.colicells. Colonies positive for the insert were selected and used as a template for PCR with M13 Forward and M13 Reverse primers. Those PCR samples which dem-onstrated the presence of the insert were then selected for sequencing.
Subcellular fractionation
Three 175 cm2 flasks of 468 or MDA-MB-231 cells were grown to 80% confluency then trypsi-nised, and the cells pelleted at 110 g for 5 min. The cell pellet was washed with ice-cold phosphate-buffered sa-line (PBS), and pelleted again. The pellet was then resus-pended in 5 mL ice-cold fractionation hypotonic lysis buffer (10 mM HEPES pH 8.0, 1.5 mM MgCl2, 10 mM KCl, 0.5 mM DTT, 1x protease inhibitor (Sigma Aldrich cat no. P8340) and incubated on ice for 5 min. Cells were then lysed with 20 strokes of a Dounce homogeniser
using a tight pestle. The lysate was centrifuged at 228 x g for 5 min at 4 °C.
The supernatant was retained as the cytoplasmic frac-tion. Total cytoplasmic RNA was extracted from this fraction using Trizol. The pellet was resuspended in 3 mL of 0.25 M sucrose containing 10 mM MgCl2, and the extract layered over 3 mL 0.88 M sucrose, 0.5 mM MgCl2followed by centrifugation at 2800 x g for 10 min at 4 °C. The supernatant was discarded and the pellet was designated the nuclear fraction, which was then sus-pended in 1 mL Trizol for RNA isolation. Experiments were performed twice for biological replicates.
Polysome analysis
Polysome fractionation was performed with minor modi-fications as described in ref [46]. In detail, twelve 175 cm2flasks of MDA-MB-468 breast cancer cells were grown to 80% confluency then incubated with cyclohexi-mide (100 μg/mL) in PBS for 15 min at 37 °C before harvesting by trypsinisation and centrifugation at 110 g for 5 min. The cell pellet was resuspended in 2 mL poly-some lysis buffer (20 mM HEPES pH 7.4, 15 mM MgCl2, 200 mM KCl, 1% Triton X-100 (v/v), 100 μg/mL cyclo-heximide, 2 mM DTT, 1 mg/mL heparin) and lysed with 20 strokes of a dounce homogeniser using a tight pestle. Lysate was cleared by centrifugation at 14,000 x g for 5 min at 4 °C. Cleared cell lysate was layered upon 7–47% (w/v) sucrose gradients, prepared as described in ref [47] in 50 mM NH4Cl, 50 mM Tris–HCl pH 7.0 and 12 mM MgCl2in polyallomer tubes (Beckman) and loaded into a SureSpin™ 630 rotor and centrifuged in a Sorvall Ultracentrifuge at 100,000 x g for 4 h at 4 °C. After centrifugation, gradients were fractionated by securing the ultracentrifuge tube in a clamp stand and piercing the bot-tom of the tube with a 21G needle. Drops of the sucrose gradients flowed at a consistent rate (approximately 300μL per fraction) into the wells of a 96 well plate, and absorbance measured at 260 nm using a Nanodrop 1000 spectrophotometer. RNA from every third fraction was purified using Trizol according to the manufacturer’s in-structions and used as a template for cDNA synthesis.
For polysome release experiments, the above protocol was followed, except that MgCl2was not present in the lysis buffer or the sucrose gradient, and was replaced with 15 mM EDTA. Both experiments were performed twice to provide biological replicates.
Ribosome subunit separation
RNAse inhibitor (Roche, cat no 03335 399001). Cells were lysed with 20 strokes of a Dounce homogeniser and cell lysate was cleared by centrifugation at 12000 x g for 20 min. One-tenth of the volume of 10% w/v sodium deoxycholate was then added to release ribo-somes from microsomal membranes. Cleared cell lys-ate was layered on a 50 mL 1 M sucrose cushion in 50 mM Tris–HCl pH 7.5, 5 mM MgCl2, 100 mM KCl, 10 mM 2-mercaptoethanol and centrifuged for 16 h at 100,000 x g in a JA-30.50Ti ultracentrifuge rotor (Beckman Coulter). Supernatant was removed, and the ribosome pellet was resuspended in 1 mL ribosome buffer (5 mM Tris HCl pH 7.5, 1.5 mM MgCl2, 50 mM KCl, 10 mM 2-mercaptoethanol). KCl and puromycin were added to the ribosome suspension to final concentrations of 0.5 M and 1 mM respectively, then incubated on ice for 30 min, followed by incubation at 37 °C for 15 min. The ribosome suspension was clarified by centrifugation for 5 min at 10,000 × g.
The cleared ribosome suspension was then layered on a 15–30% sucrose gradient in 5 mM Tris–HCl pH 7.5, 5 mM MgCl2, 0.5 M KCl, 10 mM 2-mercaptoethanol, then centrifuged at 30,000 x rpm in a SureSpin™ 630 rotor for 14 h. Samples were collected as detailed in
‘Polysome analysis’.
Induction of ribosome biogenesis
MDA-MB-468 cells were plated in T25 flasks at 60% confluency. Medium was aspirated, cells washed twice with PBS, and cells cultured with 0.5% FCS-containing medium for 48 h. After 48 h, 10% FCS-containing medium was added for a further 48 h.
Knockdown ofZFAS1
shRNA constructs to knock down ZFAS1 and control empty plasmid (vector) were purchased from GeneCo-poeia. Breast cancer cells (MDA-MB-468) were grown to 80% confluency in 6 well plates and were transfected with 4μg or 5 μg of DNA using Lipofectamine 3000 in accordance with the manufacturer’s instructions. Trans-fected cells were selected as described in ref [44].
Cell proliferation assay
To measure cellular proliferation, the sulforhodamine B colorimetric assay was used, which measures total cellu-lar protein to measure cell density. MDA-MB-468 cells containing constructs for ZFAS1 shRNA and scrambled shRNA were seeded in 96 well plates at 1500, 3000, 6000 cells per well and processed as described in ref [44] to compare differences in cell growth. Experiments were performed twice for biological replicates.
Cell size measurement
MDA-MB-468 cells were grown in T25 flasks at 70-80 confluency. Adherent cells were trypsinised resuspend in 1 mL of PBS and diluted 100x in saline. Cells were counted and the size distribution determined using a Coulter Particle Count and Size Analyser (Beckman Coulter model Z2).
Measurement of nascent protein synthesis
Synthesis of nascent polypeptides was measured using Click-iT® Metabolic Labelling with L-azidohomoalanine (AHA) (ThermoFisher). Cells were plated in 96 well plates as technical duplicates at 30,000 cells per well to achieve 70–80% confluency. Cells were washed with warm PBS, and the medium replaced with methionine free DMEM + 10% FCS and incubated at 37 °C for 1 h to deplete methionine reserves. Cells were further incu-bated with 40μM of Click-iT® AHA at 37 °C for 1 h in the dark. Cells were then washed in PBS, fixed with 4% paraformaldehyde in PBS for 15 min, and permeabilised with 0.25% Triton® X-100 for 15 min, after which cells were washed in 3% (w/v) BSA in PBS. Cells were then ready for the detection reaction with alkyne tagged de-tection molecule. For this, cells were incubated in the dark with 10 mM TBS, 1 mM CuSO4, 100 mM sodium ascorbate and 10μM Alexa Fluor®647 alkyne for 30 min. Nascent protein synthesis was determined by the fluor-escence of Alexa 647 using a BD FACS Vantage Cytometer.
Western blot
Cells were lysed in buffer containing 60 mM Tris–HCl, pH 6.8, 2% (w/v) SDS, and 20% (v/v) glycerol, and pro-tein quantitated by BCA assay. Cell lysates containing 25 μg of protein were separated by SDS-PAGE, and transferred to PVDF membranes (Millipore). Mem-branes were immunoblotted with antibodies against phospho-S6 ribosomal protein (Ser240/244) (Cell Signal-ling Cat. No. 2215) (1:1000 for anti-phospho RPS6), total RPS6 (Cell Signalling Cat. No. 2217) and β-actin (1:5000) (Sigma). Protein bound primary antibody was subsequently incubated with respective secondary anti-body prior to membrane exposure to SuperSignal West Pico (Thermo Scientific) for β -actin or ECL plus for phospho-RPS6 (Thermo Scientific). Resulting bands were detected using chemiluminescence detection system (Fujifilm Las-3000).
Statistical analysis
Growth arrest and inhibition of translation
Cells were cultured in media containing 0.5% fetal calf serum, grown to 70-80% confluency and then washed twice with PBS and RNA collected by Trizol extraction at 0, 24, 48, 72 h after medium replacement. For inhib-ition of translation experiments, cells were treated with 20 μg/mL of cycloheximide or 50μg/mL of puromycin for 0 to 16 h. Cells were collected and RNA extracted and processed as described above, for cDNA synthesis and qPCR.
Random selection of genes
Genes were randomly selected from Homo Sapien data set using Random Gene Set Generator from http://www.molbiotools.com/.
Reviewers’comments
Reviewer’s report 1: Christine Vande Velde, Department of Neurosciences, University of Montreal
Reviewer summary
This manuscript demonstrates a novel role for a long noncoding RNa (lncRNA) called ZFAS1. The authors es-tablish the validity of the previously made claim that ZFAS1 is, in fact, a lncRNA, ie. there is no peptide produced. The authors present clear evidence that five different isoforms exist and, despite prediction that different isoforms might exhibit different sub-cellular localization, there is no difference between them with regards to their nucleocytoplasmic distri-bution. Hansji and colleagues also present good quality data which indicates that, like some other lncRNAs, ZFAS1 is associated with polysomes. Add-itional data demonstrate that it is the small riboso-mal subunit and the association of ZFAS1 to this subunit can be triggered by growth arrest and inhib-ition of translation (via puromycin treatment). Lastly, it is demonstrated that siRNA-mediated knockdown of ZFAS1 reduces phosphorylation of the ribosomal protein RPS6 and reduces 45S rRNA, indicating that ZFAS1 is important for ribosome biogenesis. Overall, the quality of the individual ex-periments is high and each is well controlled. The interpretation of the data is accurate, with minimal/ no overstatements.
Reviewer comments
Given that the authors describe five different isoforms, I was surprised to see them largely ignored after Fig. 2. Thus, in Figs. 3, 4, 5 and 6, it appears that only a single isoform has been examined. Moreover, it is unclear which isoform(s) has been followed (ie. Which primer pair was used in these figures?). This information should be explicitly stated.
Authors’ response: Primer pairs for qPCR have been specified in the Fig. 1a legend [1], and cover 4 of the 5 isoforms, so representing the majority of ZFAS1 isoforms. Primers are restated in Fig. 3 legend.
The same primer set was used for ribosome gradients, as stated in the legend of Fig. 4. To address the issue of particular isoforms being excluded from consideration, we have attached Additional file 10: Figure S8 to demon-strate different isoforms ofZFAS1in ribosome gradients using primers that cover 4 of the 5 isoforms (Primer set E1F3-E5R1).
Reviewer comments
In addition, it is unclear which isoform(s) is targeted by the siRNAs used to demonstrate effect of ZFAS1 on 45S and rpS6. (That only 1 of the 4 siRNAs gave a robust knockdown could indicate that there is differential role for the various isoforms in this process.)
Authors’response: All siRNAs targeted exon 5, which is common for all isoforms, as depicted in Additional file 11: Figure S9. The shRNA should therefore target all isoforms. shRNA sequences targeting ZFAS1 are in-cluded in the Additional file 12: Table S3.
Reviewer comments
Also, for the sake of completeness, the authors may con-sider evaluating the presence of the different isoforms in the 40S containing fractions.
Authors’ response: The presence of different isoforms has been evaluated using primer set E1F3-E5R1 as added in Fig. 4a (iii). ZFAS1 isoforms are located with the 40S subunit extract in a non-isoform specific manner.
Reviewer comments
The authors have focused on breast cancer cell lines, due to previous data linking ZFAS1 to mammary gland tissue development, and a previous report of decreased ZFAS1 in invasive ductal breast carcinoma in humans. The authors report here that the expression of a number of ribosomal protein genes correlates with ZFAS1 ex-pression during mammary gland development. However, here ZFAS1 was not found to be significantly different in breast cancer patients compared to healthy controls. Despite this, there was a positive correlation between ZFAS1 expression and a number of these ribosomal pro-tein genes. Authors suggest this discrepancy is due to sample size differences.
hand, TCGA data are not derived from necessarily matched-normal samples, and the stromal tissue was in-cluded in expression analysis. The correlation of the ribo-somal protein genes is strong, also due to large sample size (n = 1043 for breast cancer samples, n = 113 for nor-mal breast tissue samples).
However, analyses on different breast cancer subtypes, depicted in Additional file 2: Figure S2A(ii), show that ZFAS1is expressed more highly in normal tissues com-pared to basal and HER2 breast cancer subtypes. It is also more highly expressed in ER+ compared to ER-subtypes (Additional file 2: Figure S2A(iii)). As only 5 samples were measured [1], samples having these char-acteristics may have been disproportionally represented compared to TCGA samples.
The role of ZFAS1 as a potential tumour suppressor gene may not be apparent in its expression in all sam-ples in TCGA, but may be reflected in patient survival. Additional file 2: Figure S2B displays a Kaplan-Meier plot generated from http://www.oncolnc.org/ of TCGA breast cancer data set. High expressers are those 50% of patients with the highestZFAS1expression, and low ex-pressers are those 50% of patients with the lowestZFAS1 expression. High expressers of ZFAS1 display increased survival up to 6000 days, which could be an indicative of higher expression ofZFAS1in normal samples, although the difference is not significant.
In the microarray data presented previously we have observed differential expression of Zfas1and ribosomal proteins during normal mammary gland development in mouse. RNA samples derived for microarray analysis were mainly isolated epithelial cells of the developing glands (see methods in [1]). In TCGA data we did not see any differential expression among these genes (Additional file 3: Figure S3), however the differences were oberved in breast cancer sybtypes compared to normal (Additional file 2: Figure S2). Various patterns of expression observed for these proteins in different subtypes compares to normal. In mouse mammary gland we have see similar pattern of expression for and the ribosomal proteins and Zfas1 which are con-sistance with some of breast cancer data derived from TCGA. The two systems examinded in these papers are identical in both species therefore some discri-pency observed in normal mammary gland develop-ment and human breast cancer is not unexpected.
Reviewer comments
minor comments
The connection between the breast cancer cell line analysis and the role for ZFAS1 in ribosome biogenesis becomes evident only on page 15, with the comment that “deregulated ribosome function and synthesis oc-curs in neoplastic cells.” Could be helpful to highlight
this earlier so that links between breast cancer work and ribosomal work are evident early on.
Authors’ response: We have added sentences intro-ducing the role of ribosomes in cancer progression in Introduction section, page 3 lines 50-52, page 5-6 lines 106-115.
We have introduced our hypothesis implicating ribo-some production in the background (page 3, line 50-52). Our serum starvation data also showed the link between ZFAS1and ribosome (Figs. 5 and 6f ).
Reviewer comments
Comments that total rpS6 is unchanged by ZFAS1 shRNA is not well supported by the representative image provided (Fig. 6e):
Authors’ response: Western blot has been repeated. While total RPS6 does show a decrease in knockdown cells compared to scrambled shRNA (28%), it is less sig-nificant than the down regulation of phospho RPS6 com-pared to scrambled shRNA (35%). We have added Additional file 8: Figure S7 that shows the three bio-logical replicates of the experiment.
Reviewer comments
Discussion should be shortened and kept close to the data at hand (it starts to ramble on page 17/18). Also, I would suggest that the authors modify the last few sen-tences describing what they will do/are doing for the next studies of ZFAS1.
These details are not needed and could be presented in a more generalized way. Abstract and Conclusion lacks any information related to the breast cancer angle of the story. Frequently the “.” comes before the refer-ences. This should be corrected. (ie. it should be like this [1]. not like this. [1])
Authors’response:Discussion has been shortened. References have been corrected.
Reviewer’s report 2: Nicola Aceto, Department of Biomedicine, University of Basel
Reviewer’s summary
to ZFAS1 expression in normal breast cells versus breast cancer cells should also be addressed in greater detail.
Reviewer comments
(1) Figure 1b: in the text the authors claim that there is
“trend of higher expression of ZFAS1 in normal breast cells”, compared to cancer cell lines. Since they only analyze two normal cell lines (one of them having very similar levels of ZFAS1 as compared to cancer cells), they should avoid indicating that there is a trend. Since no statistical significance is reached comparing ZFAS1 expression in normal versus cancer cells, I would suggest them not to overinterpret the data in this case.
Authors’response:This has been removed.
Reviewer comments
(2) Figure 1b: can the authors exclude (experimentally) that the difference in expression of ZFAS1 and ZNFX1 is due to different primer efficiency? It would be more convincing to test at least two independent primer sets for each gene, as well as to validate the primers in con-trolled conditions (e.g. in a setting where ZFAS1/ZNFX1 are downregulated and/or overexpressed).
Authors’ response: Primer efficiency of ZNFX1 reac-tions is included in Additional file 13: Figure S10A and B. Primer efficiency is the same as for ZFAS1, indicating that differences in expression level are unlikely to be con-tributed by the rate of amplification.
A second set of primers to investigate ZFAS1 and ZNFX1expression has also been designed to ensure dif-ferent expression is not due to primers. Expression of ZFAS1and ZNFX1 has been evaluated in breast epithe-lial and breast cancer cell lines using these new sets of primers showing nearly identical patterns of expression. Correlations of qPCR results using the original and new primers is also shown in Additional file 13: Figure S10C.
The expression of ZFAS1 and ZNFX1 are shown in Fig. 6a whenZFAS1is downregulated by shRNA.
Reviewer comments
Also why is it important to determine the relative ex-pression difference between ZFAS1 and ZNFX1?
Authors’ response: The function of lncRNA in cis has been shown in many cases (reviewed in [2]); therefore it is important to determine the relative expression of ZFAS1 and ZNFX1 in the same cells. Antisense lncRNAs are known to regulate the expression of their protein cod-ing counterparts (actcod-ing in cis) and we wanted to deter-mine if this was the case for ZFAS1 [3]. Discrepancy in expression level and lack of correlation suggest that they are not co-regulated and ZFAS1 does not regulate ZNFX1. Additionally, lncRNAs often show low expres-sion, so the high expression of ZFAS1 is surprising and
potentially functionally important in constitutive pro-cesses within the cell such as ribosome biogenesis.
Reviewer comments
(3) The TCGA analysis showed no difference in ZFAS1 expression between breast cancer and normal breast tis-sue. How do the authors interpret this discrepancy with previous results (Askarian-Amiri et al., RNA, 2011)? And how do they motivate their interest in elucidating ZFAS1 biology in the context of normal breast vs breast cancer cells? The rationale for studying ZFAS1 needs to be better explained, in light of the TCGA results.
Authors’response: See above comments in response to reviewer 1.
The gene expression in stromal cells in the micro-environment may have masked the level of gene expres-sion of breast cancer cells.
Since developmental genes are often involved in cancer progression, and our observation of significant down-regulation ofZfas1from pregnancy to lactation suggested important developmental roles, we believe that pursuing the function ofZFAS1in human and investigating its role in cancer would be challenging but worthwhile.
Reviewer comments
(4) Figure 5: the authors conclude that ZFAS1 increases during ribosome biogenesis. However, induction of ZFAS1 and 45S rRNA could be serum-induced, yet func-tionally disconnected events. Since the stimulation with 10% serum has an impact on a wide variety of signaling pathways (many of which not directly connected to ribo-some biogenesis), the authors should at least discuss the possible limitations of this particular experiment.
Authors’response:This has been addressed in the dis-cussion, page 17 (page 18, line 441-442). However, the use of the ZFAS1 shRNA BC2 to suppress ZFAS1 abun-dance did appear to limit the induction of 45S rRNA fol-lowing serum refeeding (Fig. 6f ) and one interpretation of this effect is that there are mechanistic connections be-tween the ZFAS1 and ribosomal responses.
Reviewer comments
(5) Figure 6e: Difference in p-rpS6 is not striking, and would deserve band quantification and at least n= 3 to determine whether or not statistically sound. Also, the authors should include a second shRNA (e.g. BC1) to exclude that their results are due to off-target effects of BC2 shRNA sequence.
We have repeated the western blot analysis in three bio-logical replicate and performed semi-quantification of the results. We have shown a 35% reduction in phospho-RPS6 as shown in Additional file 8: Figure S7. We also included second ZFAS1 shRNA BC3 to exclude the possiblilty of false positive result.
Reviewer comments
(6) Figure 6b: here too, the authors should include a sec-ond shRNA in their experiment.
Authors’response:SRB assay to measure cell prolifera-tion was repeated, using scrambled shRNA, BC2 and a second ZFAS1 shRNA BC3. This is shown below, with no significant difference in cellular proliferation observed (Additional file 5: Figure S4).
(7) Given that BC2 sequence enables a 50% knock-down of ZFAS1, wouldn’t the authors expect only a par-tial blockage of 45S rRNA synthesis in their cells upon expression of BC2?
Yes, blockage of 45S synthesis would be lethal.ZFAS1 down-regulation may decrease the amount of 45S pro-duced, as shown by lack of induction of 45S upon serum refeeding as shown in Fig. 6f.
minor comments:
Figure 6: the authors refer to ZFAS1 shRNA in two different ways: in panels C-D-E as“ZFAS1 shRNA”, and in panel F as“BC2 knockdown shRNA”. Authors should instead use“ZFAS1 shRNA”throughout the text.
Authors’response:This has been changed.
Reviewer report 3: Haruhiko Siomi, Department of Molecular Biology, Keio University
Reviewer’s summary
In sum, results shown in the manuscript are not well connected with each other and are preliminary.
Reviewer comments
Major comments: Recent studies have shown that a large portion of our genome is transcribed to produce a number of long non-coding RNAs (lncRNAs). However, the functionality of only a small number of these lncRNAs has been demonstrated. This manuscript con-tinues the Askarian-Amiri lab’s analysis of Zfas1, a lncRNA that is abundantly expressed in mouse mam-mary glands. The authors here characterize Zfas1 in hu-man cells. Their analyses reveal that Zfas1 transcripts may be associated with ribosomes in the cytoplasm. The authors show that Zfas1 may also affect both expression levels of several mRNAs encoding ribosomal proteins and phosphorylation levels of rpS6. These results may suggest a model in which Zfas1 might be involved in ribosome biogenesis through a hitherto unknown mech-anism. Major comments: 1. The first parts of this paper (Figs. 1 and 2) mostly repeat data already published by
the authors (Askarian-Amiri et al., RNA 2011) though, the authors characterize the human homolog of Zfas1 here. The results shown in Figs. 3, 4, 5 and 6 are to a large extent difficult to understand. It is often unclear what the underlying reasoning is. I simply have a hard time to follow the logic of these analyses. It seems as if the authors just wanted to show what they find with Zfas1 with no clear interpretation.
Authors’response:Figure 1a is an image derived from the UCSC browser in [1] and current manuscript, though panel B has not been reported previously. We used three cell lines in our previous article [1]. However, to establish the connection between ZFAS1 and ZNFX1 in this manuscript, we have examined their expression in 21 cell lines and the results presented here confirmed that there was no correlation between the expression of these two genes.
In our previous paper [1] the relative abundance of al-ternate isoforms ofZFAS1in various human tissues and cell lines, based on exon-exon junction spanning deep sequence tags, was indicated in Fig. 5c ([1]). In this paper we confirm the existence of at least 5 isoforms in breast cancer cell lines tested.
Figures 3, 4, 5 and 6
Figure 3. Experiments were performed to isolate ZFAS1 and the molecules or supramolecular complexes with which it might be associated. For this purpose we used sucrose gradients and identifiedZFAS1in 80S-light polysome fractions (Fig. 3a). To confirm the association of ZFAS1 with ribosomes we treated the lysate with EDTA and loaded it on the gradient. To clarify the shift of peaks upon EDTA treatment, we have changed the scale of the Y-axis in the revised manuscript, confirming a clear difference between panels C and D in Fig. 3.
In Fig. 4, we identified the ribosomal subunit associ-ated with ZFAS1. Also the ratios of ZFAS1 to 18S and 28SrRNA in different cell lines were calculated.
Figure 5 confirms that upon 45S induction, ZFAS1 is also induced in the system as explained in page 12 of the manuscript (refer to the section ‘ZFAS1 increases during ribosome biogenesis’, page 12 of the manuscript).
Figure 6. We have performed shRNA knockdown in MDA-MB-468 breast cancer cells to examine the pheno-type arising from gene manipulation. Results showed that there was no difference in cell proliferation, cell size and de novo protein synthesis. However the level of RPS6 phosphorylation is reduced in knockdown cells. Also we have seen same pattern of gene expression for 45S rRNA in cells transfected with scrambled shRNA (Fig. 6f, left panel) as observed for non-transfected cells (Fig. 5) and this pattern was not detected in shRNA transfected cells (Fig. 6f, right panel).
with ribosomes (page 8-10). We have tested the associ-ation ofZFAS1with ribosomes following EDTA treatment and ribosomal subunit dissociation (page 10-11). This confirmedZFAS1association with the small subunit. We have shown how ZFAS1and 45Sare co-regulated during ribosomal biogenesis (page 11-12). Following that we used shRNA to knockdown ZFAS1. Although we did not find any change in growth rate or globalde novoprotein syn-thesis, we showed that cells with reducedZFAS1 content cannot upregulate 45S as observed for non- transfected cells, or cells transfected with scrambled shRNA. We also showed RPS6 phosphorylation is reduced in knockdown cells (page 12-13).
Reviewer comments
For example, the authors state in page 9 that “ZFAS1 is associated with actively translating ribosomes (Fig. 3a).” However, the majority of ZFAS1 cosedimented with 80S but not with polysomes.
Authors’ response: qPCR analysis of ribosomal frac-tions shows that ZFAS1 is associated with 80S mono-somes and (predominantly) light polymono-somes, with low association with heavy polysomes (Fig. 3c). We have deleted the “suggesting that ZFAS1 is associated with actively translating ribosome” and added light poly-somes instead of polypoly-somes in the same sentence.
Reviewer comments
In addition, the distribution profiles of Zfas1 on sucrose density gradients with/without EDTA (Fig. 3a and b) ap-pear very similar each other, suggesting that Zfas1 is not associated with ribosomes.
Authors’response:To clarify the difference in distribu-tion of ZFAS1 in those gradients we have performed qPCR of ZFAS1 in all samples. Depiction of EDTA-containing gradients with an expanded y-axis scale shows marked re-distribution from the polysomes to the dissociated ribosomes (Fig. 3d).
Reviewer comments
Figure 4 shows that ZFAS1 is more concentrated in 40S fractions (fraction 22) than in 60S fractions (fraction 34). However, we aren’t assured that fraction 5 or 45, for ex-ample, may contain Zfas1 as much as does fraction 22.
Authors’ response: The graphs in Additional file 14: Figure S11 show ZFAS1 expression in fractions derived from the gradient. 18S rRNA is distributed mainly near the top half of the gradient, with 28S distributed near the bottom half. Peaks corresponding to the 40S and 60S subunits are highlighted in red. ZFAS1 is mainly expressed in those fractions corresponding with the 18S (Additional file 14: Figure S11).
Reviewer comments
2. Although the authors demonstrated that transfection with the control and Zfas1 shRNA did not result in sig-nificant differences in cell size or global protein synthesis (Fig. 6), they found that knockdown of Zfas1 decreases the phosphorylation level of rpS6. Phosphorylation of the protein normally promotes protein synthesis. How would they interpret these results? Does overexpression of Zfas1 increase the phosphorylation level of rpS6?
Authors’response:Here we tested de novo protein syn-thesis. The role of RPS6 in protein synthesis has not been fully resolved, with the exact function of its phosphory-lated form still a matter of debate [4]. However, RPS6 has been found to act in the nucleus as a regulator of ribosome biogenesis and its reduced phosphorylation fol-lowing ZFAS1 knockdown may reflect this. The observed change in phospho-RPS6 content may also reflect its nu-clear function [4]. ZFAS1 is highly expressed gene, we are not sure overexpression of it can manifest the real effect or would be artifact.
Reviewer comments
The authors also found that Zfas1 knockdown cells dis-played no significant change in 45S rRNA abundance after serum starvation or refeeding, though the abun-dance of 45S rRNA increased 3-fold in controls 48 h after the reintroduction of normal media (refeeding). This suggests that Zfas1 may play role in induction of 45S rRNA. The authors shall consider examining pro-cessing and maturation of 45S rRNA because Zfas1 is present in the nucleus as well.
Authors’response:Ribosome biogenesis may well include processing and maturation of precursor rRNA transcripts. We fully acknowledge the potential importance of these processses and are currently performing more experiments to consider the suggested functions. Also in this manuscript we have mainly focused on cytoplasmic ZFAS1.
1. Askarian-Amiri ME, Crawford J, French JD, Smart CE, Smith MA, Clark MB, Ru K, Mercer TR, Thompson ER, Lakhani SR et al: SNORD-host RNA Zfas1 is a regulator of mammary development and a potential marker for breast cancer.RNA2011,17(5):878-891.
2. Guil S, Esteller M: Cis-acting noncoding RNAs: friends and foes.Nat Struct Mol Biol2012,19 (11):1068-1075.
3. Villegas VE, Zaphiropoulos PG: Neighboring gene regulation by antisense long non-coding RNAs. Int J Mol Sci2015,16(2):3251-3266.
4. Meyuhas O: Chapter 1 Physiological Roles of Ribosomal Protein S6: One of Its Kind. In: Inter-national Review of Cell and Molecular Biology.vol. Vol-ume 268: Academic Press; 2008: 1-37.