RESEARCH
Spatial and temporal variation
in positioning probability of acoustic telemetry
arrays: fine-scale variability and complex
interactions
Thomas R. Binder
1*, Christopher M. Holbrook
2, Todd A. Hayden
1and Charles C. Krueger
3Abstract
Background: As popularity of positional acoustic telemetry systems increases, so does the need to better under-stand how they perform in real-world applications, where variation in performance can bias study conclusions. Stud-ies assessing variability in positional telemetry system performance have focused primarily on position accuracy, or comparing performance inside and outside the array. Here, we explored spatial and temporal variation in positioning probability within a 140-receiver Vemco Positioning System (VPS) array used to monitor lake trout, Salvelinus namay-cush, spawning behavior over 23 km2 in Lake Huron, North America.
Methods: Variability in VPS positioning probability was assessed between August and November from 2012 to 2014 using 43 stationary transmitters distributed throughout the array. Various analyses were used to relate positioning probability to number of fish transmitters in the array, wave height, and thermal stratification. We also assessed the prevalence of ‘close proximity detection interference’ (CPDI) in our array by analyzing detection probability of 35 trans-mitters on collocated receivers.
Results: Positioning probability of the VPS array varied greatly over time and space. Number of fish transmitters present in the array was a significant driver of reduced positioning probability, especially during lake trout spawning period when the fish were aggregated. Relationships between positioning probability and environmental variables were complex and varied over small spatial and temporal scales. One possible confounding variable was the large range of water depth over which receivers were deployed. Another confounding factor was the high prevalence of CPDI, which decreased exponentially with water depth and was less evident when wave heights were higher than normal.
Conclusions: Some variables that negatively influenced positioning can be minimized through careful planning (e.g., number of tagged fish released, transmitter power level). However, results suggested that the acoustic environ-ment was highly variable over small spatial and temporal scales in response to complex interactions between many variables. Therefore, models that predict positioning or detection efficiencies as a function of environmental variables may not be attainable in most systems. The best defense against biased study conclusions is incorporation of in situ measures of system performance that allow for retrospective analysis of array performance after a study is completed. Keywords: Vemco Positioning System, Positional telemetry, Performance, Detection probability, Close proximity detection interference, Thermal stratification, Wave height, Signal code collision
© 2016 Binder et al. This article is distributed under the terms of the Creative Commons Attribution 4.0 International License (http://creativecommons.org/licenses/by/4.0/), which permits unrestricted use, distribution, and reproduction in any medium, provided you give appropriate credit to the original author(s) and the source, provide a link to the Creative Commons license, and indicate if changes were made. The Creative Commons Public Domain Dedication waiver (http://creativecommons.org/ publicdomain/zero/1.0/) applies to the data made available in this article, unless otherwise stated.
Open Access
*Correspondence: [email protected]
Background
Recent advances in aquatic animal telemetry technolo-gies now provide researchers with an unprecedented ability to track animal movements at fine spatial and temporal scales, and answer behavioral and ecological questions that were previously beyond reach. One such advancement that has become increasingly popular over the last decade is use of telemetry systems to estimate two-dimensional (2D) or even three-dimensional (3D) positions of transmitter-implanted animals using time difference of arrival (TDOA) of acoustic transmissions at three or more acoustic receivers [1–4]. 2D and 3D tracks from aquatic animals have been used to study behaviors ranging from broad spatial habitat use and home ranges [4–7] to swimming speed [2, 8] and fine-scale responses to environmental stimuli [9, 10]. A variety of position-ing systems exist, each with its own set of strengths and weaknesses, but they can be generally reduced to two categories: (1) cabled systems that use a single receiver with multiple hydrophones tethered with cables and (2) non-cabled systems that use multiple independent receivers, each with a single independent hydrophone. Cabled systems tend to be limited in size and location of deployments due to need for long cables between each hydrophone and receiver [3]. Non-cabled systems offer more flexibility with respect to array size and are better suited for remote locations [1, 11]. However, position processing with non-cabled systems is more complicated than with cabled systems because of the need to account for differences between receiver clocks, which drift over time due to effects of temperature and subtle manufac-turing differences. Nonetheless, non-cabled systems have become increasingly popular due to ease of deployment and flexibility to accommodate project designs and large study areas.
Similar to the presence/absence telemetry systems that provide coarse-scale behavioral data, positional telem-etry systems are subject to performance variability [12], which can complicate interpretation of animal tracks and possibly bias study conclusions [8, 13]. Studies describ-ing variation in detection probability of presence/absence telemetry systems are abundant (reviewed in [12, 14]), but perhaps due to the relative novelty of positional telemetry and also possibly a disconnect between the end user (researcher) and the position estimation pro-cess, few papers have assessed spatial and temporal per-formance variability of positional telemetry systems [11,
15–18]. The primary focus of most positional telemetry performance studies has been position accuracy. Position accuracy has been well established as largely a function of the geometry of receivers relative to transmitters [1,
11, 17, 19–21] and varies little in comparison with posi-tioning probability (i.e., the probability that a position
was estimated by the array for a given transmission, [16,
18]). Less is known about the effects of environmental variables (e.g., thermal stratification and waves) or more complex processes, such as destructive code collisions or the so-called close proximity detection interference (i.e., detection interference as a result of transmission echoes being heard by nearby receivers; hereafter, CPDI; [22]), on positioning probabilities. Nonetheless, because the absence of evidence (i.e., positions) in telemetry studies is not necessarily evidence of absence [13], understanding variation in positioning probability is critical to interpret-ing study results.
Transmitter detections are the basis of position estima-tion; therefore, positioning probability should be influ-enced by many of the same variables that drive variability in detection probability in presence/absence telemetry systems (e.g., environmental noise, aquatic vegetation, biofouling; [13, 23, 24]). However, the issue of position-ing probability in telemetry systems is complicated by the fact that the contribution of a given receiver to posi-tion estimates depends not only on the performance of that receiver, but also on the performance of receivers around it. Moreover, because questions addressed with positional telemetry arrays are often limited to finer spatial and temporal scales than those addressed with the presence/absence systems, studies that use position-ing systems may be more sensitive to biases resultposition-ing from variability in performance [8, 11], particularly if the measured response variable is based on the number of positions returned by the system.
In this study, we assessed spatial and temporal variabil-ity in positioning probabilvariabil-ity of a large acoustic telemetry positioning system (Vemco Positioning System; hereafter VPS, Vemco Inc., Halifax, NS Canada) over three con-secutive seasonal deployments. At the time of writing, this positional telemetry array was the largest ever con-structed, consisting of 140 autonomous receivers and 43 stationary transmitters with a spatial coverage of approx-imately 23 km2. Our specific objectives were: (1) to quan-tify the degree of spatial (<0.5 km2) and temporal (6 h) variation in positioning probability that occurred over three seasonal deployments between 2012 and 2014 and (2) to determine whether variation in positioning proba-bility could be predicted by environmental variables (e.g., surface waves and water temperature) and other site-spe-cific variables such as signal code collisions and CPDI.
Methods
Study site and the Vemco Positioning System
Lake Huron, North America. The array, which consisted of 140 VR2W-69 kHz autonomous receivers (Vemco Inc.; Halifax, NS Canada) and 43 stationary V16-6H transmit-ters (Vemco Inc.; Halifax, NS Canada), covered an area of approximately 23 km2 and was deployed for between 87 and 100 days each year from August to November, 2012– 2014. Stationary transmitters (hereafter, ‘sync tags’) with known locations were deployed primarily to synchronize clocks among receivers and secondarily to evaluate array performance. Each sync tag transmitted a unique ID code every 500–700 s (nominal delay = 600 s), with each time between transmissions (delay) being drawn from a uni-form distribution. The site encompassed several shoal and reef areas with complex bathymetric features (Fig. 1) and depths ranging from ~2 m to over 38 m. Vertical tempera-ture profiles in the study site were monitored using two lines of four temperature loggers (HOBO Water Temp Pro v2; model U22-001; Onset Computer Corporation, Bourne MA) that measured temperature to a resolution of 0.02 °C, with an accuracy of ±0.21 °C. A weather buoy (Tidas 900 buoy; S2 Yachts, Holland MI) was also moored within the array. The buoy logged air temperature, surface water temperature, wind speed and direction, and wave
height and direction every 5 min for the duration of the study.
At the end of each study season, receivers were retrieved and downloaded, and data files were sent to Vemco for processing using their proprietary hyperbolic positioning algorithms [25]. Position estimates of trans-mitters were based on TDOA of each transmission at a minimum of three and a maximum of six (limit set by manufacturer) receivers with synchronized clocks. When a transmission was detected on more than six receiv-ers, positions were estimated using data from the first six receivers that detected a transmission based on lin-ear time-corrected detections. Hypothetically, the first six receivers that detected a transmission should rep-resent the six closest receivers to the transmitter, but in practice that may not be true because of nonlinear drift of receiver clocks. The VPS returned a weight-averaged position among all combinations of three receivers that detected each transmission, as well as position precision estimates (horizontal position error; abbreviated ‘HPE’) that described the relative error sensitivity of each calcu-lated position [25].
Spatial and temporal variability in positioning probability
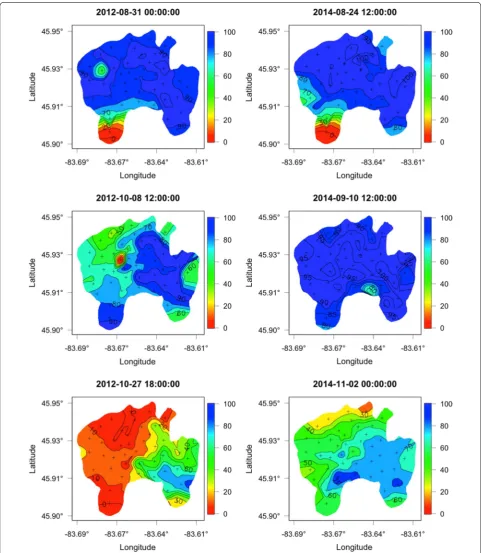
Spatial and temporal variation in VPS array performance in each study year was assessed using positioning prob-ability of 43 stationary sync tags distributed throughout the array (Fig. 1). Temporal variation in array perfor-mance was estimated by comparing perforperfor-mance metrics across 6-h time bins. Use of 6-h bins represented a com-promise between having enough transmissions (36 on average) to accurately estimate a positioning probability and being a short enough time interval to reflect envi-ronmental variability at an ecologically relevant scale. Probability of positioning each transmitter during each 6-h bin was calculated based on the ratio of observed to expected positions (6 positions h−1 × 6 h = 36 posi-tions expected). Subsequently, for each 6-h time bin, we used 2D cubic spline interpolation (R package ‘akima’; [26]) to estimate and visualize variation in positioning performance across the array. Mean array positioning probability during each 6-h bin was calculated from the 2D interpolations by taking the mean of all interpolated data points (spatial resolution of the interpolations was approximately 34 m2). Mean positioning probability of the transmitters themselves was not used because trans-mitters were not equally spaced in the array, which meant some transmitters (particularly in the deep, less complex areas of the array) represented a greater area of the array than others. Due the random nature of sync tag transmis-sions (i.e., uniform distribution between 500 and 700 s), positioning probability estimates based on the mean of 36 transmissions per 6-h bin were subject to random
error. Simulated transmission histories for 10,000 sync tags revealed a range of 34–37 transmissions during a single 6-h period, indicating a maximum of 6 % random error in our positioning probability estimates.
A generalized linear mixed-effect model with binomial error distribution (R Package ‘lme4’; [27]) was used to model within- and between-sync tag variation in posi-tioning probability against variables that could affect detection of acoustic transmitters. Fixed effects in the model included the number of unique fish transmitters within detection range of the closest receiver (‘Unique-Fish’), wave height measured at the within-array weather buoy (‘WaveHt’), and degree of thermal stratification in the water column (i.e., difference between near-surface and near-substrate temperature in the array, as measured by HOBO temperature logger lines; ‘DiffTemp’), as well as their interactions. Sync tag site ID was included as a ran-dom effect to account for inherent differences in position-ing probability related to location of each transmitter in the array.
The mixed-effect model revealed complex interactions between variables, so rather than attempting to build a global model to describe variation in positioning prob-ability of our sync tags, we fit separate logistic regres-sion models (R Package ‘stats’; [28]) for each transmitter site and examined spatial and temporal patterns in effect size (i.e., parameter estimates from logistic regressions) of three fixed-effect variables (i.e., UniqueFish, WaveHt, and DiffTemp). Preliminary inspection of the data sug-gested that the relative influence of the variable Unique-Fish on variation in array performance changed markedly between the lake trout pre-spawning and spawning peri-ods, and therefore, the two time periods were analyzed separately. Spawning period start dates were the same as were used previously at this site by Binder et al. [29], who used changepoint analysis to determine when male lake trout implanted with pressure-sensing transmitters moved from deep offshore water onto the shallow-water spawning shoals. During each time period, parameter estimates were inspected for obvious trends by map-ping them on bathymetry. We then tested for significant relationships between parameter estimates and trans-mitter depth using linear regression (R Package ‘stats’). Where scatter plots revealed a nonlinear relationship, segmented regression (i.e., broken-stick regression; R Package ‘segmented’; [30]) was used in place of linear regression. Comparisons between pre-spawning and spawning period parameter estimates were made using paired t tests (R Package ‘stats’).
Close proximity detection interference
CPDI is a phenomenon in acoustic telemetry whereby transmission sequences of a transmitter located in
relative close proximity to a receiver are interrupted by strong echoes off reflective surfaces [22], in essence, causing the signal to collide with itself, and thus, not be properly decoded and logged on that receiver. We searched for evidence of CPDI in our array using data from 35 sync tags with collocated receivers (i.e., a receiver on the same mooring as the transmitter; Fig. 1). Prevalence of CPDI in our array was described by cal-culating the detection probability of each transmitter on collocated receivers during each 6-h bin. As with posi-tioning probability, detection probability was calculated as the ratio of observed detections to expected detec-tions (36 expected detecdetec-tions per 6-h time bin). Inter-pretation of inter-site variability in detection probability was complicated by spatial variation in detection prob-ability related to varying local environmental conditions (e.g., number of fish transmitters within detection range of a receiver). To account for this variation, we stand-ardized detection probabilities on collocated receivers to that on the non-collocated receiver with maximum detection probability for each transmitter. The new response variable, ‘relative detection probability,’ was the ratio of detection probability at the collocated receiver and detection probability for that transmitter at the non-collocated receiver (i.e., receiver not on the same mooring as the transmitter) with maximum detection probability. The relationship between relative detection probability of transmitters and water depth was mod-eled using nonlinear, least squares regression (R Package ‘stats’).
Results
Temporal and spatial variability in positioning probability
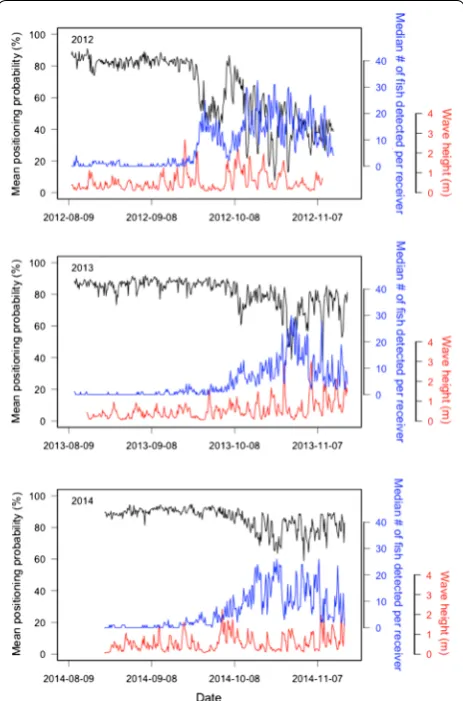
Clear seasonal trends were evident in all three years, with better performance in August and September than in October and November (Fig. 2). Within the array, a great deal of spatial variation occurred in positioning probability. Within some 6-h time periods, position-ing probability of sync tags in some parts of the array was perfect (or near-perfect), while in other parts of the array, it was zero (Fig. 3). In general, positioning prob-ability was poorer on the west side of the array (where the main lake trout spawning sites were located) than the east side of the array, particularly in the autumn during the lake trout spawning period. Nonetheless, all sync tags displayed perfect positioning probability during at least some periods, suggesting that spatial patterns were not a result of irregularities in array design (e.g., geometry, specific receiver locations).
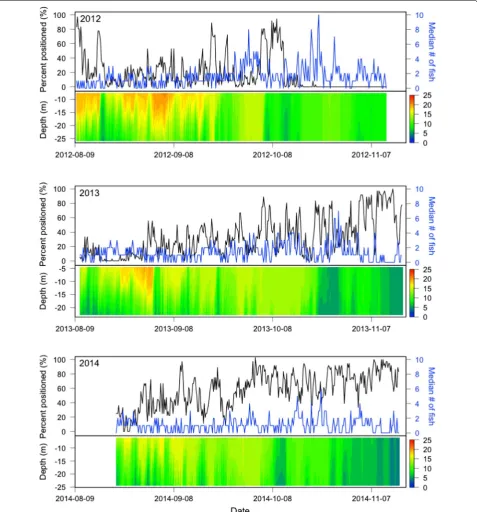
Interestingly, positioning probability at some of the deeper receivers on the southwest side of the array (in particular S003; southernmost transmitter on the west side of array) consistently differed from other transmit-ter sites in the array. During the August dates, when mean whole-array positioning probability was relatively high, positioning probability at these sites was generally low (often less than 30 % of transmissions positioned; Fig. 3). Conversely, during the October and November dates when mean whole-array performance decreased, positioning probability at these sites tended to improve (see Additional file 1). Poor performance of these south-west receivers during summer months appeared to be related to thermal stratification in the water column, with positioning probability, particularly at site S003 (Fig. 1), improving during brief periods when little thermal strati-fication occurred in the array (Fig. 4). The negative rela-tionship between positioning performance and thermal stratification was also evident in among-year compari-sons, where performance at site S003 was greater in 2014, the year with the least thermal stratification, than in the previous 2 years (Fig. 4). Toward the end of each year when the thermal structure in the array became more homogenous, variation in positioning performance at this site was more closely related to the number of tagged fish within detection range of the site (Fig. 4).
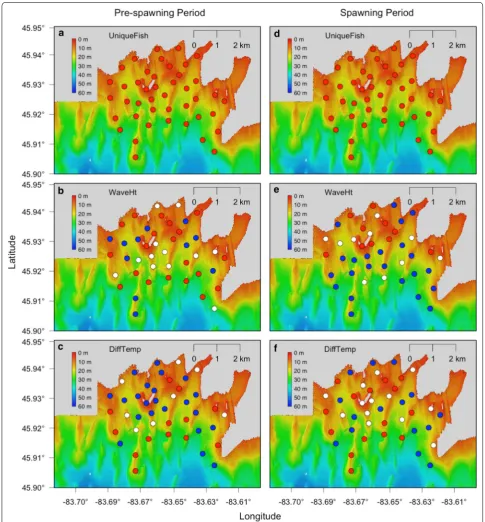
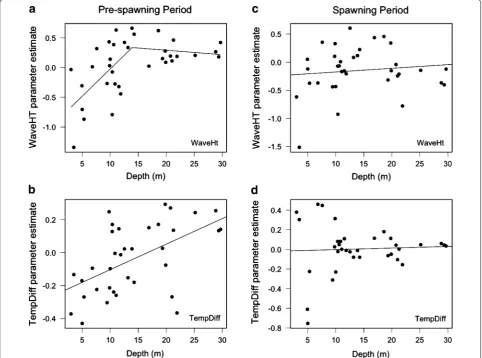
Attempts to develop a meaningful global model relating sync tag positioning probability to local environmental variables such as number of tagged fish present (Unique-Fish), wave height (WaveHt), and thermal stratification (TempDiff) revealed complex relationships and interac-tions that proved impossible to satisfactorily model using the predictor variables available. As expected, positioning performance was negatively correlated with the number of fish present within detection range across all receiv-ers during both pre-spawning and spawning periods (Fig. 5a, d). However, relationships between positioning probability and both wave height and thermal stratifica-tion were site-specific. For example, at some sites posi-tioning probability was negatively correlated with wave height, while at others a positive correlation occurred between positioning probability and wave height (Fig. 5b, e). Similar relationships were observed when comparing positioning probability against degree of thermal strati-fication (Fig. 5c, f). Moreover, at several sites, direction of observed relationships was reversed during the pre-spawning and pre-spawning periods.
A portion of the inter-receiver variability in relation-ships between environmental conditions and positioning performance was related to the wide range of depths over which our array was deployed. However, relationships between parameter estimates (i.e., estimates of effect size) from transmitter-specific logistic regressions and
depth of the transmitter were not always linear and dif-fered between pre-spawning and spawning periods. Dur-ing the pre-spawnDur-ing period, when few fish were present in the array (Fig. 2), WaveHt parameter estimates (i.e.,
relationship between WaveHt and positioning probabil-ity) were generally negative for shallow transmitters and positive for deep transmitters (Fig. 6a). A segmented regression indicated a positive relationship between
WaveHt parameter estimate and transmitter depth (seg-mented regression; t = 3.351, df = 31, p = 0.002) down to
approximately 13.9 ± 2.4 m, after which WaveHt
param-eter estimates remained relatively consistent across depth
(segmented regression; t = −0.359, df = 31, p = 0.722).
with negative parameter estimates predominant at shal-low depths and positive parameter estimates predomi-nant at deeper depths (Fig. 6b). In contrast, during the spawning period, neither WaveHt (linear regression; t = 0.673, df = 33, p = 0.506) nor TempDiff (linear regression; t = 0.283, df = 33, p = 0.779) parameter esti-mates were significantly correlated with transmitter depth (Fig. 6c, d).
Some of the discrepancy between the pre-spawning and spawning period is likely due to the fact that the presence of lake trout transmitters within the array (‘UniqueFish’) had a far greater influence on positioning probability dur-ing the spawndur-ing period (when far more fish were pre-sent in the array) than during the pre-spawning period. UniqueFish parameter estimates were negative during both pre-spawning and spawning period (i.e., relation-ship between UniqueFish and positioning probability was
always negative) and did not vary with transmitter depth (linear regression; pre-spawning: t = 1.471, df = 33, p = 0.151; spawning: t = −0.865, df = 33, p = 0.393). Nonetheless, UniqueFish parameter estimates were on average 2.47 (±1.33) times greater during the spawning period than during the pre-spawning period (paired t test; t = 7.344, df = 34, p < 0.001), indicating a greater negative relationship with positioning probability during the spawning period than non-spawning period. In fact, number of fish present in the array appeared to be a pre-dominant factor driving whole-array positioning prob-ability during the spawning period (Fig. 2).
Close proximity detection interference
One possible confounding factor in our analysis of posi-tioning probability was CPDI [22]. Thirty-five of 43 sync tags in our array were collocated with an acoustic
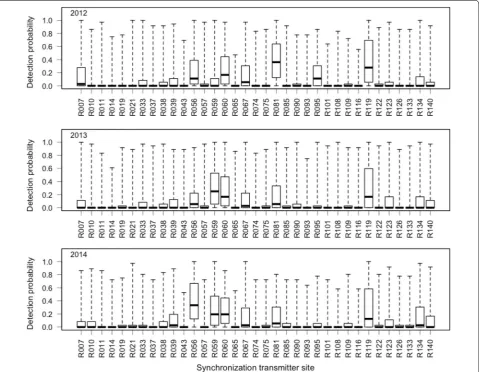
receiver. Examination of detection probability of sync tags on collocated receivers revealed that this phenom-enon was widespread in our array (Fig. 7). Collocated receivers never detected sync tags as well as other nearby surrounding receivers with line of sight to the transmitter (i.e., maximum detection probability for a given transmit-ter always occurred on a non-collocated receiver). Mean maximum detection probability for each transmitter on nearby non-collocated receivers ranged from 0.67 to 0.91. In contrast, mean detection probability on collocated receivers averaged only 12 % of maximum detection probability, ranging from 0.01 to 0.37 over the 3 years of study.
A high degree of intra-annual variability occurred in detection probability of transmitters on collocated receivers, both within and between sites (Fig. 7). How-ever, mean relative detection probability of individual
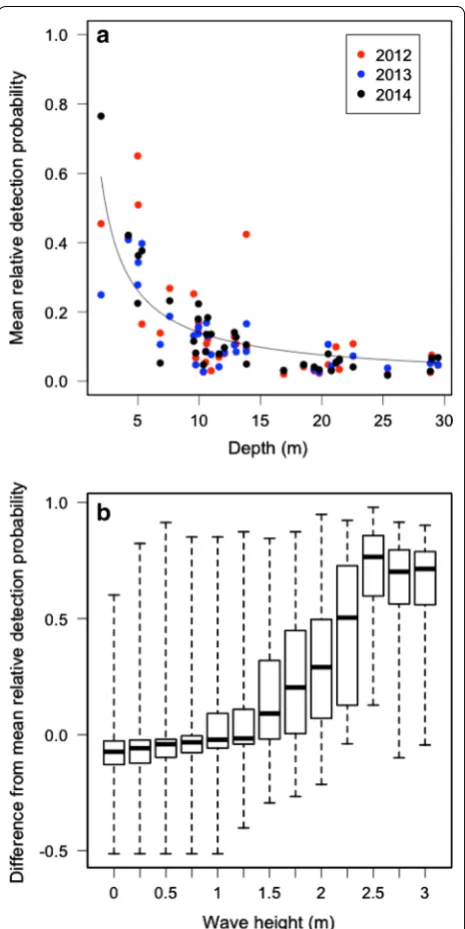
collocated transmitters was strongly correlated across all three years (Pearson’s r = 0.78, 0.75, and 0.85 for 2012 vs. 2013, 2012 vs. 2014, and 2013 vs. 2014, respec-tively, p < 0.001 for all comparisons), which suggests that CPDI was location-specific and probably related to physical characteristics of the immediate environment that changed little over time (i.e., lake bottom compo-sition and topography). Inter-site variation in mean relative detection probability was related negatively to water depth at the site and was best approximated with a decreasing exponential curve (relative detection probability = 1.098 × depth−0.892, p < 0.001 for both parameters; Fig. 8a), indicating that CPDI increased exponentially with increased water depth.
Within-site variability in relative detection probabil-ity of transmitters on collocated receivers was related to wave height (linear mixed-effect model, t = 144.432,
df = 36,010, p < 0.001; Fig. 8b). In general, mean relative detection probability of collocated transmitters was lower than average when wave height was less than approxi-mately 1.25 m and greater than average when wave height was greater than 1.25 m (Fig. 8b). No significant relation-ship existed between maximum detection probability and wave height (linear mixed-effect model, t = −1.021, df = 36,010, p = 0.307), so the above relationship was not an artifact of decreased maximum detection probability at higher wave heights; mean maximum detection proba-bility of sync tags was greater than or equal to 0.77 (range 0.77–0.89) at all wave heights.
Discussion
Substantial spatial and temporal variability occurred in positioning probability of sync tags in our positional telemetry array. While spatial variation in positioning probability has been noted in other studies [15, 16], most studies have focused on receiver geometry and ignored temporal variability [16–18]. This trend may be due to the fact that most assessment studies were short in dura-tion [1, 15, 17], or used positional arrays with relatively small spatial coverage [1, 11, 15, 18]. The long duration, high environmental complexity, and large spatial extent of our VPS deployment provided a unique opportunity to explore and quantify within-array variability in posi-tioning probability. Some of the variability we observed could be explained by variables we measured in the field, but much of it could not, which highlights the complex nature of acoustics in natural systems. Some of the nega-tive relationships we observed could be controlled (e.g., number of tagged fish in the array; transmitter power level), or at the least minimized by careful planning and study design.
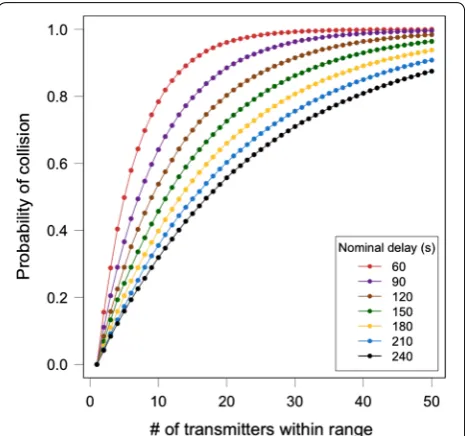
Signal code collisions resulting from large numbers of fish transmitters in the array at the same time were a significant cause of decreased positioning probability in our system, particularly during the spawning period when they were the main driver of variation in array performance. A signal code collision occurs when trans-missions from two or more transmitters are detected simultaneously on the same receiver [31], preventing the receiver from properly decoding either signal. Probability of code collisions is a function of the number of trans-mitters within range of a receiver, the duration of the code signal, and the period between transmissions [23]. The duration of a transmission, and thus the degree of susceptibility of a positioning system to signal code col-lisions, is dependent on the coding scheme used, which varies by manufacturer. With Vemco’s current coding scheme, the transmission duration is relatively long (up
Fig. 8 a Relationship between mean relative detection probability of sync tags on collocated receivers and water depth at each loca-tion. Data were normalized to the receiver with maximum detection probability for each transmitter. Individual points were color-coded by year. Data were best approximated with a declining exponential curve (relative detection probability = 1.098 × Depth−0.892). b
to ~5 s; [32]); therefore, depending on the nominal delay of the transmitters (i.e., period between successive trans-missions), the probability of collisions can be quite high at relatively low transmitter densities (see Fig. 9).
Signal code collisions have a high potential for creating spatial and temporal bias in telemetry studies because the presence of the study animals themselves alters the per-formance of the telemetry system. Therefore, investiga-tors should assess the potential for, and implications of, signal code collisions (particularly if they are expected to be heterogeneously distributed) both during the study design stage and while interpreting results. In our case, the high prevalence of signal collisions in our system during the spawning period was due to several factors, including: (1) underestimation of lake trout annual mor-tality rate and spawning site fidelity [29], which caused high numbers of transmitters to return to the system during each year of the study (390 tagged trout released between 2010 and 2011), (2) high levels of aggregation at relatively few spawning site locations [33], and (3) use of high-powered tags (V16-6H, 158 dB, 90 s nomi-nal delay), which at times had detection ranges of several kilometers. Based on our experience, we recommend adopting a conservative approach in study designs when determining how many transmitters to release in a study,
particularly if researchers are new to a study site, or the behavioral ecology of the animal is not well understood.
As has been observed in other positional telemetry studies [16, 18], positioning probability of sync tags at our site was influenced by environmental variability. However, relationships between environmental vari-ables and positioning probability in our array were loca-tion- and time-specific. Steel et al. [18] reported variation in the relative influence of environmental parameters on positioning probability across three study systems (coastal, estuarine, and riverine), but our results indi-cated that this variation can occur over relatively small spatial scales. Our observations have important implica-tions for acoustic telemetry studies in general. First, fine-scale variation in response to environmental variables indicated that the nature of these relationships was com-plex. Therefore, while general rules of thumb regarding the effect of certain environmental variables on telemetry system performance may be evident, development of a universally applicable predictive model [34] using easy-to-measure variables is likely beyond reach prior to con-ducting a study. Second, because acoustic properties can vary over small distances, true optimization of an acous-tic telemetry system at some sites may require fine-scale range testing and development of spatially heterogeneous array designs (e.g., differential receiver spacing across an array).
Water depth played an important role in the perfor-mance of our VPS array, particularly with respect to how the system responded to changes in wave height and thermal stratification. In general, shallow transmitters tended to be negatively affected by increased wave height and thermal stratification, while deeper transmitters often saw a boost in positioning probability under the same conditions. As far as we are aware, ours is the first study to report a positive relationship between position-ing probability and wave height or thermal stratification; however, we are doubtful that the increase in positioning probability is directly related to these variables. Rather, because both of these variables tend to reduce the dis-tance over which an acoustic transmitter is detected [23,
35], we hypothesize that the positive relationships are due to reduced transmission echoes and a consequent reduction in CPDI [22], which was most pronounced in deep water. This interpretation was supported by the observation that detection probability of transmitters on collocated receivers increased as wave heights increased. Interestingly, depth effects were only observed during the pre-spawning period. We attribute this to a masking effect by signal code collisions, which were more preva-lent during the spawning period than during the pre-spawning period.
The high incidence of CPDI in our VPS array was likely due to the combined effect of our use of high-powered transmitters and a highly reflective acoustic environ-ment [22] in which substrate was dominated by the hard surfaces of cobble, boulders, and bedrock. Although evidence of CPDI occurred for all collocated receiver/ transmitter pairs, the prevalence of CPDI increased exponentially with receiver depth, a characteristic we attributed to an exponential decline in ambient noise from surface sources (e.g., wind and waves). Preva-lence of CPDI is dependent on the coding scheme [21,
22, 32] and, therefore, is likely to vary among telemetry systems. Thus, researchers should assess the potential for this phenomenon when designing their study and choose transmitter specifications and receiver place-ments that minimize the effect with the equipment they plan to use. Without sufficient receiver overlap (i.e., redundancy), CPDI can create areas of low detection/ position probability in receiver arrays and curtains [22]. Moreover, CPDI also has the potential to reduce accu-racy of positions returned from VPS arrays. The reason for this inaccuracy is that position estimation will depend on detections at receivers that are further away from the transmitter, which could result in poor receiver geom-etry, imprecise signal arrival time estimates, and conse-quently higher horizontal position error [1, 18].
Receiver memory saturation (which caused raw log files to be overwritten by detection data) late in 2012 caused a drastic decrease in whole-array positioning probability. At the time, no mechanism was in place to flag this issue during either receiver download or position processing, and because it occurred during the peak of lake trout spawning, poor array performance was assumed to be due to signal code collisions. Indeed, it was not until we started work on this manuscript that the memory issue was identified, which highlights the need for research-ers to take responsibility for quality checking results returned to them from positioning software. At a mini-mum, we recommend researchers create visual displays (e.g., graphs or maps, e.g., Fig. 4) for assessing positioning performance over space and time. Unexplained changes in performance should be investigated thoroughly to rule out equipment failure or processing errors. Early assess-ment of positioning performance, especially if assessed from a pilot study, may also provide an opportunity to correct deficiencies in array design. For example, poor positioning probability on the southwest side of our array during summer (top panels in Fig. 3) was likely due to the fact that transmissions on top of the reef had to transmit through the thermocline to reach surrounding receivers. Had we identified this issue in 2012, changes could have been made to the array (e.g., addition of more receivers
or placing current receivers higher in the water column) to improve performance in subsequent years.
Conclusions
The acoustic telemetry community is constantly expand-ing as new researchers adopt these technologies in their studies. Therefore, identification and discussion of issues related to study design and data interpretation is valu-able to the community because it helps to improve the overall quality of data coming out of acoustic telemetry studies, as well as their interpretation. Positional acoustic telemetry, and more specifically VPS, is a relatively new technique for tracking movements of aquatic animals; thus, a need exists to better understand how these sys-tems perform in real-world applications. Only a few pub-lished papers are available describing spatial or temporal variation in VPS performance, fewer still while the VPS system was used to track animals, and none that have spanned the spatial scale and range of environmental conditions that occurred in our study. Some of the vari-ables we identified as negatively influencing positioning probability (e.g., signal code collisions) can be minimized through careful planning, but our results also suggest that the acoustic environment can be highly variable over relatively small spatial and temporal scales, which if unac-counted for, have the potential to bias study conclusions.
At complex study sites (e.g., sites with highly variable depth, substrate types, or water chemistry), fine-scale range testing may allow researchers to optimize receiver array design; however, we acknowledge that such intense pre-study testing is rarely practical. In most cases, the best defense against making biased study conclusions due to spatial and temporal changes in system performance will be to incorporate methods for measuring that vari-ability into the study design. For most, that will involve deploying stationary transmitters throughout the study site for the duration of the study, with the number and location of these transmitters depending on the questions being addressed and the complexity of the study site. At a minimum, this approach will allow researchers to interpret results in the context of array performance. In some cases, results may be standardized by incorporating measures of system performance variability into analyses, either through use of correction factors [36], or through development of sophisticated statistical analyses that explicitly correct parameter estimates based on imperfect detection and positioning probabilities [37, 38].
Availability of supporting data
Data availability is subject to data sharing policies cur-rently under development by GLATOS, the Great Lakes Fishery Commission, and the United States Geological Survey.
Authors’ contributions
TRB led all aspects of study design, executed the field portion of the study, and drafted the manuscript. TAH, CMH, and CCK participated in the design of the study, provided consultation on statistical analyses, and helped to draft the manuscript. All authors read and approved the final manuscript.
Author details
1 Center for Systems Integration and Sustainability, Department of Fisheries and Wildlife, Michigan State University, Hammond Bay Biological Station, 11188 Ray Rd., Millersburg, MI 49759, USA. 2 U.S. Geological Survey, Great Lakes Science Center, Hammond Bay Biological Station, 11188 Ray Rd., Millersburg, MI 49759, USA. 3 Center for Systems Integration and Sustainability, Depart-ment of Fisheries and Wildlife, Michigan State University, 1405 South Harrison Road, 115 Manly Miles Building, East Lansing, MI 48823, USA.
Acknowledgements
Thanks to F. Smith, S. Smedbol, A. Hillard, and J. MacAulay for processing the positions and for their helpful comments on the manuscript. Thanks also to R. Bergstedt, H. Thompson, E. Larson, C. Wright, J. Van Effen, M. Lancewicz, L. Lesmeister, D. Operhall, B. Lamoreux, S. Farha, Z. Wickert, J. Osga, Z. Holmes, S. Miehls, S. Seegert, J. Hinderer, R. Darnton, K. Smith, and P. Wigren for their assistance in the field and to P. Barbeaux, M. Ebener, R. Reining, A. Handziak, and D. Pine for their assistance in procuring lake trout for tagging. This work was funded by the Great Lakes Fishery Commission by way of Great Lakes Restoration Initiative appropriations (GL-00E23010-3). This paper is contribu-tion number 20 of the Great Lakes Acoustic Telemetry Observacontribu-tion System (GLATOS) and contribution number 2012 of the USGS Great Lakes Science Center. Any use of trade, product, or firm names is for descriptive purposes only and does not imply endorsement by the U.S. Government.
Competing interests
The authors declare that they have no competing interests.
Received: 16 November 2015 Accepted: 11 January 2016
References
1. Espinoza M, Farrugia TJ, Webber DM, Smith F, Lowe CG. Testing a new acoustic telemetry technique to quantify long-term, fine-scale move-ments of aquatic animals. Fish Res. 2011;108:364–71.
2. Rillahan C, Chambers M, Howell WH, Watson WH III. A self-contained system for observing and quantifying the behavior of Atlantic cod, Gadus morhua, in an offshore aquaculture cage. Aquaculture. 2009;293:49–56. 3. Cooke SJ, Niezgoda GH, Hanson KC, Suski CD, Phelan FJS, Tinline R, Philipp
DP. Use of CDMA acoustic telemetry to document 3-D positions of fish: relevance to the design and monitoring of aquatic protected areas. Mar Technol Soc J. 2005;39:17–27.
Additional files
Additional file 1. Video showing spatial and temporal variation in posi-tioning performance of a 140-receiver Vemco Posiposi-tioning System (VPS) array over three lake trout spawning seasons. Estimates of positioning probability were interpolated based on performance of 43 stationary tags (indicated by + symbol) scattered throughout the array.
Additional file 2. R script for estimating, based on simulation, the proba-biliity of a signal code collision based on the nominal delay, transmission duration, and number of tags within detection range of a receiver.
4. Andrews KS, Tolimieri N, Williams GD, Samhouri JF, Harvey CJ, Levin PS. Comparison of fine-scale acoustic monitoring systems using home range size of a demersal fish. Mar Biol. 2011;158:2377–87.
5. Coates JH, Hovel KA, Butler JL, Klimley AP, Morgan SG. Movement and home range of pink abalone Haliotis corrugate: implications for restora-tion and popularestora-tion recovery. Mar Ecol Prog Ser. 2013;486:189–201. 6. Espinoza M, Farrugia TJ, Lowe CG. Habitat use, movements and site
fidelity of the gray smooth-hound shark (Mustelus californicus Gill 1863) in a newly restored southern California estuary. J Exp Mar Biol Ecol. 2011;401:63–74.
7. Reubens JT, Pasotti F, Degraer S, Vincx M. Residency, site fidelity and habi-tat use of Atlantic cod (Gadus morhua) at an offshore wind farm using acoustic telemetry. Mar Environ Res. 2013;90:128–35.
8. Løkkeborg S, Fernö A, Jørgensen T. Effect of position-fixing interval on estimated swimming speed and movement pattern of fish tracked with a stationary positioning system. Hydrobiologia. 2002;483:259–64. 9. McMahan MD, Brady DC, Cowan DF, Grabowski JH, Sherwood GD. Using
acoustic telemetry to observe the effects of a groundfish predator (Atlan-tic cod, Gadus morhua) on movement of the American lobster (Homarus americanus). Can J Fish Aquat Sci. 2013;70:1625–34.
10. Lynch BR, Rochette R. Circatidal rhythm of free-roaming sub-tidal green crabs, Carcinus maenas, revealed by radio-acoustic positional telemetry. Crustaceana. 2007;80:345–55.
11. Biesinger Z, Bolker BM, Marcinek D, Grothues TM, Dobarro JA, Lind-berg WJ. Testing an autonomous acoustic telemetry positioning system for fine-scale space use in marine animals. J Exp Mar Biol Ecol. 2013;448:46–56.
12. Melnychuk MC: Detection efficiency in telemetry studies: definitions and evaluation methods. In: Adams NS, Beeman JW, Eiler JH, editors. Telem-etry techniques: a user guide for fisheries research. American Fisheries Society, Bethesda, Maryland; 2012. p. 339–57.
13. Payne N, Gillanders B, Webber D, Semmens J. Interpreting diel activity patterns from acoustic telemetry: the need for controls. Mar Ecol Prog Ser. 2010;419:295–301.
14. Kessel ST, Cooke SJ, Heupel MR, Hussey NE, Simpfendorfer CA, Vagle S, Fisk AT. A review of detection range testing in aquatic passive acoustic telemetry studies. Rev Fish Biol Fish. 2014;24:199–218.
15. Baktoft H, Zajicek P, Klefoth T, Svendsen JC, Jacobsen L, Pedersen MW, March Morla D, Skov C, Nakayama S, Arlinghaus R. Performance assess-ment of two whole-lake acoustic positional telemetry systems—Is reality mining of free-ranging aquatic animals technologically possible? PLoS ONE. 2015;10:e0126534.
16. Bergé J, Capra H, Pella H, Steig T, Ovidio M, Bultel E, Lamouroux N. Prob-ability of detection and positioning error of a hydro acoustic telemetry system in a fast-flowing river: intrinsic and environmental determinants. Fish Res. 2012;125–126:1–13.
17. Roy R, Beguin J, Argillier C, Tissot L, Smith F, Smedbol S, De-Oliveira E. Test-ing the VEMCO PositionTest-ing System: spatial distribution of the probability of location and the positioning error in a reservoir. Anim Biotelemetry. 2014;2:1.
18. Steel AE, Coates JH, Hearn AR, Klimley AP. Performance of an ultrasonic telemetry positioning system under varied environmental conditions. Anim Biotelemetry. 2014;2:15.
19. O’Dor RK, Andrade Y, Webber DM, Sauer WHH, Roberts MJ, Smale MJ, Voegeli FM: Applications and performance of radio-acoustic positioning and telemetry (RAPT) systems. In Lagardère J-P, Anras M-LB, Claireaux G, editors. Advances in invertebrates and fish telemetry. Berlin: Springer; 1998. p. 1–8. (Developments in Hydrobiology, vol. 130).
20. Ehrenberg JE, Steig TW. A method for estimating the “position accuracy” of acoustic fish tags. ICES J Mar Sci J Cons. 2002;59:140–9.
21. Yoshida N, MIitamura H, Aria N, Yamane H, Mitsunaga Y, Viputhanumas T, Ratanachamnong D: Detection range and horizontal accuracy of a fine-scale positioning telemetry system at Kaeng Krachan Reservoir, Thailand. In: Proceedings of the design symposium on conservation of ecosystem (The 13th SEASTAR2000 workshop), vol. 2; 2014. p. 9–14.
• We accept pre-submission inquiries
• Our selector tool helps you to find the most relevant journal • We provide round the clock customer support
• Convenient online submission • Thorough peer review
• Inclusion in PubMed and all major indexing services • Maximum visibility for your research
Submit your manuscript at www.biomedcentral.com/submit
Submit your next manuscript to BioMed Central
and we will help you at every step:
23. Simpfendorfer CA, Heupel MR, Collins AB. Variation in the performance of acoustic receivers and its implication for positioning algorithms in a riverine setting. Can J Fish Aquat Sci. 2008;65:482–92.
24. Heupel MR, Reiss KL, Yeiser BG, Simpfendorfer CA. Effects of biofouling on performance of moored data logging acoustic receivers. Limnol Ocean-ogr Methods. 2008;6:327–35.
25. Smith F. Understanding HPE in the Vemco Positioning System (VPS). Halifax, NS: Vemco Inc.; 2013.
26. Akima H, Gebhardt A: Interpolation of irregularly and regularly spaced data. 2015. R package version 0.5-12. http://CRAN.R-project.org/ package=akima.
27. Bates D, Maechler M, Bolker BM, Walker S: lme4: Linear mixed-effects model using “Eigen” and S4. 2015. R package version 1.1-8. http://CRAN.R-project.org/package=lme4.
28. R Core Team: R: A language and environment for statistical computing. 2015. https://www.R-project.org/.
29. Binder TR, Riley SC, Holbrook CM, Hansen MJ, Bergstedt RA, Bronte CR, He J, Krueger CC. Spawning site fidelity of wild and hatchery lake trout (Salvelinus namaycush) in northern Lake Huron. Can J Fish Aquat Sci. 2016;73:18–34.
30. Muggeo V: Segmented: an R package to fit regression models with broken-line relationships. 2008. https://cran.r-project.org/web/packages/ segmented/index.html.
31. Voegeli FA, Lacroix GL, Anderson JM. Development of miniature pingers for tracking Atlantic salmon smolts at sea. Hydrobiologia. 1998;371:35–46. 32. Pincock DG. Understanding the performance of VEMCO 69 kHz single
frequency acoustic telemetry. Halifax NS: Vemco Inc; 2008.
33. Riley SC, Binder TR, Wattrus NJ, Faust MD, Janssen J, Menzies J, Marsden JE, Ebener MP, Bronte CR, He JX, Tucker TR, Hansen MJ, Thompson HT, Muir AM, Krueger CC. Lake trout in northern Lake Huron spawn on sub-merged drumlins. J Great Lakes Res. 2014;40:415–20.
34. Gjelland KØ, Hedger RD. Environmental influence on transmitter detec-tion probability in biotelemetry: developing a general model of acoustic transmission. Methods Ecol Evol. 2013;4:665–74.
35. Singh L, Downey NJ, Roberts MJ, Webber DM, Smale MJ, Van Den Berg MA, Harding RT, Engelbrecht DC, Blows BM. Design and calibration of an acoustic telemetry system subject to upwelling events. Afr J Mar Sci. 2009;31:355–64.
36. Johnson BK, Ager AA, Findholt SL, Wisdom MJ, Marx DB, Kern JW, Bryant LD: Mitigating spatial differences in observation rate of automated telem-etry systems. J Wildl Manag 1998;62:958–67.
37. Martins EG, Gutowsky LF, Harrison PM, Patterson DA, Power M, Zhu DZ, Leake A, Cooke SJ. Forebay use and entrainment rates of resident adult fish in a large hydropower reservoir. Aquat Biol. 2013;19:253–63. 38. Perry RW, Skalski JR, Brandes PL, Sandstrom PT, Klimley AP, Ammann A,