O R I G I N A L A R T I C L E
Study of visual evaluations for wood flooring applying fuzzy logic
Wen Sheng Chen• An Sheng Lee•Han Chien Lin
Received: 23 January 2014 / Accepted: 5 June 2014 / Published online: 17 July 2014 The Japan Wood Research Society 2014
Abstract This study was aimed to investigate the visual evaluations of wood flooring. The selected 12 species of wood flooring were simulated by computer and combined with the 6 sets of visual image adjectives to design a questionnaire and survey the visual evaluations of con-sumers. Triangular fuzzy number of fuzzy theory was employed to obtain the scores of the 12 species of wood flooring in the 6 visual image evaluations. The results showed that the differences between different species of wood flooring in the visual evaluation were less significant in terms of ‘‘classical and primitive’’, ‘‘durable and prac-tical’’, and ‘‘natural and original’’. However, the differ-ences were more significant in terms of ‘‘Elegant and Soft’’, ‘‘close and comfortable’’, and ‘‘tender and amiable’’. Furthermore, six groups with relative overall visual images were induced from the comparison of wood flooring by qualitative classification. For example, the overall visual images of Quercus rubra, Acer saccharum and Quercus alba were similar, and they were more ‘‘Elegant and
Soft’’,‘‘durable and practical’’,‘‘close and comfortable’’, and ‘‘tender and amiable’’. The overall visual images of Carya ovata, Pinus rigidaandCastanea sativawere sim-ilar, and they tended to be ‘‘classical and primitive’’ and ‘‘natural and original’’.
Keywords Visual evaluationWood flooring Fuzzy logic
Introduction
Wood is traditionally a natural material and one of the extremely precious natural resources. The affinity to people is far more than what other materials can reach. The spe-cies of trees, their living environments, the soils, and weather create various textures, colors, and different types of hardness and enrich the attraction for people. Hence, the use and development of wood resources are favored not only in the industrial field but also in the design field. As the incomes increase, people increase their demand for living quality. For living quality, they like to use wood as the material of floors inside rooms or as one of the mate-rials for decoration because wood has elegant texture, appropriate flexibility, natural warmth, and special material feelings; besides, it can adjust humidity and temperature [1].
The wood flooring makes people feel exquisite, com-fortable, warm, and natural. It is also visually harmonious, beautiful, and antibacterial. Thus, it is favored and used by people in architecture and interior decoration, and the usage amount is increased. The statistical data of Customs Administration, Ministry of Finance, Taiwan, display the total import and export annual average amount during 2003–2012 was approximately 4,870 tons, which was W. S. Chen
Department of Creative Product Design, Nanhua University, No. 55, Sec.1, Nanhua Rd., Dalin Township,
Chiayi 62249, Taiwan, ROC e-mail: [email protected]
W. S. Chen
Program of Agriculture Science, National Chiayi University, No. 300 Syuefu Rd, Chiayi 60004, Taiwan
A. S. Lee (&)H. C. Lin
Department of Wood Based Materials and Design, National Chiayi University, No. 300 Syuefu Rd, Chiayi 60004, Taiwan, ROC
e-mail: [email protected]
H. C. Lin
worth US$13 million dollars. Based on Lin’s [2] inter-views with wood flooring traders, the average monthly use of wood flooring in Taiwan is approximately 530,000 m2, namely 39,505 tons.
Li [3] investigated the wood perception and interior use of people in northern Taiwan. The result displayed most of them like wood and would like to use wood if there is any chance. The data showed that 35 % of people use wood in their interior decorations, in which wood flooring is the majority. It is thus obvious that wood flooring is the majority in terms of wood used in the living environment. According to Ren et al. [4], manufacturers consider that the colors and prices of flooring and the recommendations of relatives and friends are critical factors when consumers choose and purchase wood flooring. The dark-color floors and light-color floors are equivalently popular in Taiwan. In addition, the questionnaire survey result of Lin et al. [2] showed that Taiwanese prefer dark-color wood flooring probably because light-color flooring tends to more easily be eaten by moths and damped, and it tends to rise rever-sely after being used for 10–20 years. It is thus replaced by dark-color flooring.
When wood flooring is applied to residential space design, most of designers can use shaping, colors, and materials to interpret and explain the design to their cus-tomers, but the customers would still have different feel-ings in their mind, and the feelfeel-ings would influence consumers’ preferences for products. If consumers and designers can be based on some support information when making choices, it will be helpful for their communication, and users will thus obtain products better conforming to their psychological feelings. Therefore, an objective research method would be used to investigate and analyze the relationships between wood flooring and the different visual psychological feelings of human beings and inves-tigating the visual evaluations of users for wood. It will help reduce the gap between designers’ and users’ per-ceptions of wood floorings and increase the benefits of interior design.
For the definitions of ‘‘image’’, Peng [5] considered that ‘‘image’’ is also called mental imagery (or appearance). It indicates a knowledge representation of currently inexis-tent objects or events. It represents certain objects or events, and the information that it conveys is of distinctive perceptual features. Since vision plays a critical role in human life, images researched by psychology are mainly visual images. Bimbo et al. [6] addressed that images are obtained through the similarity between the imagination for shapes of objects and the sketches depicted by users. The complexity of the object shapes felt by users actually cannot be defined by numbers precisely.
In the research relevant to wood images in terms of wood textures and psychological features, Nakamura [7]
used computers to simulate and create various radial sec-tional texture samples of wood and analyzed the natural feelings through mental capacity investigations, and also analyzed the relationship between parameters, such as texture patterns and ripple frequency. The results indicated (1) natural feelings are highly correlated with wood pattern similarity and preferences; (2) enhancing a natural feeling tends to effectively increase the visual features of graining products; (3) coefficients should be adjusted in the stripe-changing cycle to enable the entity to generate gentle shading fluctuations, so that that visual effects that people like will be likely obtained. Berger et al. [8] investigated tactile sensation of touching three different surfaces: oiled parquet, lacquered parquet, and laminate flooring in Aus-tria. Nyrud and Bringslimark [9] pointed out the effective responses of human observers to wood provided psycho-logically beneficial effects.
For wood texture and environmental spatial images, Yamada et al. [10] addressed that the line directions of wood texture affected the visual illusions of space size. Nakamura et al. (2012) used sensory evaluation to assess the visual impressions of various edge-grain patterns using printed images [11].
In terms of wood processing and visual images, Bum-gardner and Bowe [12,13] investigated students’ and adult consumers’ perceptions of wood from several tree species to determine difference between name-based and appear-ance-based evaluations. Chen [14] generated different patterns by using wood with and without obvious textures and processing technology to investigate differences between psychological differences.
As for applications of wood images in product design, Takahashi et al. [15] brought up in the five-sense analysis of wood that the affinity images of wood grain, the warm images of colors, and the influence of wood fibers on the visual reflectivity of painting, and also investigated the amount of xylem vessels and the influence on the visual brightness of painting. Jonsson [16] identified factors determining preferences for different materials of floor covering in Netherland and UK. Scholz and Decker [17] investigated the preferences for different wood species in furniture, specifically on a wooden dining table in Germany.
of human beings, investigate different human visual images evaluations for wood floors and compare the visual images of different wood floors by suitable semantic adjectives. We used fuzzy algorithm to analyze the visual image evaluations of each type of wood flooring. The result is in hopes of providing for relevant business owners, designers, and consumers as a reference to wood flooring selection.
Materials and methods
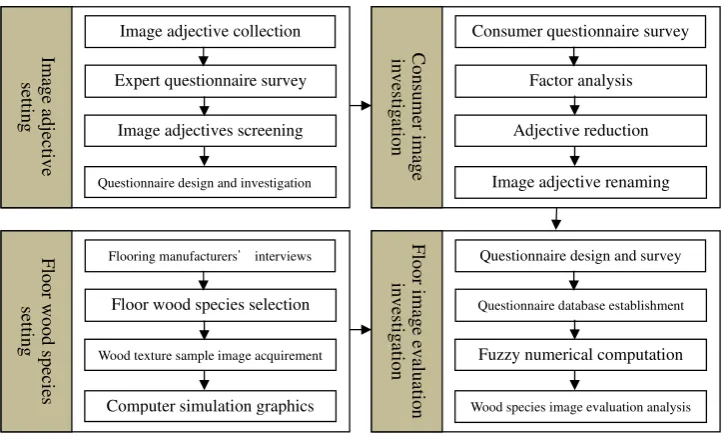
Research framework
The major research process is shown in Fig.1. First, adjectives related to the visual images of wood flooring were collected. A great number of achievements have been accumulated by research on the visual images of materials. Consequently, papers and studies related to wood material and style images, and interior design magazines, such as La vie, ARCH, and INTERIOR, were referred and employed as the major sources for adjective collection. Finally, adjectives suitable for expressing the images of wood flooring were selected, and repeated adjectives were eliminated. In total, 110 adjectives were applied to this study to conduct the image adjective extraction experiment in the first stage.
Through the expert questionnaire in the first stage, the 110 image adjectives were used to establish a question-naire, and ten interior designers from relevant fields, were invited to select 40–50 adjectives which they thought were the most suitable for describing wood flooring images.
Then, the 40 adjectives of top scores were discovered for the following research.
To further reduce the number of the adjectives for the visual image evaluations of wood flooring and rename the adjectives of each group, a semantic differential question-naire survey of general consumers was conducted, and SPSS was employed to the questionnaire survey result for factor analysis. In the second stage, a Likert five-point scale was applied to the obtained 40 adjectives for a questionnaire survey. The five levels in the scale included ‘‘very unsuitable’’, ‘‘unsuitable’’, ‘‘ordinary’’, ‘‘suitable’’, and ‘‘very suitable’’. In total, 114 valid samples were obtained at random from wood flooring stores (61 females and 53 males), then, a factor analysis was applied to the data.
There are a great number of options among the wood species of flooring, so in this study, wood flooring manu-facturers with high market share and large scale (Such as Ua floor, SSE floor, and kd floor companies) in Taiwan were interviewed first to understand the current market of wood flooring. After the interviews with the main wood flooring manufacturers, the top 12 wood species in terms of market share were regarded as the research samples. The relevant sales’ data were integrated, and the top 12 species of wood flooring in the market were regarded as the research samples of this study. They accounted for 85.2 % of the market, so they were representative. They are numbered at random, and shown in Table1.
Based on the 12 wood flooring products and images, respectively, from Table1, 3ds max software was used to create the virtual image files, and the aforementioned renamed adjectives for the visual images of wood flooring
Image adjective collection
Expert questionnaire survey
Image adjectives screening
Questionnaire design and investigation
Image adjective
setting
Consumer questionnaire survey
Factor analysis
Adjective reduction
Image adjective renaming
Con
sumer
imag
e
in
vestig
ation
Flooring manufacturers interviews
Floor wood species selection
Wood texture sample image acquirement
Computer simulation graphics
Floor w
o
od
sp
eci
es
se
tti
n
g
Questionnaire design and survey
Questionnaire database establishment
Fuzzy numerical computation
Wood species image evaluation analysis
Floor
imag
e evalu
atio
n
investi
gation
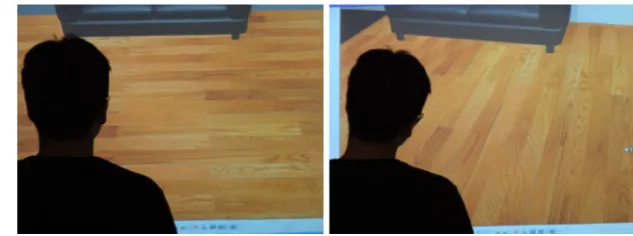
were integrated to conduct the questionnaire design and survey of consumers on the visual evaluations of the 12 wood flooring products. The examinees were invited to a prepared room that is described as below: the observation environment was indoors with general lighting, the real size floor pattern images were showed on a 120-inches reflection screen by high lumen projector, two visual angles for each species and the distance between observer and the screen was 3 m (shown as Fig.2). Fuzzy numerical com-putation was then applied to the questionnaire survey result, and the values were used to establish diagrams and tables for further comparison and analysis.
Factor analysis
Generally, factor analysis is used as a method to simplify complicated data [18]. Brown defined factor analysis as ‘‘the statistic method in which the amount of factors are decided to explain the relation between a group of variances, and a
factor is the combination of multiple related variables, so they can be used to measure identical features’’ [19]. In other words, in factor analysis, fewer dimensions are used to express original data structure, and most of the information provided by the original data is kept.
Fuzzy logic
This study has adopted a fuzzy wording questionnaire, in the understanding that psychological decision making is an implicit phenomenon, so the quantified number may be more than just an integer. Fuzzy logic can manage fuzzy and rigorous judgment in mathematics adopts a fuzzy wording scale instead of traditional measuring scale to manage the variability of human thinking. Similarly tri-angular fuzzy numbers are used here to quantify linguistic variables, including the intensity of consumers’ needs.
Fuzzy theory was brought up by Zadeh [20], a pro-fessor at the University of California, Berkeley. Zadeh Table 1 The numbers and pictures of the 12 species of wood flooring
No. Name of wood species Code No. Name of wood species Code
1 Quercus rubra QR 7 Pinus rigida PR
2 Acer saccharum AS 8 Castanea sativa CS
3 Juglans nigra JN 9 Tectona grandis TG
4 Carya ovata CO 10 Quercus alba QA
5 Myroxylon balsamum MB 11 Juglans regia JR
6 Prunus serotina PS 12 Callitris hugelii CH
No.1 QR No.2 AS No.3 JN No.4 CO
No.5 MB No.6 PS No.7 PR No.8 CS
considered that human subjective thoughts, reasoning, and perception of things around were considerably fuzzy in nature, so it is necessary to use the fuzzy logic concept to describe the levels of good and bad of something to complement the disadvantages of using binary logic to describe things in the traditional set theory, expand the relation between elements and sets in the traditional set theory, and use membership function to express the relation between elements and sets. In relative studies on fuzzy methods, Sun et al. [21] pre-sented a method for design candidate evaluation and identification using neural network-based fuzzy reasoning based on fuzzy rules described with triangular fuzzy numbers. Chen [22] introduced a multiple criteria deci-sion-making method to solve the distribution center location selection problem with triangular fuzzy num-bers. Furthermore, the fuzzy concept is quantified in the fuzzy set theory. It is mainly used to deal with the fuzziness in the psychological feelings of some research objects to spread the membership of elements on sets to any random value in a single interval (0, 1).
When fuzzy theory is applied to semantic measurement, fuzzy numbers are usually used for expression. The fol-lowing is the fuzzy numbers often used in research: trian-gular fuzzy numbers, trapezoidal fuzzy numbers, and normal fuzzy numbers. Among them, triangular fuzzy numbers are the most common.
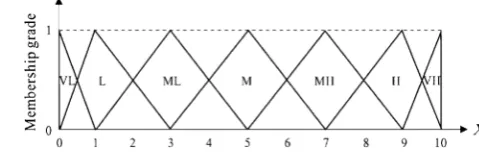
Triangular fuzzy numbers and linguistic variables
The particularity of triangular fuzzy numbers lies in that the probability distributions of the membership function for
a triangle [23]. Assume~t is a triangular fuzzy number in Membership Functionli(x), and it is expressed as~t=(t1,
t2,t3). Whent1,t2, andt3are real numbers, andt1Bt2Bt3,
the membership function can be expressed as shown in Fig.3 [24]. Unnecessary details about the attributes will not be provided here.
To help consumers and decision makers to easily express their judgment, semantic variables are usually employed as an evaluation method to decide the impor-tance of users’ demand and the sequence of product selection. The seven-level semantic variables shown in Table2 are respectively: (1) Very Low, (2) Low, (3) Medium Low, (4) Medium, (5) Medium High, (6) High, (7) Very High. The method allows a person describing the differences using the subjective judgment. In terms of the entire semantic scale, triangular fuzzy numbers can be used to describe the relationship between potential features and semantic wording membership if this semantic variable is represented by the triangular fuzzy number value to which it corresponds (Fig. 4).
Total utility value on triangular fuzzy numbers
For the convenience of further comparison and analyses, defuzzification can be used to turn fuzzy numbers into crisp values in triangular fuzzy number in membership function. The methods often applied to defuzzification include ‘‘center of gravity’’, ‘‘maximum degree of mem-bership’’, and ‘‘maximizing set and minimizing set method’’, which is the most common. Consequently, Chen’s (1985) maximizing set and minimizing set method was adopted in this study [25]. In this method, the weights of two triangular fuzzy numbers are calculated to further derive a method for returning triangular fuzzy numbers to total utility values to calculate the total utility value of fuzzy numbers. The method is detailed as follows:
The relevant definition is described in Fig. 5. Suppose there arentriangular fuzzy numbers in the triangular fuzzy number membership function, and they are defined as ~ti=
(ti1, ti2, ti3), i=1,2,…,n, so the minimum membership
function, namely lG(x), and the maximum membership
Fig. 2 The survey of
examinees on the virtual images ofQuercus rubra(QR)
is a triangular fuzzy number
in Membership Function µi(x),
and = (t1, t2, t3), t1≤ t2≤t3
function, namely lM(x), are, respectively, G and M,
G=(Xmin,Xmin,Xmax) andM=(Xmin,Xmax,Xmax), thus,
the total utility value formula, that is,UT(~ti), of triangular
fuzzy number~ti is:
UTð~tiÞ ¼ ½ðti3XminÞ=ððXmaxXminÞ þ ðti3ti2ÞÞ þ1
ðXmaxti1Þ=ððXmaxXminÞ þ ðti2ti1ÞÞ=2;i¼1;2;. . .;n
Based on the fuzzy semantic theory, the questionnaire was designed to understand the visual evaluations of con-sumers for the 12 species of wood flooring, and the aforementioned fuzzy numerical computation formula was applied to the result to calculate the total utility value of each visual evaluation of every type of wood flooring. Moreover, the obtained values were used to produce dia-grams and tables for further comparing and analyzing the visual images of the 12 species of wood flooring, and are provided for designers and consumers as a reference to wood flooring selection in the hope of obtaining the pro-ducts which best meet consumers’ demand.
Results and discussion
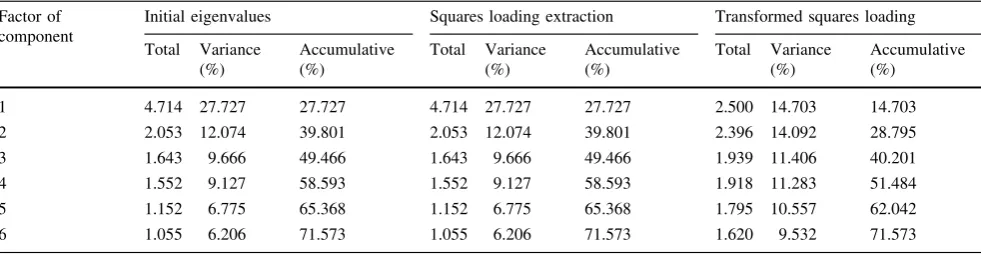
Thirty-two adjectives with discrimination by T test were applied to the first factor analysis. After a principal com-ponent analysis, there were totally 17 adjectives whose absolute values of factor loading were higher than 0.6. These adjectives were applied to the second factor analysis (Table3).
The KMO and Bartliett test after factor analyses shows KMO value reaches 0.796, indicating the datum was
suitable; and Bartliett spherical test value reaches 637.270 (df136), it represents that significance was reached, indi-cating that common factors existed between the correlation matrixes of the population.
The total variance explained in Table4showed that the eigenvalues of six factors were higher than 1, and the total variance explained was 71.573 %. It is shown by a trans-formed matrix in Table5. The factors of the six compo-nents in the second factor analysis were very clear, and they did not cover other factor components. Therefore, the 17 adjectives (such as Table5) and six components (such as Table4) in the second factor analysis can be adopted in the following.
Renaming results of factor analysis
Adjectives suitable for the visual evaluation of wood flooring should be obtained first, so factor analysis was applied to 110 adjectives to select adjective groups which included 17 adjectives and six factors. In this stage, the factors were renamed through the adjective-related fea-tures in each factor set. The result is displayed in Table6. There are six adjective phrases, including Elegant and Soft, close and comfortable, classical and primitive, ten-der and amiable, durable and practical, and natural and original for the following consumers questionnaire survey on the visual evaluation of the 12 species of wood flooring.
Evaluation of visual images for wood floorings
The products and images of the 12 wood species of flooring in Table 1 were collected, and 3ds max software was used to create the virtual image files. Combining with the aforementioned six visual image adjective phrases, the triangular fuzzy number scale, whose degrees include ‘‘Very Low (VL)’’,‘‘Low (L)’’,‘‘Medium Low (ML)’’,‘‘Medium (M)’’,‘‘Medium High (MH)’’,‘‘High (H)’’, and ‘‘Very High (VH)’’, in Table2 were applied to the scale questionnaire design, and a questionnaire survey for consumers’ visual evaluations of the 12 species of wood flooring was conducted. The examinees were
Fig. 4 Membership functions of triangular fuzzy numbers. See Table2for abbreviations of semantic variables Table 2 Linguistic variables for the importance and the ratings
Linguistic variables Triangular fuzzy numbers
Very low (VL) (0, 0, 1)
Low (L) (0, 1, 3)
Medium low (ML) (1, 3, 5)
Medium (M) (3, 5, 7)
Medium high (MH) (5, 7, 9)
High (H) (7, 9, 10)
20–50 years old and interested in wood flooring. In total, 102 valid samples were obtained (55 female and 47 male collected from the setting space). The mean scores of visual evaluations on each type of wood flooring are listed in Table7 by fuzzy numerical computation as below:
1. Collect questionnaire scores by the seven levels of evaluation (from ‘‘VL’’ to ‘‘VH’’)
2. Sum up scores based on the triangular fuzzy numbers which are applied to the each level. For example if an
evaluation of specimen s for ‘‘Elegant and Soft’’ category by respondentiwas ‘‘low’’, the triplet of this evaluation wastis(0,1,3). In a similar way, if
respon-dentsjandkevaluated specimensas ‘‘medium’’ and ‘‘high’’, the triplets were tjs (3,5,7) and tks (7,9,10),
respectively
3. Calculate the mean triplet of specimen s,ts =(ts1, ts2,
ts3), by following manner
ts1¼ t1s1þt2s1þ þtis1þtjs1þtks1þ þtns1
=N
ts2¼ t1s2þt2s2þ þtis2þtjs2þtks2þ þtns2
=N
ts3¼ t1s3þt2s3þ þtis3þtjs3þtks3þ þtns3
=N
N: the number of respondents
tis1, tis2, tis3: a triplet of specimen s evaluated by
respondenti;tis1=0, tis2=1, tis3=3
tjs1, tjs2, tjs3: a triplet of specimen s evaluated by
respondentj;tjs1=5, tjs2=5, tjs3=7
tks1, tks2, tks3: a triplet of specimen s evaluated by
respondentk;tks1=7,tks2=9,tks3=10
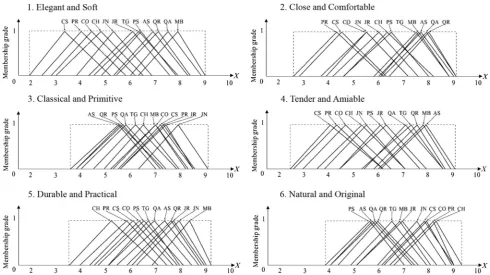
The visual evaluations of the species of wood flooring were then sorted and diagrams were created by triangular fuzzy numbers (Fig.6)
The triangular fuzzy numbers of the 12 species of wood flooring in each visual evaluation were turned into the total utility values of evaluation. For abbreviations of wood Fig. 5 Membership functions oflM(x) andlG(x) 1. Elegant and Soft 2. Close and comfortable 3. Classical and primitive 4. Tender and amiable
5. Durable and practical 6. Natural and original
Table 4 Total variance explained
Factor of component
Initial eigenvalues Squares loading extraction Transformed squares loading
Total Variance (%)
Accumulative (%)
Total Variance (%)
Accumulative (%)
Total Variance (%)
Accumulative (%)
1 4.714 27.727 27.727 4.714 27.727 27.727 2.500 14.703 14.703
2 2.053 12.074 39.801 2.053 12.074 39.801 2.396 14.092 28.795
3 1.643 9.666 49.466 1.643 9.666 49.466 1.939 11.406 40.201
4 1.552 9.127 58.593 1.552 9.127 58.593 1.918 11.283 51.484
5 1.152 6.775 65.368 1.152 6.775 65.368 1.795 10.557 62.042
6 1.055 6.206 71.573 1.055 6.206 71.573 1.620 9.532 71.573
Extraction method: principal component analysis
Table 3 The 17 adjectives whose absolute values of factor loading were higher than 0.6
Adjectives Initial Extraction Adjectives Initial Extraction
Close 1.000 0.679 Tender 1.000 0.731
Primitive 1.000 0.803 Retro-chic 1.000 0.723
Comfortable 1.000 0.667 Practical 1.000 0.650
Original 1.000 0.655 Natural 1.000 0.682
Soft 1.000 0.668 Quiet 1.000 0.714
Relaxing 1.000 0.658 Classical 1.000 0.744
Durable 1.000 0.793 Elegant 1.000 0.801
Amiable 1.000 0.795 Graceful 1.000 0.727
species, refer to Table1, for example, the calculation of wood species 1 (QR) in the visual evaluation of ‘‘Elegant and Soft’’ is as follows (Fig.7):
According to the data in Table7 and Fig.7, the total utility value formula is described in Fig.5, namelyUT(~ti),
of triangular fuzzy number~tiwas applied to the calculation.
Table 5 Transformed component matrixes
Extraction method: principal component analysis. Rotation method: varimax with Kaiser normalization
Adjectives Component
Factor 1 Factor 2 Factor 3 Factor 4 Factor 5 Factor 6
Elegant 0.869 0.056 0.075 0.084 0.068 0.159
Graceful 0.785 0.064 0.262 0.073 0.165 0.076
Soft 0.623 0.277 0.108 0.413 0.027 -0.143
Close -0.026 0.783 0.139 0.204 -0.044 0.047
Relaxing 0.417 0.618 -0.198 0.229 0.100 0.028
Comfortable 0.348 0.614 -0.143 0.105 0.149 0.339
Retro-chic 0.124 -0.038 0.826 0.084 0.034 0.123
Classical 0.405 0.036 0.739 -0.009 0.019 0.181
Primitive -0.242 0.575 0.598 -0.023 0.237 0.006
Amiable -0.022 0.063 0.146 0.827 0.162 0.242
Tender 0.299 0.229 -0.093 0.762 0.005 -0.013
Fragrant 0.206 0.447 0.042 0.551 -0.149 -0.078
Durable 0.030 0.061 -0.082 -0.017 0.882 0.053
Practical 0.187 0.042 0.252 0.122 0.731 0.024
Quiet 0.171 0.002 0.025 0.100 0.422 0.704
Original -0.020 0.047 0.225 0.132 -0.298 0.704
Natural 0.097 0.491 0.187 -0.105 0.204 0.586
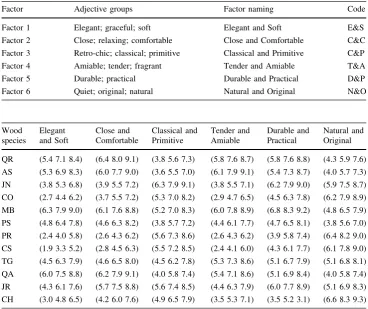
Table 6 Factor renaming list Factor Adjective groups Factor naming Code
Factor 1 Elegant; graceful; soft Elegant and Soft E&S
Factor 2 Close; relaxing; comfortable Close and Comfortable C&C
Factor 3 Retro-chic; classical; primitive Classical and Primitive C&P
Factor 4 Amiable; tender; fragrant Tender and Amiable T&A
Factor 5 Durable; practical Durable and Practical D&P
Factor 6 Quiet; original; natural Natural and Original N&O
Table 7 The sequence and means of the visual evaluations of the species of wood flooring
Abbreviations for wood species are referred to Table1
Wood species
Elegant and Soft
Close and Comfortable
Classical and Primitive
Tender and Amiable
Durable and Practical
Natural and Original
QR (5.4 7.1 8.4) (6.4 8.0 9.1) (3.8 5.6 7.3) (5.8 7.6 8.7) (5.8 7.6 8.8) (4.3 5.9 7.6)
AS (5.3 6.9 8.3) (6.0 7.7 9.0) (3.6 5.5 7.0) (6.1 7.9 9.1) (5.4 7.3 8.7) (4.0 5.7 7.3)
JN (3.8 5.3 6.8) (3.9 5.5 7.2) (6.3 7.9 9.1) (3.8 5.5 7.1) (6.2 7.9 9.0) (5.9 7.5 8.7)
CO (2.7 4.4 6.2) (3.7 5.5 7.2) (5.3 7.0 8.2) (2.9 4.7 6.5) (4.5 6.3 7.8) (6.2 7.9 8.9)
MB (6.3 7.9 9.0) (6.1 7.6 8.8) (5.2 7.0 8.3) (6.0 7.8 8.9) (6.8 8.3 9.2) (4.8 6.5 7.9)
PS (4.8 6.4 7.8) (4.6 6.3 8.2) (3.8 5.7 7.2) (4.4 6.1 7.7) (4.7 6.5 8.1) (3.8 5.6 7.0)
PR (2.4 4.0 5.8) (2.6 4.3 6.2) (5.6 7.3 8.6) (2.6 4.3 6.2) (3.9 5.8 7.4) (6.4 8.2 9.0)
CS (1.9 3.3 5.2) (2.8 4.5 6.3) (5.5 7.2 8.5) (2.4 4.1 6.0) (4.3 6.1 7.7) (6.1 7.8 9.0)
TG (4.5 6.3 7.9) (4.6 6.5 8.0) (4.5 6.2 7.8) (5.3 7.3 8.6) (5.1 6.7 7.9) (5.1 6.8 8.1)
QA (6.0 7.5 8.8) (6.2 7.9 9.1) (4.0 5.8 7.4) (5.4 7.1 8.6) (5.1 6.9 8.4) (4.0 5.8 7.4)
JR (4.3 6.1 7.6) (5.7 7.5 8.8) (5.6 7.4 8.5) (4.4 6.3 7.9) (6.0 7.7 8.9) (5.1 6.9 8.3)
UTð Þ ¼ ½~ti ð Þ ti3 XminÞ=ððXmaxXminÞ þ ðti3ti2ÞÞ þ1
ðXmaxti1Þ=ððXmaxXminÞ þ ðti2ti1ÞÞ=2;i¼1;2;. . .;n
in which~t1= (5.4, 7.1, 8.4) Xmin=1.9 Xmax =9.0 were
applied to the equation, and the following was obtained. UTð Þ ¼½~t1 ð8:41:9Þ=ðð9:01:9Þ þð8:47:1ÞÞ þ1
ð9:05:4Þ=ðð9:01:9Þ þð7:15:4ÞÞ=2 ¼0:6824
After the calculation, the total utility values of the visual evaluations of the 12 species of wood flooring are sum-marized in Table8.
The aforementioned results showed:
Figure6 shows there was less extent of difference between different species of wood flooring in the visual
evaluations of classical and primitive, durable and prac-tical, and natural and original. However, the extents of difference were greater in Elegant and Soft, close and comfortable, and tender and amiable.
In Table8, the scores of MB were high in each evaluation dimension except ‘‘natural and original’’, and the scores were the highest in ‘‘Elegant and Soft’’ as well as ‘‘durable and practical’’. In addition, the wood species receiving the highest scores in ‘‘close and comfortable’’, ‘‘classical and primitive’’, ‘‘tender and amiable’’ and ‘‘natural and original’’ were, respectively, QR, JN, AS and CH.
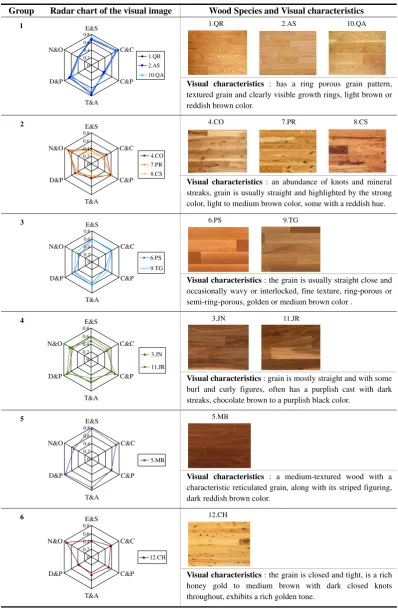
The scores of the visual evaluations of the 12 species of wood flooring were further applied to the creation of radar charts for the comprehensive comparison of wood species. By qualitative classification, six groups with relative overall comprehensive visual evaluations were generalized. Fig. 6 The triangular fuzzy numbers of the 12 species of wood flooring in each visual evaluation. All abbreviations for wood species are referred to Table1
The results are shown in Table9: (a) The overall visual images of QR, AS and QA are similar. They are excellent in ‘‘close and comfortable’’ and ‘‘tender and amiable’’, and good in ‘‘Elegant and Soft’’, ‘‘durable and practical’’. (b) CO, PR and CS are similar. They tend to be ‘‘classical and primitive’’ and ‘‘natural and original’’. (c) PS and TG are similar and relatively ‘‘Elegant and Soft’’,‘‘durable and practical’’,‘‘close and comfortable’’ and ‘‘tender and ami-able’’. (d) JN and JR are similar and excellent in ‘‘durable and practical’’ and ‘‘classical and primitive’’. (e) MB is excellent in ‘‘Elegant and Soft’’, ‘‘durable and practi-cal’’,‘‘close and comfortable’’ and ‘‘tender and amiable’’, and good in ‘‘classical and primitive’’. (f) CH is excellent in ‘‘natural and original’’. Table9 shows the six groups, and their visual characteristics are listed as well.
Conclusions
In terms of adjective selection for evaluating visual images, factor analysis can be used to effectively reduce the quantity of adjectives, help simplify the questionnaire survey of the visual evaluations of wood flooring, and obtain results in line with expectations. The semantic variable scale of fuzzy theory is suitable for the measure-ment and statistics of psychological feelings. After appro-priate defuzzification, precise values can be obtained from
fuzzy numbers in favor of comparing and analyzing results, although the result obtained by fuzzy algorithm is the opinions of the general public.
Each type of wood flooring has its unique visual image. The differences between different wood species were smaller in the visual images of classical and primitive, durable and practical, and natural and original, whereas the differences were greater in the visual images of Elegant and Soft, close and comfortable, and tender and amiable. The overall visual images of some wood species of flooring in the same group are similar and replaceable in con-sumption, design, and application. For instance, the group 1: QR, AS and QA are replaceable to each other, and the group 2: CO, PR and CS are as well.
The aforementioned research result can be applied to future practice. The data of different wood species of flooring in each visual evaluation can be used to establish relevant databases. Furthermore, computer programs can be employed to design decision support systems which can be provided for consumers, so when they choose wood flooring, they can find suitable wood flooring speedily according to their personal preferences for visual images. Designers can also accurately convey their con-cepts and what consumers want mentally. Further research and investigations can be aimed at the visual images of wood flooring combining with interior furniture and colors.
Table 8 The visual evaluation values of 12 species of wood flooring
* highest scores of species in each evaluation factor
For abbreviations of visual images, refer to Table1
Wood species
Elegant and Soft
Close and comfortable
Classical and primitive
Tender and amiable
Durable and practical
Natural and original
QR 0.6824 0.7567* 0.3766 0.7097 0.6574 0.4009
AS 0.6606 0.7212 0.3567 0.7666* 0.6162 0.3784
JN 0.4808 0.4552 0.7098* 0.4677 0.7003 0.6262
CO 0.3836 0.4552 0.5670 0.3721 0.4853 0.6770
MB 0.7778* 0.7151 0.5663 0.7343 0.7652* 0.4722
PS 0.5942 0.5616 0.3819 0.5395 0.5125 0.3627
PR 0.3398 0.3179 0.6136 0.3340 0.4184 0.7141
CS 0.2657 0.3387 0.5989 0.3105 0.4610 0.6658
TG 0.5920 0.5696 0.4613 0.6051 0.5322 0.5245
QA 0.7253 0.7452 0.4017 0.6691 0.5669 0.3905
JR 0.5674 0.6026 0.6207 0.5581 0.6751 0.5384
Table 9 The six wood flooring groups, respectively, with similar comprehensive visual evaluations
Group Radar chart of the visual image Wood Species and Visual characteristics
1 1.QR 2.AS 10.QA
Visual characteristics : has a ring porous grain pattern, textured grain and clearly visible growth rings, light brown or reddish brown color.
2 4.CO 7.PR 8.CS
Visual characteristics: an abundance of knots and mineral streaks, grain is usually straight and highlighted by the strong color, light to medium brown color, some with a reddish hue.
3 6.PS 9.TG
Visual characteristics: the grain is usually straight close and occasionally wavy or interlocked, fine texture, ring-porous or semi-ring-porous, golden or medium brown color .
4 3.JN 11.JR
Visual characteristics: grain is mostly straight and with some burl and curly figures, often has a purplish cast with dark streaks, chocolate brown to a purplish black color.
5 5.MB
Visual characteristics : a medium-textured wood with a characteristic reticulated grain, along with its striped figuring, dark reddish brown color.
6 12.CH
Visual characteristics: the grain is closed and tight, is a rich honey gold to medium brown with dark closed knots throughout, exhibits a rich golden tone.
0 0.2 0.4 0.6 0.8
E&S
C&C
C&P
T&A D&P
N&O
1.QR 2.AS 10.QA
0 0.2 0.4 0.6 0.8
E&S
C&C
C&P
T&A D&P
N&O
4.CO 7.PR 8.CS
0 0.2 0.4 0.6 0.8
E&S
C&C
C&P
T&A D&P
N&O
6.PS
9.TG
0 0.2 0.4 0.6 0.8
E&S
C&C
C&P
T&A D&P
N&O
3.JN
11.JR
0 0.2 0.4 0.6 0.8
E&S
C&C
C&P
T&A D&P
N&O
5.MB
0 0.2 0.4 0.6 0.8
E&S
C&C
C&P
T&A D&P
N&O
12.CH
Acknowledgments The authors would like to thank the Department of Wood Based Materials and Design of National Chiayi University for financial supporting this study and for their support during the survey administration.
References
1. Lu KZ (1987) Surface treatments of wooden floors. China Forest Products Industry 6:51–54
2. Lin JC, Zheng MR, Chen LQ, Liu SF (2002) Research on con-sumers’ habits of wood flooring in Taiwan. China Forest Products Industry 21:9–16
3. Li JH (1999) Livability of homes in north area of Taiwan. Master’s dissertation. National Taiwan University, Taiwan 4. Ren YA, Wu WY, Chen LQ, Tu SX (1997) An analysis of the
current situation of the wood flooring market in Taiwan. China Forest Products Industry 12:451–458
5. Peng ML (2000) Psycholinguistics. Beijing Normal University Press, Beijing
6. Bimbo D, Pala P, Santini S (1994) Visual image retrieval by elastic deformation of object shapes. Proc. IEEE VL’94, Int’lSymp. Visual Languages. St. Louis, Missouri
7. Nakamura M (1991) A study on producing radial section models by computer graphic unit and the image: How ‘‘natural’’ affect sensation and the image. In: Proceedings of the 41th Conference of the Japan Wood Research Society, pp 390–395
8. Berger G, Katz H, Petutschnigg AJ (2006) What consumers feel and prefer: Haptic perception of various wood flooring surfaces. Forest Prod J 56:42–47
9. Nyrud AQ, Bringslimark T (2010) Is interior wood use psycho-logically beneficial? A review of psychological response toward wood. Wood Fiber Sci 42:202–218
10. Yamada M, Shiraishi T (2006) The orientation and height of the wood used for wall affects the apparent space size. JSSD 53:24–25
11. Nakamura M, Miyake Y, Nakano T (2012) Effect of image characteristics of edge-grain patterns on visual impressions. J Wood Sci 58:505–512
12. Bumgardner MS, Bowe SA (2002) Species selection in secondary wood products: Implications for product design and promotion. Wood Fiber Sci 34:408–418
13. Bowe SA, Bumgardner MS (2004) Species selection in secondary wood products: perspectives from different consumers. Wood Fiber Sci 36:319–328
14. Chen ZZ (2007) A study on the furniture design for the wood-made image. Master’s dissertation, Nanhua University, Taiwan 15. Takahashi T, Suzuki M, Nakao T (1995) Wood science seminar
5–Environment. Kaiseisha Press, Tokyo
16. Jonsson R (2005) The end consumer‘s choice of floorcovering in The Netherlands and the United Kingdom: A comparative pilot study of substitute competition. J Wood Sci 51:154–160 17. Scholz SW, Decker R (2007) Measuring the impact of wood
species on consumer preferences for wooden furniture by means of the Analytic Hierarchy Process. Forest Prod J 57:23–28 18. Kline P (1999) An easy guide to factor analysis. Routledge,
London
19. Brown FG (1983) Principles of educational and psychological testing, 3rd edn. Holt Rinehart and Winston, New York 20. Zadeh LA (1965) Fuzzy sets. Inf Control 8:338–353
21. Sun J, Kalenchuk DK, Xue D, Gu P (2000) Design candidate identification using neural network based fuzzy reasoning. Robot Comput Integr Manuf 16:383–396
22. Chen CT (2001) A fuzzy approach to select the location of the distribution center. Fuzzy Sets Syst 118:65–73
23. Dubois D, Prade H (1978) Operations on fuzzy numbers. Int J Syst Sci 9:613–626
24. Hsieh CH, Chen SH (1999) A model and algorithm of fuzzy product positioning. Inf Sci 121:61–82