Available online at GSC Online Press Directory
GSC Biological and Pharmaceutical Sciences
e-ISSN: 2581-3250, CODEN (USA): GBPSC2
Journal homepage: https://www.gsconlinepress.com/journals/gscbps
Corresponding author E-mail address:
Copyright © 2019 Author(s) retain the copyright of this article. This article is published under the terms of the Creative Commons Attribution Liscense 4.0
(RESEARCH ARTICLE)
Formulation and evaluation of lovastatin tablets by using liquid solid compact
technique
Lakshmi Priya D.R * and Abbulu Konde
Principal and Guide Department of Pharmaceutics, CMR College Of Pharmacy Kandlakoya (V), Medchal Road, Hyderabad-501 401.
Publication history: Received on 28 April 2019; revised on 07 June 2019; accepted on 12 June 2019
Article DOI: https://doi.org/10.30574/gscbps.2019.8.1.0082
Abstract
Lovastatin is a poorly soluble, highly permeable drug and the rate of its oral absorption is often controlled by the dissolution rate in the gastrointestinal tract. There are several techniques to enhance the dissolution of poorly soluble drugs. Among them, the technique of liquid-solid compacts is one of the promising techniques towards such a novel aim. Hence the objective of the present work is to formulate & evaluate tablets by liquid-solid compacts technique. The physicochemical characteristics of Lovastatin compacts such as FTIR Flow properties, Hardness, Friability, in vitro release, Release kinetics were evaluated. The FTIR Spectra revealed that there was no interaction between polymer and Lovastatin. The in vitro performance of Lovastatin compacts showed control release depends on the polymer concentrations. The diffusion exponent (n) of Korsmeyer-Peppas model was found to be non-Fickian. The results showed that liquid-solid compacts had demonstrated significantly higher drug release rates than those of conventionally made. This was due to an increase in wetting properties and surface of drug available for dissolution.
Keywords: Liquisolid Compacts; Lovastatin; In vitro studies; Drug release kinetics; Dissolution rate
1. Introduction
Solubility behavior of a drug is one of the key determinants of its oral bioavailability. Bioavailability of poorly water-soluble drugs is limited by their solubility and dissolution rate. Several studies have been carried out to increase the dissolution rate of drugs by decreasing the particle size, by creating nano and micro particles. However, the fine drug particles have a high tendency to agglomerate due to van-der-Waals attraction or hydrophobicity, which result in a decrease in surface area over time. Another way of increasing the dissolution rate is adsorption of the drug onto a high-surface-area carrier. In this technique, the drug is dissolved in an organic solvent followed by soaking in the solution by a high-surface-area carrier such as silica [1]. Here, agglomeration of the drug particles is prevented due to the binding of the drug to the carrier. However, due to the presence of the residual solvent in the drug formulation, it is disadvantageous to use toxic solvents.
The term liquid-solid compacts as described by Spireas et.al indicates that immediate or sustained release tablets or capsules that are prepared using the technique of “liquid-solid systems” combined with inclusion of appropriate adjuvants required for tableting or encapsulation such as lubricants and for rapid or sustained release action, such as disintegrants or binders, respectively. Liquisolid compacts prepared by using different solvents which dissolve the poorly soluble drug and gives better bioavailability [2] [3] [4].
(3-140 hydroxy-3-methylglutaryl coenzyme A reductase), blocking the enzyme-catalyzed transformation of 3-hydroxy-3-methylglutaryl CoA into mevalonate [5]. Drug profile, Its Half Life5.3 hours, and Melting Point: 174˚C, Absorption: <5%, Distribution: Through Blood-Brain Barrier and Placenta, Protein binding: (>95%), Route of elimination: 83% in bile, 10% in urine, Metabolism: Metabolized mainly in Liver [6].
2.Material and methods
All materials (AR Grade) used were obtained from different sources and all instruments used in work that are as given in list respectively
.
2.1.List of materials
Micro crystalline cellulose (Nice chemicals pvt. Ltd. Cochin), Tween 80 (S D Fine Chem. Ltd. Mumbai), Ludiflash (Himedia laboratory pvt. Mumbai), Poly ethylene glycol (Loba chemicals pvt .ltd. Cochin), Propylene glycol
(Nice chemicals pvt.ltd. Cochin), Magnesium stearate (Loba chemicals pvt .ltd. Cochin) and Talc (S D Fine Chem. Ltd. Mumbai).
2.2.List of Instruments
UV/VIS Spectrophotometer (UV-1700, Shimadz Corporation, Japan), Electronic balance (BL-220H) (Shimadzu Corporation, Japan), Mechanical stirrer (Remi Udyog, Mumbai) and pH meter (Digisun Electronics, Mumbai).
2.3.Pre-formulation studies
Prefomulation studies involve the determination of both physical and chemical properties of drug with the goal of producing a new drug which is safe, stable and efficacious. These preformulation studies are carried out prior to the formulation of drug. The objectives of these studies are, to establish the compatibility of drug and excipients used in the formulation and to obtain optimal drug delivery system.
2.4.Identification of pure drug
2.4.1.Melting point determination
Melting point is the temperature at which the pure liquid and solid exist in equilibrium at an external pressure of 1 atmosphere. The Thiel’s tube method of melting point determination in liquid paraffin was used in the present study [8]
.
2.4.2.Solubility studies
Solubility studies of Lovastatin were carried out in methanol, phosphate buffer 7.4, PEG 200, Tween 80. Saturated solutions were prepared by adding excess drug to the vehicles and shaking on the shaker for 48 hr at 25 °C under constant vibration. Filtered samples (1 ml) were diluted appropriately with 0.1N hydrochloric acid solution and Lovastatin was determined spectrophotometrically at 2 3 8 nm. The average value of three trials was taken. Results are shown in Table no2
2.4.3.Physicochemical parameters
The color, odor and taste of the drug were recorded using descriptive terminology and found to be white to off-white crystalline powder, tasteless and odorless[9].
2.4.4.Determination of absorption maximum (λ max)
The wavelength at which maximum absorption of radiation takes place is called as λ max. This λ max is characteristic or unique for every substance and useful in identifying the substance.
141 2.4.5.Preparation of standard calibration curve for lovastatin
10 mg of pure drug was accurately weight and transferred into the 10 ml volumetric flask. The volume was made up using 0.1N NaoH to get a concentration of 1000 µg/ml. From this solution 1 ml was withdrawn into 10 ml volumetric flask and it was diluted to 10 ml with distilled water to get a concentration of 100 μg/ml. From this 0.5 ml, 1 ml, 1.5 ml, 2 ml, 2.5 ml, 3.0 ml were pipetted out into a 10 ml volumetric flask and diluted to 10 ml using distilled water to get concentrations of 5 μg/ml, 10 μg/ml, 15 μg/ml, 20 μg/ml, 25 μg/ml, 30 μg/ml respectively. Absorbance of this solution was measured at 238 nm using UV Spectrophotometer against blank.
2.4.6.Drug excipient compatibility
IR spectra scanning of pure drug Lovastatin, excipients 11 compacts were done in potassium bromide pellets at moderate speed between 400 to 4000 cm-1.
2.5.Pre-compression studies (Flow properties)
The flow ability of a powder is of critical importance in the production of pharmaceutical dosage forms in order to get a uniform feed as well as the reproducible filling of tablet dies, otherwise, high dose variations will occur. In order to ensure the flow properties of the liquid-solid systems, angle of repose measurements, Carr’s index and Hausner’s ratios were adopted [10].
2.5.1.Angle of repose (θ)
The angle of repose of powder blend was determined by the funnel method. The accurate weight of powder blend was taken in the funnel. The height of the funnel was adjusted in such a way that the tip of the funnel just touches the apex of the powder blend. The powder blend was allowed to flow through the funnel freely onto the surface. The diameter of the powder cone was measured and angle of repose (θ) was calculated using the following equation
.
θ= tan-1 h/r
Where, h and r are the height and radius of the powder cone.
2.5.2.Bulk density
Both loose bulk density (LBD) and tapped bulk density (TBD) was determined. A quantity of 2 gm of powder blend from each formula, previously shaken to break any agglomerates formed, was introduced into 10 ml measuring cylinder. After that, the initial volume was noted and the cylinder was allowed to fall under its own weight onto a hard surface from the height of 2.5 cm at second intervals. Tapping was continued until no further change in volume was noted. LBD and TDB were calculated using the following equations.
LBD= Weight of the powder blend/Untapped Volume of the packing
TBD=Weight of the powder blend/Tapped Volume of the packing
2.5.3.Compressibility index
The Compressibility Index of the powder blend was determined by Carr’s compressibility index. It is a simple test to evaluate the LBD and TBD of a powder and the rate at which it packed down. The formula for Carr’s Index is as below.
Carr’s Index (%) = [(TBD-LBD) x100]/TBD
2.5.4.Hausner’s ratio
Hausner’s ratio was calculated from the equation
142 2.6.Preparation of conventional tablet of pure lovastatin
Tablet containing Lovastatin was prepared by mixing 25 mg of drug with micro crystalline cellulose (avicel 102) ludiflash 10% (w/w) as a disintegrant and mixed for 10 min. Glidant and lubricant are added and then compressed by tablet punching machine.
2.6.1.Preparation of liquisolid compacts General method of preparation of liquisolid
A Drug was initially dispersed in the non-volatile solvent systems (PEG-200, PG, Tween 80) termed as liquid vehicles with different drug vehicle ratio.
Then a mixture of a carrier or different polymers and excipients were added to the above liquid by continuous mixing in a mortar. These amounts of the carrier and excipients are enough to maintain acceptable flow and compression properties.
To the above binary mixture disintegrant like Ludiflash and other remaining additives are added according to their application and mixed for a period of 10 to 20 min in a mortar.
The final mixture was compressed using the tableting machine to achieve tablet hardness.
Characterize the final liquid-solid granules for solubility, dissolution, flowability, compressibility [11].
2.6.2.Depiction of liquisolid compact
Figure 1 Depiction of liquisolid compact
2.6.3.Calculation of load factor
In order to address the flowability and compressibility of liquid-solid compacts, simultaneously, the "new formulation mathematical model of liquid-solid systems" was employed as follows to calculate the appropriate quantities of excipients required for producing liquid-solid systems of acceptable flowability and compressibility. This mathematical model was based on new fundamental powder properties (constants for each powder material with the liquid vehicle) called the flowable liquid retention potential (Φ-value) and compressible liquid retention potential (ψ-number) of the constituent powders (carrier and coating materials) [1, 2, 7, 8].
According to the new theories, the carrier and coating powder materials can retain only certain amounts of liquid while maintaining acceptable flow and compression properties. Depending on the excipients ratio (R) or the carrier coating ratio of the powder system used, where
R=Q/q ... (1)
As R represents the ratio between the weights of a carrier (Q) and coating (q) materials present in the formulation. An acceptably flowing and compressible liquid-solid system can be prepared only if a maximum liquid on the carrier material is not exceeded; such a characteristic amount of liquid is termed the liquid load factor (Lf) and defined as the ratio of the weight of liquid medication (W) over the weight of the carrier powder (Q) in the system, which should be possessed by an acceptably flowing and compressible liquid-solid system. i.e.
143 Spireas et al. [4] used the Flowable liquid retention potentials (Φ -values) of powder excipients used to calculate the required ingredient quantities, hence, the powder excipients ratios R and liquid load factors Lf of the formulations are related as follows
Lf = Φ + Φ (1/R) ... (3)
Where Φ and Φ are flowable liquid retention potential of carrier and coating material respectively.
So in order to calculate the required weights of the excipients used, first, from Eq. (3), Φ and Φ are constants, therefore, according to the ratio of the carrier/ coat materials (R), Lf was calculated from the linear relationship of Lf versus 1/R. next, according to the used liquid vehicle concentration, different weights of the liquid drug solution (W) will be used. So, by knowing both Lf and W, the appropriate quantities of a carrier (Qo) and coating (qo) powder materials required to convert a given amount of liquid medication (W) into an acceptably flowing and compressible liquid-solid system could be calculated from equation (1) and (2) [12].
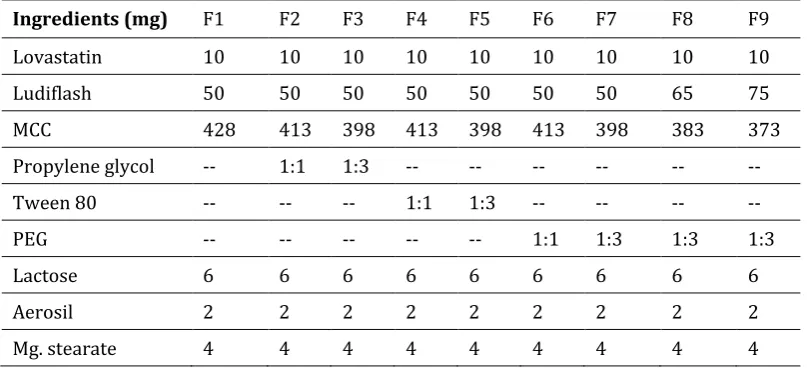
Table 1 Investigated formulations at a glance.
Ingredients (mg) F1 F2 F3 F4 F5 F6 F7 F8 F9
Lovastatin 10 10 10 10 10 10 10 10 10
Ludiflash 50 50 50 50 50 50 50 65 75
MCC 428 413 398 413 398 413 398 383 373
Propylene glycol -- 1:1 1:3 -- -- -- -- -- --
Tween 80 -- -- -- 1:1 1:3 -- -- -- --
PEG -- -- -- -- -- 1:1 1:3 1:3 1:3
Lactose 6 6 6 6 6 6 6 6 6
Aerosil 2 2 2 2 2 2 2 2 2
Mg. stearate 4 4 4 4 4 4 4 4 4
2.7.Post-compression studies evaluation parameters
2.7.1.Weight variation test
The test was performed as per USP by weighing 20 tablets individually on electric balance, calculating the average weight, and comparing the individual tablet weight to the average. Results are shown in Table 4.
2.7.2.Friability test
The test was performed using Roche friability. The device was rotated at 25 rpm for 100 revolutions. Friability was calculated by using following formula.
%F = 100(1-W0/W)
Where, W= final weight of tablets
W0= Original weight of tablets
2.7.3.Hardness
144 2.7.4.Drug content estimation
An accurately weighed amount of each preparation was dissolved in small volume of methanol and further diluted in phosphate buffer with pH of 7.4 buffer. The content of Lovastatin was determined spectrophotometrically at 238 nm using Uv‐visible spectrophotometer. Results are shown in Table no 5.
2.7.5.Disintegration time
The disintegration time was determined using disintegration test apparatus at 370C ± 20C. A tablet was placed in each of the six tubes of the apparatus and one disc was added to each tube. The time taken for complete disintegration of the tablet with no palpable mass in the apparatus was noted.
2.7.6.In vitro drug release study
The dissolution study was carried out using USP XXVII Apparatus I (LAB INDIA DS8000). The dissolution medium was 900 ml of phosphate buffer with a pH of 7.4 kept at 37 ± 5º C 15 mg Lovastatin tablet were kept in the baskets of dissolution apparatus rotating at 50 rpm. Samples of 5 ml were withdrawn at specified time intervals and analyzed spectrophotometrically at 238 nm using Shimadzu 1700 UV‐visible spectrophotometer, the samples withdrawn were replaced by fresh buffer solution. Each preparation was tested in triplicate and the mean values were calculated. Results are shown in table no 6 [13].
2.7.7.Mathematical modeling of drug release profile
The cumulative drug release from the formulated tablets at different time Intervals were fitted to zero order kinetics, first order kinetics, Higuchi model and Korsmeyer –Peppas model to characterize mechanism of drug release [14].
Zero order kinetic
It describes the system in which the drug release rate is independent of its concentration.
Qt = Qo + Ko t (1)
Where;
Qt= Amount of drug dissolved in time t
Qo = Initial amount of drug in the solution, which is often zero and
Ko = zero order release constant.
If the zero order drug release kinetic is obeyed, then a plot of Qt versus t will give a straight line with a slope of Ko and an intercept at zero.
First order kinetic
It describes the drug release from the systems in which the release rate is concentration depended.
log Qt = log Qo + kt/ 2.303 (2)
Where
Qt = amount of drug released in time t.
Qo = initial amount of drug in the solution
k = first order release constant
145 2.7.8.Stability studies of lovastatin 10 mg
The International Conference of Harmonization (ICH) Guidelines titled, “stability testing of New Drug substance and products”.ICH specifies the length of study and storage conditions.
Method
The selected formulations were packed in bottles, which are tightly plugged with cotton and capped. They were then stored at and 40 C / 75% RH for 3 months and evaluated for assay and in vitro drug release.
Storage conditions
Accelerated 40±2 C/75±5% RH
Intermediate 30±2 C/65±5% RH
Long term 25±2 C/60±5% RH
Testing intervals for
Accelerated Initial, 1, 2 & 3 months.
Long term Initial, 3, 6, 9, 12, 18, 24 & 36 months. Intermediate Initial, 3, 6, 9 & 12 months.
The optimized formula was selected for evaluation studies. Further stability study was done [15]
.
3.Results
3.1.API characterization
3.1.1.Physical properties
For a drug substance to formulate into a dosage form, it is necessary to study the physicochemical properties of the bulk drug.
Colour - white to off-white
State - crystalline powder
Melting point - 174 oC
Solubility - Solubility of Lovastatin in methanol, phosphate buffer 7.4, propylene glycol, poly ethylene glycol 200 and Tween 80 is given in the table (8).Lovastatin solubility is very high in PEG 200 as (4.5% (w/w)) compared to other. PEG, with a large nonpolar part and several hydroxyl groups is responsible for the enhanced solubility. Thus, among the solvents tested, PEG 200 could be a better choice as a solvent [8, 9].
Table 2 Solubility studies
Solvent Solubility(mg/ml)
methanol 6238 mg/ml
Phosphate buffer solution pH 7.4 0.0013 mg/ml
Propylene glycol 0.204 mg/ml
Polyethylene glycol 200 4.5% mg/ml
Tween 80 (10%) 0.1% mg/ml
146 3.1.2.Drug polymer interaction study
From the spectra of Lovastatin, combination of Lovastatin with excipient. It was observed that all characteristics peak of Lovastatin were present in the combination spectrum, thus indicating compatibility of the drug and excipient IR spectra are shown in figure.
Figure 2 IR spectra of Lovastatin
Figure 3 IR spectra of optimized formulation
3.1.3.Characteristic peaks in FT-IR spectra of lovastatin
147 observed. When compared with the pure drug the optimized formulation showed same Characteristic peaks .By the FT-IR studies it was confirmed that there was no interactions between pure drug and excipient.
Chemical interaction between drug and the polymeric material was studied by using FTIR. IR value of Lovastatin pure drug was observed no difference between the IR patterns of the physical mixture of Lovastatin and excipient, Lovastatin liquid-solid.
3.1.4.Standard calibration curve for lovastatin in 0.1 N NaOH
Figure 4 standard calibration curve for lovastatin
In Preformulation studies, it was found that, the wavelength of Lovastatin by spectroscopic method at 238 nm in NaOH. This complied with IP standards thus indicating purity of obtained drug sample and plot graph of absorbance V/s concentration between 10-100 µg/ml ranges. The Lovastatin calibration curve are shown in fig no.4
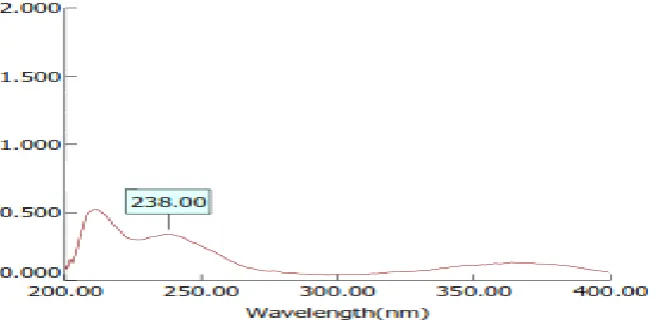
3.1.5.Determination of λmax
Determination of lovastatin λ-max was done in 0.1 N NaOH buffer medium for accurate quantitative assessment of drug dissolution rate.
Figure 5 UV spectrum of lovastatin 238nm
148 3.2.Pre-compression parameters
Table 3 Flow properties
Formulation Bulk density (gm/ml)
Tapped
Density(gm/ml)
Carr’s index (%)
Hasner ratio Angle of Repose(θ) F1 0.385±0.021 0.544±0.024 19.12±0.080 1.416±0.025 29.77±1.235 F2 0.363±0.031 0.435±0.033 15.87±0.045 1.186±0.035 27.16±1.423 F3 0.356±0.045 0.397±0.012 10.83±0.040 1.121±0.050 25.24±1.106 F4 0.343±0.038 0.409±0.010 14.85±0.023 1.172±0.031 26.98±1.561 F5 0.365±0.012 0.413±0.034 11.43±0.060 1.126±0.012 27.62±1.342 F6 0.314±0.024 0.394±0.025 20.28±0.012 1.257±0.026 24.55±1.566 F7 0.334±0.035 0.415±0.030 19.27±0.034 1.239±0.015 26.49±1.434 F8 0.343±0.042 0.409±0.019 14.85±0.016 1.172±0.026 26.98±1.061 F9 0.365±0.026 0.413±0.022 11.43±0.048 1.126±0.028 27.62±1.042
(n=3); ±S.D
The compressibility index (≤19.12), Hausners ratio (≤1.41) and angle of repose (≤29.77) values indicated a fairly good flowability of granules. Results are shown in (Table 3).
3.3.Post compression parameters
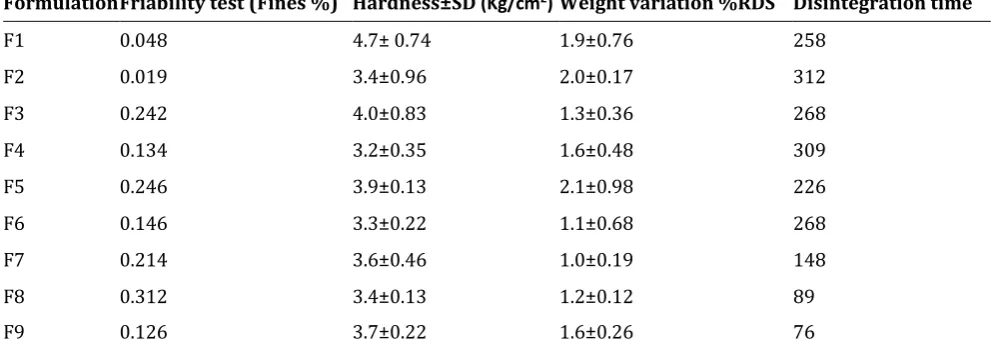
3.3.1.Hardness and friability Table 4 Hardness and friability
Formulation Friability test (Fines %) Hardness±SD (Kg/cm2) Weight variation %RDS Disintegration time
F1 0.048 4.7± 0.74 1.9±0.76 258
F2 0.019 3.4±0.96 2.0±0.17 312
F3 0.242 4.0±0.83 1.3±0.36 268
F4 0.134 3.2±0.35 1.6±0.48 309
F5 0.246 3.9±0.13 2.1±0.98 226
F6 0.146 3.3±0.22 1.1±0.68 268
F7 0.214 3.6±0.46 1.0±0.19 148
F8 0.312 3.4±0.13 1.2±0.12 89
F9 0.126 3.7±0.22 1.6±0.26 76
149 3.3.2.Drug content
Table 5 Estimation of drug content
Formula Drug content (%)
F1 95.23±2.2
F2 97.18±1.9
F3 96.19±1.7
F4 99.58±2.6
F5 96.21±1.1
F6 97.69±1.9
F7 98.59±1.2
F8 98.41±1.6
F9 99.06±1.5
Drug content of formulation F1-F9 were found to be in the range of 95.23-99.06%
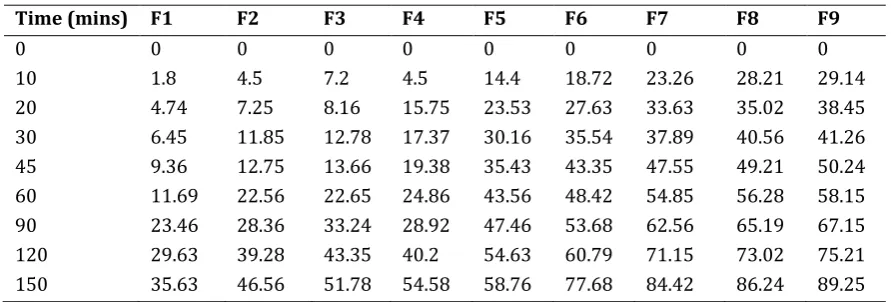
3.4.In vitro dissolution study
Apparatus II, solvent phosphate buffer pH 7.4 medium, volume 900 ml, rpm 100, temperature 37±5 C and λmax 238
nm.
Table 6 Invitro release data of lovastatin compacts
Time (mins) F1 F2 F3 F4 F5 F6 F7 F8 F9
0 0 0 0 0 0 0 0 0 0
10 1.8 4.5 7.2 4.5 14.4 18.72 23.26 28.21 29.14
20 4.74 7.25 8.16 15.75 23.53 27.63 33.63 35.02 38.45 30 6.45 11.85 12.78 17.37 30.16 35.54 37.89 40.56 41.26 45 9.36 12.75 13.66 19.38 35.43 43.35 47.55 49.21 50.24 60 11.69 22.56 22.65 24.86 43.56 48.42 54.85 56.28 58.15 90 23.46 28.36 33.24 28.92 47.46 53.68 62.56 65.19 67.15 120 29.63 39.28 43.35 40.2 54.63 60.79 71.15 73.02 75.21 150 35.63 46.56 51.78 54.58 58.76 77.68 84.42 86.24 89.25
3.4.1.Comparison of in vitro drug release of conventional tablet with the liquid solid compacts
150 Formulations F1, F2 and F3 containing Propylene Glycol (1:1, 1:3) in the above comparative in-vitro drug release formulation F3 (PG 1:3) shows better drug release i.e. 43.35% in 120 min.
Figure 7 Comparative invitro drug release of F1, F4, F5
Formulations F1, F4 and F5 containing Tween 80 (1:1, 1:3) in the above comparative in-vitro drug release formulation F3 (Tween80 1:3) shows better drug release i.e. 43.56% within 1 hr.
Figure 8 Comparative invitro drug release of F1, F6, F7
Formulations F1, F6 and F6 containing Polyethylene Glycol (1:1, 1:3) in the above comparative in-vitro drug release formulation F7 (PEG 1:3) shows better drug release i.e. 23.26% and 33.63% in 10 and 30 min
.
151 Formulations F1, F8 and F9 containing Polyethylene Glycol (1:3, 1:3) in the above comparative in-vitro drug release formulation F9 (PEG 1:3, MCC 373 mg) shows better drug release i.e. 89.25% in 150 min.
Figure 10 % CDR= cumulative percentage drug release
Among all the formulations F9 displays good drug release of 89.25% in 150 min. So F9 is considered as the optimized formulation.
3.4.2.Release kinetics
Table 7 Release kinetics of optimized formulation
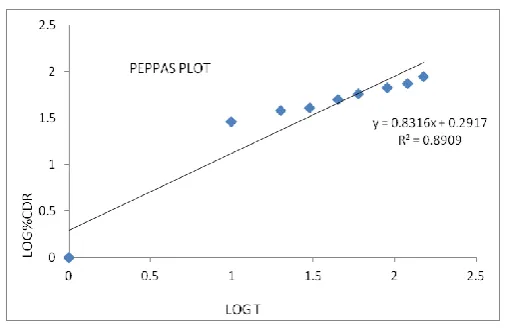
Order Zero First Higuchi Peppas n Value R2 value 0.8762 0.9536 0.9888 0.8909 0.831
Zero order release kinetic data of optimized formulation of Lovastatin compacts
Figure 11 Zero order F9
152 Figure 12 First order
Higuchi plot of optimized formulation of Lovastatin compacts
Figure 13 Higuchi plot
Peppas Plot of optimized formulation of Lovastatin compacts
Figure 14 Peppas plot
153 3.5.Stability studies
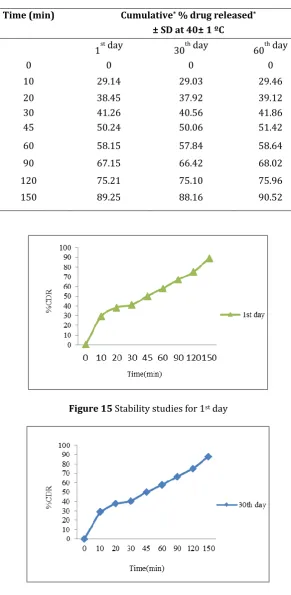
Table 8 In-vitro drug release data of the stability formulation (F9)
Time (min) Cumulative* % drug released*
± SD at 40± 1 ºC
1st day 30th day 60th day
0 0 0 0
10 29.14 29.03 29.46
20 38.45 37.92 39.12
30 41.26 40.56 41.86
45 50.24 50.06 51.42
60 58.15 57.84 58.64
90 67.15 66.42 68.02
120 75.21 75.10 75.96
150 89.25 88.16 90.52
Figure 15 Stability studies for 1st day
154 Figure 17 Stability studies for 60th day
From the above conducted stability studies of optimized formulation for about 90 days by comparing the results we can say that there is no change in the optimized formula on storage which indicates that it passes the stability studies.
4.Conclusion
The aim of this study was to improve the dissolution profile thereby increase solubility. From the results obtained from executed experiments, it can be concluded that the preformulation studies like melting point, flow properties UV-analysis of lovastatin complied with IP standards. The FTIR spectra revealed that there was no interaction between polymer and drug. Polymers used were compatible with Lovastatin. In vitro drug release of Lovastatin, compacts showed an increase in dissolution rate of Lovastatin. So PEG 200, Tween 80, PG could be an economic substitute as dissolution enhancing agent. Based on mathematical data revealed from models, it was concluded that the release data was best fitted with first order kinetics. Higuchi equation explains the diffusion controlled release mechanism, the diffusion exponent ‘n’ values were found to be in the range of 0.5 to 1.0 for the Lovastatin compacts indicating Non-Fickian diffusion. Among the PEG 200, Tween 80, PG PEG 200 in 13 ratios with the higher concentration of ludiflash (75mg) shows better drug release than the other formulations. The stability studies indicate that the optimized formulation was stable at the end of 90th day.
Compliance with ethical standards
Acknowledgments
With deep gratitude, we would like to thank the Management, CMR College of Pharmacy for providing all the necessary equipments and facilities in the college campus.
Disclosure of conflict of interest
The authors declare no conflict of interest.
References
[1] Ali N. (2005). The effect of type and concentration of vehicle on dissolution rate of poorly soluble drug from liquisolid compacts. Journal of Pharmacy and Pharmaceutical Sciences, 8(1) 18-25.
[2] Spires S and Sanford MB. (1999). Liquisolid Systems and Methods of Preparing Same. U.S. Patent, 5968550A. [3] Spires S. (2002). Liquisolid Systems and Methods of Preparing Same U.S. Patent, 6,423, 339B1.
[4] Spireas S and Sanford MB. (2000) Liquisolid systems, and methods of preparing same Patent, 6096337A. [5] Shyam J, Ravi KV, Madhavi K, Vamshi KM and Sudheer KD. (2014). Enhancement of solubility and dissolution
properties of lovastatin by liquisolid technique. International Journal of Research in Pharmacy and Chemistry, 4(3), 713-722.
[6] Ellsworth AJ, Witt DM, Dugdale DC. (2003). Medical Drug Reference. Elsevier science, Missouri, 610‐612. 0 10 20 30 40 50 60 70 80 90 100
0 10 20 30 45 60 90 120 150
%C
DR
Time(min)
155 [7] Ayres JW and Kapsi SG. (2001). Processing factors in the development of solid solution formulation of Itraconazole for enhancement of drug dissolution and bioavailability. International Journal of Pharmacy and Pharmaceutical Sciences, 229 193-203.
[8] Dhandapani B, eswara SM, Susrutha N, Rama S, Sonia RSK, Sarath T Seetharamanjaneyulu GV and Celestin RV. (2010). Spectrophotometric estimation of meloxicam in bulk and its pharmaceutical formulations. International Journal of Pharma Sciences and Research, (4), 217-221.
[9] Yousef Jz, Mohammad R, SiahiSolmaz, Asnaashari A and NOK hod chi. (2007). The liquid-solid technique as a tool for enhancement of poorly water-soluble drugs and evaluation of their physicochemical properties. Acta Pharm, 57 99-109.
[10] Yadav VB and Yadav AV. (2009). Liquisolid granulation technique for tablet manufacturing. Journal of Pharmacy Research, 2(4) 670-674.
[11] Spireas S. (2002). U.S. Patent No. 6,423,339. Washington, DC: U.S. Patent and Trademark Office.
[12] Vraníková B and Gajdziok J. (2013). Liquisolid systems and aspects influencing their research and development. Acta pharmaceutica, 63(4), 447-465.
[13] Spires S, Sadhu S and Grover R. (1998). In vitro release evaluation of hydrocortisone liquid -solid tablets. Journal of Pharmacy and Pharmaceutical Sciences, 87 867–872.
[14] Kellaway IW and Marriott C. (1975). Correlations between physical and drug release characteristics of polyethylene glycol suppositories. Journal of Pharmacy and Pharmaceutical Sciences, 641162-1166.
[15] Muthyala J, Singh SK, Gulati M, Kumar B, Rathee H, Ghai D, Kaur J, Pandey NK, Yadav A and Renuka. (2016). Systematic development and characterization of liquisolid compacts of atorvastatin-glipizide binary mixture to achieve enhanced dissolution and stability profile. Asian Journal of Pharmaceutics, 10(4), S1.
How to cite this article