R E S E A R C H
Open Access
Impact of linear correlation on construction
project performance using stochastic linear
scheduling
Ricardo Eiris Pereira
*and Ian Flood
Abstract
Background:In the construction industry, the productivity of all trades is directly impacted by uncertainty and variability. For repetitive projects, smooth work flow of productive resources is necessary to minimize or eliminate interruptions and idle time with the objective of reducing costs. An ideal or near optimal solution requires careful planning of the sequence, timing and resource allocations for each activity. Earlier research has demonstrated that uncertainty in the duration of repeated activities can have a significant impact on what is determined to be the optimum project plan. This suggests that correlation in the duration of repeated activities (where durations are stochastic) may also be important in determining the most favorable plan.
Methods:This study assesses the significance of correlation in this respect, using a Linear Scheduling framework for modeling repetitive construction work. Numerical and graphical results are used in a case study to evaluate and compare the optimal solution derived for both deterministic and stochastic environments. For the stochastic environment, a range of levels of correlation are considered using linear correlation between immediate successor repetitions of an activity.
Results:The results provide insight into the effects of different degrees of correlation on the expected project duration, cost, crew and equipment idle times and interruptions. The correlation level has effects that translate into performance tradeoffs depending on the initial plan assumptions applied to the activities.
Conclusions:The impact of full correlation on the optimality of a project plan was found, on average, to introduce idle time to crews equal to 7% of their active time, and to cause avoidable delays to the completion of a project equal to 12% of the project duration. The authors believe these inefficiencies justify further investigation of the impact of correlation on construction projects, including the development of more sophisticated models of correlation.
Keywords: Project planning, Stochastic linear scheduling, Linear correlation, Repetitive construction work, Risk management
Background
Many of the activities performed in construction are re-petitive in nature. Activity repetition is most prevalent at a low level in a work breakdown, such as the cycling of equipment in an earthmoving operation or the laying of bricks, but it is also common at intermediate and high levels, such as the laying of utility lines or the construc-tion of many similar floors in a high-rise building. Repetitive activities can be either discrete or continuous
processes but most planning tools are limited to one or other perspective. The critical path method (CPM), for example, treats all activities as discrete units - this is convenient for activities that are inherently discrete, but activities that are continuous in nature (such as the operation of a tunnel boring machine) must be con-verted into a series of discrete units of work.
Planning projects where there is significant repetition of activities becomes challenging using traditional activity network methods (such as CPM) because of the difficulty of ensuring continuity in resource utilization (Harris and Ioannou 1998) and the consequently large number of * Correspondence:[email protected]
College of Design, Construction and Planning, University of Florida, Gainesville, FL, USA
modeling repetitive activities requires careful attention to ensure accuracy since a small error in the estimate of a single repetition translates to a large error over many repetitions. Moreover, effects such as learning and for-getting (Gates and Scarpa, 1972) in repetitive activities can be dramatic and if not properly addressed can lead to significant errors in the estimation of project per-formance. Uncertainty in activity performance must also be taken into account since it can significantly impact the accuracy of project performance estimates. Ignoring uncertainty (using a deterministic analysis) leads to opti-mistic estimates of project performance for concurrent interacting processes, the so-called fallacy of averages. The PERT method is a relatively popular tool used for modeling uncertainty in construction schedules, but it only considers uncertainty along the deterministically derived critical path and therefore underestimates both project uncertainty and project duration. Consequently, the PERT method, while simple to use, is only suitable for projects that have a dominant critical path with a low probability of other paths becoming critical. Indeed, interactions between construction processes are usually sufficiently complicated that stochastic effects can only be modeled accurately using statistical sampling tech-niques, the most popular of which being the Monte Carlo method.
Recent years have seen an interest in developing optimization and satisficing methods for planning repeti-tive construction work. Ioannou and Srisuwanrat (2006, 2007, 2007a, 2007b) proposed and evaluated a technique for planning a smooth work flow for productive re-sources operating in conditions of uncertainty, set within a linear scheduling (LSM) framework.
Trofin (2004) and Flood et al. (2004) implemented a Monte Carlo analysis using the LSM framework to as-sess the impact of uncertainty on project duration, and activity idle time. It was shown that increasing the level of uncertainty not only increased the expected project duration but also changed the optimal schedule.
Rachmat et al. (2009) investigated stochastic simula-tion on repetitive projects to incorporate activity per-formance uncertainty in look-ahead scheduling. A case study was undertaken for the construction of a pipeline, where real data were collected in the field, fitted to a statistical distribution, and processed by a simulation
Processes that are naturally stochastic can also dem-onstrate correlation between the duration of repeated activities. Positive correlation means that if one activity (or repetition of an activity) takes longer than expected then the correlated activities (or repetitions of that activity) are also more likely to also take longer, and vice versa. Work on correlation between construction activities (repeated or otherwise) is minimal, but it is easy to demonstrate that positive correlation affects the statistical performance of a project by increasing kur-tosis, meaning that more of the variance in the per-formance of a project results from occasional larger deviations as opposed to more frequent smaller devia-tions. An outstanding question, however, is whether the effects of correlation significantly impact the optimality of a plan. This paper reports on ongoing research into this question. It introduces the questions being investi-gated and their rationale, the proposed approach to re-solving them, and the results from a series of experiments designed to assess the potential impact of correlation on project plan optimality. If correlation is found to impact plan optimality, then this will justify further work into the development and validation of more accurate models of correlation.
The paper provides a review of the concept of activity correlation in Activity correlation section. This is followed by a description of the modeling approach adopted in this study (Modeling approach section), and the experimental plan (Research plan section). The results and their analysis are then presented in Results and Discussion section, followed by a summary of the conclusions and recom-mendations for future work in the final section.
Methods
Activity correlation
excavation activities that operate in similar ground con-ditions, utilize the same crew, and/or are overseen by the same superintendent.
If correlation is perfect (often represented as correl-ation = ±1.0) then resolving the uncertainty for one ac-tivity will in effect fully resolve the uncertainty for the correlated activity. If, on the other hand, there is no cor-relation (corcor-relation = 0.0) then resolving the uncertainty for one activity will not resolve any of the uncertainty in the other activity. It follows from this that correlation could be partial, somewhere between 0.0 and 1.0 or 0.0
and −1.0. This study is concerned with determining the
significance of correlation in terms of its impact on the optimality of a project schedule. For this reason, a range of levels of correlation from 0.0 to 1.0 will be considered. Negative correlation will be outside the scope of this study, although it should be considered in future work since it is likely to occur in systems that, for example, in-clude information feedback such as the optimization of work processes in real time through‘lessons learned’.
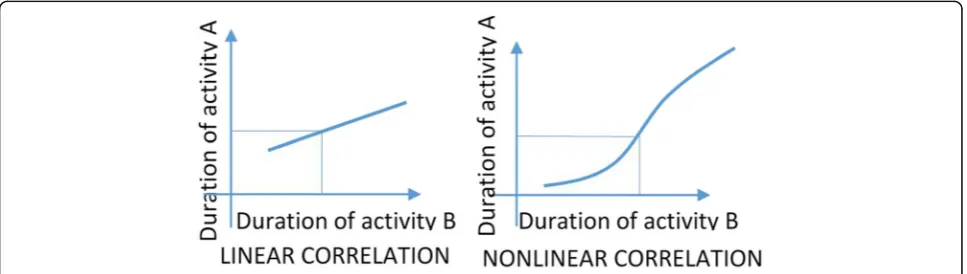
A dichotomy of correlation is into linear and nonlinear forms, as illustrated in Fig. 1 for perfect positive correl-ation. While it is possible that nonlinearity in the rela-tionship could affect the optimality of a plan, this study will focus on linear correlation only.
Activities that are repeated would seem strong candi-dates for demonstrating correlation since the durations of the repetitions will likely be determined by many common factors. Moreover, the impact such correlation may have on the optimality of a plan will likely com-pound over many repetitions and thus could quickly be-come significant. For this reason, this study will consider correlation that occurs between repetitions of an activity but not between different activities.
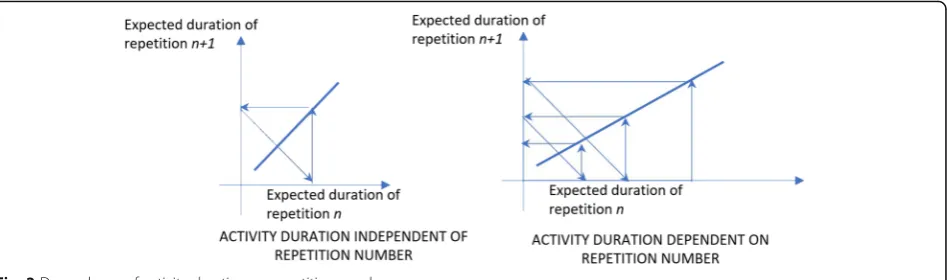
Figure 2 demonstrates the difference between activities where each repetition has the same expected duration (to the left) and activities where each repetition is dependent on the number of prior repetitions completed (to the right). Following the arrows on either part of the figure maps out the sequence of task durations that
would result in each case. To keep the study manage-able, parameters that affect the expected duration of subsequent repetitions of an activity (such as learning,
forgetting, and time-of-day/time-of-week dependent
fluctuations in production rates) will not be considered. More specifically, the expected duration will be the same for all repetitions of an activity so that only stochastic variance and correlation may affect the actual duration of subsequent repetitions of an activity.
Correlation between the durations of repeated activi-ties will be implemented by calculating a normalized weighting of the previous repetition duration and a sto-chastically generated duration. That is:
Dn¼ D
′
n ;n¼1
k⋅Dn‐1þð1−kÞ⋅D′n ;n≥2
ð1Þ
where:
Dn= the duration for the nthrepetition of the activity;
D′
n= a stochastically generated component for the duration of the nth repetition of the activity; Dn1 = the duration of the (n-1)threpetition of the activity; and
k= the correlation between the durations of subsequent repetitions (ranging from 0.0 for no correlation to 1.0 for perfect correlation).
While there is no published work to support any par-ticular model for representing correlation of durations for repetitive construction activities, the authors chose this approach since it is simple to implement. An alter-native approach, for example, could be to combine weighted durations of more than one previous repetition of an activity. Further work in this aspect of correlation modeling is required to determine the most appropriate model.
While the studies by Trofin (2004) and Flood et al. (2004) were concerned with how stochastic effects in
repetitive activities impact project performance, they gave no consideration to correlation. Implicitly their model had correlation set to k = 1.0 between the dura-tions of repetidura-tions of an activity in that all repetidura-tions of a given activity had the same duration. Rachmat et al. (2009) also gave no consideration to correlation, al-though in their case correlation was set implicitly to k = 0.0 in that a new duration was generated stochastically for each repetition of a given activity with no back refer-encing to any previously generated values.
Modeling approach Monte Carlo sampling
Stochastic analysis refers to the study and modeling of uncertainty with the objective of understanding its im-pact on performance, and is typically adopted in high risk projects. Uncertainty can be apparent in many dif-ferent aspects of a construction project (such as labor productivity, the timing of information supply, and the cost of material resources) complicating the tasks of pro-ducing accurate estimates of project cost and duration. This, in turn, makes it difficult to determine a competi-tive bid for a project or produce a supporcompeti-tive plan. Several approaches have been applied to handle uncer-tainty in construction, the two most popularly accepted
being Program Evaluation and Review Technique
(PERT), and Monte Carlo sampling. The Monte Carlo approach has been implemented within a number of construction planning tools including the linear schedul-ing method (Wyrozębski, and Wyrozębska, 2013), and is generally more accurate and versatile than the PERT method. Indeed, of the two methods Monte Carlo is the only one capable of incorporating correlation. For this reason, the Monte Carlo sampling method was adopted for this study.
Monte Carlo sampling allows many project outcomes to be evaluated statistically. Random sampling is per-formed to select values for uncertain parameters, typic-ally activity durations, with a probability of occurrence
that is characteristic of the uncertainties in the real pro-ject. The accuracy of the approach increases with the number of samples made of possible project outcomes. The procedure of fitting observed data to an appropriate duration distribution, and then randomly sampling for possibly thousands of alternative scenarios is a highly in-tensive computing process. This study will use the SciPy package from IPython (Pérez and Granger 2007) for Monte Carlo sampling since it provides a convenient framework for model development and analysis.
For this study, the expected durations and variances of activities will be allowed to differ but the expected dura-tions and variances for repetidura-tions of a given activity will be fixed.
Linear scheduling method
CPM is the most widely used method for project plan-ning but it is not the most appropriate method for every project. In particular, if the breakdown of a project is at a level that includes repetitive activities then these must be represented in a complex ladder network such as that shown in Fig. 3. In this example, the activity types (A, B,
C…) are performed in sequence implying a logical
de-pendence; similarly each repetition of a given activity
(A1, A2, A3,…) is performed in sequence implying that
there is a single crew available for all repetitions of an activity. Other network structures may occur but are likely to be equally complicated. Such a representation makes it difficult to visualize and avoid disruptions in the flow of work for crews. Moreover, these ladder net-works are cumbersome to develop, modify, and maintain given the large number of activity repetitions and dependencies.
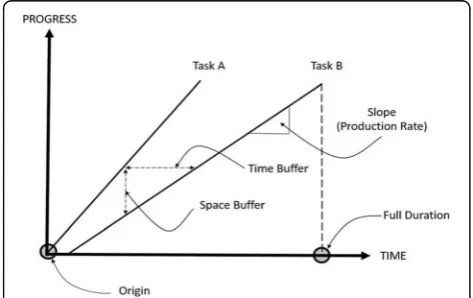
represents its production rate. The slope of the line may be straight if the productivity rate is constant or variable if the productivity changes from unit to unit. In real op-erations, variable productivity is more likely and results from many factors, such as quantity, quality, and com-plexity of work, as well as prevailing environmental conditions.
Concepts such as float can be read from a linear schedule (LS) and dependences are represented in the form of buffers which can be measured in the progress dimension as well as the time dimension. Referring to Fig. 4, the dashed lines between the two activity progress lines are a graphical representation of time buffer and space buffer. This creates a simple but visually insightful representation of the production rate of the crews and their potential space-time conflicts.
Once the visual representation of the work flow is established, less apparent patterns are reveled to the planner, simplifying the task of plan optimization.
This may involve adding more crews (including
equipment) to certain activities, adding more crew members (and/or other types of resources such as equipment) to certain activities, and/or changing the direction of flow of work.
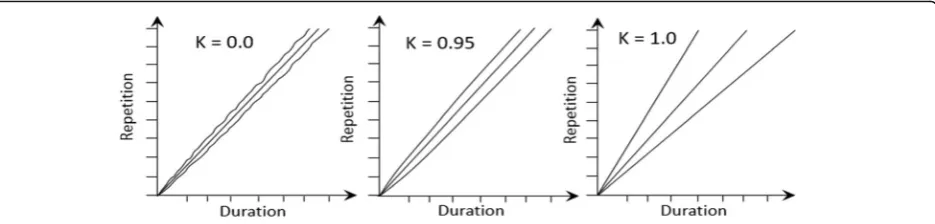
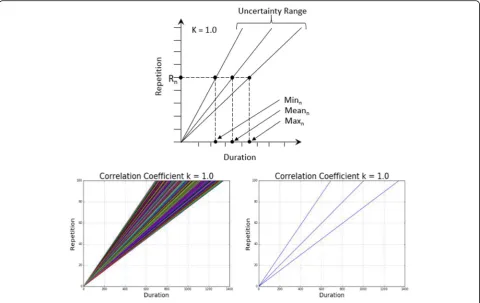
The effect of correlation and its potential relevance to plan optimization can be understood from Fig. 5. Each part of this figure represents the upper and lower bounds and mean from 10 Monte Carlo generated sam-ples of the progress of a repetitive activity for the indi-cated levels of correlation, presented in a LSM format.
Correlation was implemented in accordance with
Equation (1) for k = 0.0, 0.95, and 1.0 respectively. While the study will consider projects with several interacting activities as outlined in Research plan section below, the single activity plots of Fig. 5 clearly demonstrate how different levels of correlation affect the range of likely progress rates, the form of the distribution at given production milestones, and the expected rate of pro-duction. Given that an optimal plan is dependent on progress rates it seems likely from this visualization that the level of correlation will influence the specifics of the optimal plan while errors in the estimate of the level of correlation will impact the performance of a given plan.
Research plan
Objective function and objective variables
The aim of the study is to determine the impact of cor-relation between the durations of repeated activities on the optimality of the project plan. Specifically, the
ques-tion addressed is: How does a change in the level of
correlation from that expected affect the performance of the optimized project plan?
The two objective variables used in this study areCrew Idle Timeand Missed Opportunities. Crew Idle Time re-fers to the total period of time that the crews spend idle Fig. 4LSM graphical representation
or inoperative between their start and finish times. It is caused by interference between dependent crews, and requires one or other of the crews to cease operations intermittently or lower their production rate to avoid
any conflict. Figure 6a shows two examples whereCrew
Idle Time would have to be introduced (to activities B and D) to avoid the conflict. In either case, the clash may have been caused by the preceding activity progres-sing more slowly than expected and/or the succeeding activity progressing more quickly than expected. The Crew Idle Time would be the sum of these two periods
of time. Missed Opportunities refer to periods of time
that could have been saved in the execution of a project by starting crews earlier. Figure 6b includes two
exam-ples of Missed Opportunities for completing work
sooner, between activities A and B and between activities
C and D. TheMissed Opportunitieswould be the sum of
these two periods of time.
Missed Opportunities and Crew Idle Time are caused by stochastic and correlation effects that result in crew performance rates that are different from the determin-istically derived optimum base plan. This base plan as-sumes that each activity progresses at its expected rate and the start times for each activity are set to ensure that crews neither spend time idle nor miss any oppor-tunities for starting and finishing work sooner.Crew Idle Time represents an additional direct cost to the project in that the crews are employed for longer periods of
time to complete the specified amount of work. Missed
Opportunitiesrepresent an indirect cost to the project in
that they lead to a longer than necessary project dur-ation and therefore result in unnecessary project over-head costs.
Synthetically generated test projects
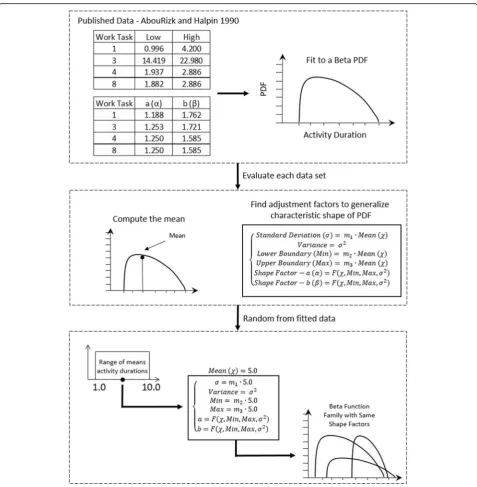
Investigation of the research question was completed for a sample of synthetically generated projects, similar to the approach reported by Trofin (2004) for assessing the impact of uncertainty on LSM plan optimality. The number of activities in each synthetically generated pro-ject was set to 10, a large enough number to permit complicated interactions between crews. Each activity was represented by its own Beta distribution which was used to generate the stochastic component of the duration of each repetition of that activity, the parameter D′n in
Equation (1). For construction simulations, the Beta distri-bution has been found to provide a good representation of the stochastic variance apparent in construction activities (AbouRizk et al. 1994).
The Beta distribution parameters for each activity were selected using Monte Carlo sampling based on the char-acteristic range of values for these parameters published in AbouRizk and Halpin (1990) for earthmoving opera-tions, as detailed in Eiris (2016) and summarized in Fig. 7. Referring to this figure, the data obtained were analyzed and fitted to a Beta distribution to acquire the remaining parameters required that define the corre-sponding distributions. From this process the mean (χ), the standard deviation (σ), and the variance (σ2) were
found. Subsequently, with the objective of generating the synthetic distributions, the data parameters for each
dis-tribution were recalculated using the mean (χ) as the
starting point to find a series of adjusting factors (m1, m2, m3) that represent the Beta family and the charac-teristics of the desired construction activity. Once the characteristic properties of the data were delimited, the synthetic data were created by randomly sampling from a range of mean durations from 0.0 to 10.0 units. The example presented in Fig. 7 illustrates the generation of
synthetic random activities by employing the adjust-ments factors previously calculated; through this method the Beta PDFs are acquired with the characteristics of the desired family of curves from the original earth-moving operations.
alternative outcomes for the project were generated using Monte Carlo sampling, and each activity was run for 100 repetitions. Figure 8 shows an example of 1000 samples for one activity (for k = 1.0) and its corre-sponding boundaries and mean.
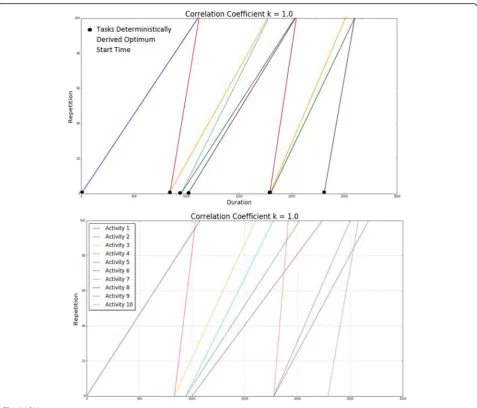
The first graph in Fig. 9 shows a deterministically de-rived LSM that has its activities optimally scheduled so
that the Crew Idle Time and Missed Opportunities are
both equal to zero. The second graph of Fig. 9 shows one of the 1000 stochastically sampled outcomes for this project where k = 1.0. It can be seen that the clashes
be-tween activities (resulting in Crew Idle Time) and the
gaps between succeeding activities (amounting toMissed
Opportunities) are numerous. The following section pro-vides a detailed statistical analysis of how such
ineffi-ciencies in project performance (Crew Idle Time and
Missed Opportunities) result from the level of correlation between activity repetitions.
Scope of study
Correlation is a many faceted problem and yet, as noted in Activity correlation section, its relevance to construction performance is not well understood. Consequently, this study is focused on whether and how correlation in its most
basic form may impact project performance. The
limitations assumed do not trivialize the problem: the type of work considered (repetitive construction) represents a broad scope of construction activity; and while the various assumptions made (such as linearity in correlation) may affect the accuracy of estimates of impact they are unlikely to lead to false conclusions about whether correlation is significant. The scope of the study was as follows:
The study is focused on linear construction work, such as occurs in tunneling, highway, high-rise, and pipeline construction operations.
Correlation was considered to occur between repetitions of an activity but not between different activities.
Correlation was assumed to have a linear relationship as described by Eq.1.
The expected duration for an activity did not vary with repetition. For example, deterministic variance resulting from, for example, learning and forgetting effects was not considered.
Stochastic variance in the durations of repetitions of an activity were assumed to be Beta distributed, and the parameters for this family of distributions were kept within the ranges observed in the study by AbouRizk and Halpin (1990).
Stochastic standard deviation was set to 16.9% of the expected duration for an activity.
Stochastic low boundary for the Beta distribution was set to 71.7% of the expected duration for an activity.
Stochastic high boundary for the Beta distribution was set to 39.5% of the expected duration for an activity.
Results and Discussion
The results of the experiments described above indicated that lower levels of correlation, between 0.00 and 0.80,
did not show a significant impact on either Crew Idle
TimeorMissed Opportunities. However, for higher levels of correlation both variables were found to increase geo-metrically. Therefore, an additional 1000 LSM scenarios were generated for each level of correlation ranging from
k = 0.80 to 1.00 in increments of 0.025, to provide a higher resolution in the results for the region where per-formance was found to change most dramatically.
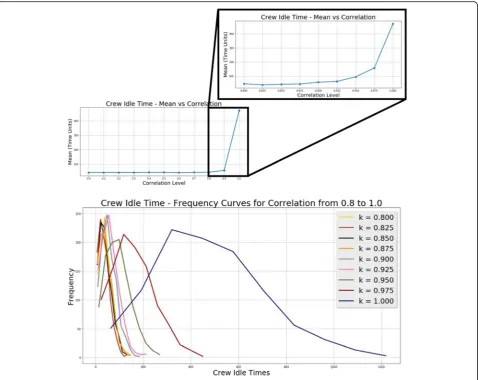
Figure 10 shows the results of these experiments for Crew Idle Time. The first graph shows how the mean Crew Idle Timechanges with respect to the level of cor-relation, for k = 0.0 to 1.0. Note, for values of k greater than 0.8 the resolution of the plot has been expanded from increments of 0.1 to 0.025. This was done since most impact on idle time occurs for values of k greater than 0.8. The second graph in the figure plots the
fre-quency of occurrence of different Crew Idle Times for
different levels of correlation, k. The performance of the project was most severely impacted when correlation
was perfect (k = 1.0), in which case the Crew Ide Time
additional 7% in the direct cost of the crews (excluding mobilization costs) and so is considered to be significant.
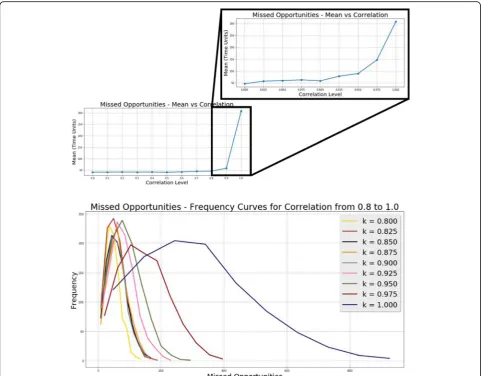
Figure 11 shows the same graphs as Fig. 10 but for Missed Opportunities. The same geometric increase in this objective variable is apparent for high levels of correlation. For perfect correlation, k = 1.0, the Missed Opportunities were approximately 12% of the optimum base plan’s project duration.
TheCrew Idle Timeand theMissed Opportunitiesdata were assessed in a single sample t-test to determine the statistical margin of standard error of the sample mean. Each level of correlation was tested independently using a confidence level of 95%. Table 1 shows the results of this test for different correlation levels. For Crew Idle
Timethe average margin of error from the sample mean
for all the correlation levels was 3.7%. Similarly, for Missed Opportunities the average margin of error from the sample mean for all the correlation levels was 3.61%. Given that these margins of error are all below 5% at the
95% confidence level, the sample size of 1000 LSM test scenarios was considered sufficiently large.
Conclusion
correlation is high (between k = 0.8 and k = 1.0), in the worst case having an expected crew idle time of 7% of crew active time and an expected extension to the project duration of 12%. These results are applicable to problems that fall within the scope of this study.
These results provide justification for investing re-sources in developing our understanding of how correl-ation can best be modeled in construction. These studies would, in part, be aimed at extending the study beyond the limitations listed in Scope of study section. For example, studies are required to determine whether correlation between the durations of construction ac-tivities should use linear or non-linear relationships,
and whether correlation between repetitions of an ac-tivity is best modeled as a dependence between imme-diate repetitions or between the first and current repetition. Future research must also include real-world data from a comprehensive range of construction project types.
Alternative indicators for project optimality should also be considered. In particular, there is a need to
deter-mine the extent to which theCrew Idle TimeandMissed
Opportunities could be reduced if an accurate assess-ment of the level of correlation was available and used to determine the optimal plan - the question is not straightforward as the systems performance is subject to
Table 1Experimental margin of error for each correlation level
Correlation Level (k) 0.0 0.1 0.2 0.3 0.4 0.5 0.6 0.7 0.8 0.9 1.0
Error - Crew Idle Time % 3.74 3.69 3.81 3.82 3.73 3.80 3.75 3.76 3.92 3.64 3.06
Error - Missed Opportunities % 3.76 3.62 3.73 3.65 3.58 3.74 3.67 3.47 3.32 3.45 3.73
by the journal.
Authors’contributions
IF: conceived of the study, participated in its design and coordination and the final draft arrangements of the manuscript. REP conceived of the study, participated in its design and interpretation of the data (statistical analysis) and drafted of the manuscript. Both authors read and approved the final manuscript.
Competing interests
The authors declare that they have no competing interests.
Publisher’s Note
Springer Nature remains neutral with regard to jurisdictional claims in published maps and institutional affiliations.
Received: 15 December 2016 Accepted: 16 April 2017
References
AbouRizk, S. and Halpin, D. (1990). Probabilistic Simulation Studies For Repetitive Construction Processes.Journal of Construction Engineering and Management, Vol. 116, No. 4, ASCE, ISSN 0733-9364/90/0004-0575
AbouRizk, S., Halpin, D., and Wilson, J. (1994). Fitting Beta Distributions Based on Sample Data.Journal of Construction Engineering and Management, 10.1061/ (ASCE)0733-9364(1994)120:2(288), 288–305.
Eiris Pereira, R. (2016). Impact of Linear Correlation on Construction Project Performance Using Stochastic Linear Scheduling. Master Thesis, Rinker School of Construction, University of Florida, Gainesville, FL.
Flood, I., Issa, RRA, and Troffin, I. (2004).“Optimization of Stochastic Linear Schedules”, in proceedings of 11th International Workshop, EG-ICE, Weimar, May 2004, pp 182–189.
Gates, M. and Scarpa, A. (1972) Learning and experience curves.Journal of the Construction Division, ASCE, 98(CO1), March, proceedings papers 8778, pp. 79–101.
Harris, R. and Ioannou, P. (1998).“Scheduling Projects with Repeating Activities.” Journal of Construction Engineering and Management, 10.1061/(ASCE)0733-9364(1998)124:4(269), 269–278.
Ioannou, P. G., and Srisuwanrat, C. (2006). Sequence Step Algorithm for Continuous Resource Utilization in Probabilistic Repetitive Projects. Conference Proceedings of the Winter Simulation Conference,WSC 2006, Monterey, California, USA, December 3–6, 2006.
Ioannou, P. G., and Srisuwanrat, C. (2007). Optimal Scheduling of Probabilistic Repetitive Projects Using Complete Unit and Genetic Algorithm.Conference: Proceedings of the Winter Simulation Conference, WSC 2007, Washington, DC, USA, December 9–12, 2007.
Ioannou, P., and Srisuwanrat, C. (2007a). Probabilistic Scheduling for Repetitive Projects.Conference: Lean Construction: A New Paradigm for Managing Capital Projects- 15th IGLC Conference 2007, Pages 498–507
Ioannou, P. G., and Srisuwanrat, C. (2007b). Simulation and Optimization for Construction Repetitive Projects Using Promodel and Simrunner.Conference: Proceedings of the 2008 Winter Simulation Conference, Global Gateway to Discovery, WSC 2008, InterContinental Hotel, Miami, Florida, USA, December 7–10, 2008.
Pérez, F., & Granger, E. G. (2007). IPython: a system for interactive scientific computing.Computing in Science and Engineering, 9(3), 21–29. doi:10.1109/ MCSE.2007.53.
Rachmat F., Song, L., and Lee, S. (2009).“Applying a Stochastic Linear Scheduling Method to Pipeline Construction”. Conference:3rd International Conference
Submit your manuscript to a
journal and benefi t from:
7Convenient online submission 7Rigorous peer review
7Immediate publication on acceptance 7Open access: articles freely available online 7High visibility within the fi eld
7Retaining the copyright to your article