O R I G I N A L A R T I C L E
Open Access
Multivariate-based classification of
predicting cooking quality ideotypes in rice
(
Oryza sativa
L.) indica germplasm
Rosa Paula O. Cuevas
1*, Cyril John Domingo
1,2and Nese Sreenivasulu
1*Abstract
Background:For predicting texture suited for South and South East Asia, most of the breeding programs tend to focus on developing rice varieties with intermediate to high amylose content in indica subspecies. However, varieties within the high amylose content class may still be distinguishable by consumers, who are able to distinguish texture that cannot be differentiated by proxy cooking quality indicators.
Results:This study explored a suite of assays to capture viscosity, rheometric, and mechanical texture parameters for characterising cooked rice texture in a set of 211 rice accessions from a diversity panel and employed multivariate approaches to classify rice varieties into distinct cooking quality classes. Results suggest that when the amylose content range is narrowed to the intermediate to high classes, parameters determined by rheometry and RVA become diagnostic. Modeled parameters distinguishing cooking quality ideotypes within the same range of amylose classes differ in textural parameters scored by a descriptive sensory panel.
Conclusions: Our results reinforced the notion that it is important to define cooking quality classes in indica subtypes based on multidimensional parameters, by going beyond amylose predictions. These predictive cooking models will be handy in capturing cooking and eating quality properties that address consumer preferences in future breeding programs. Policy implications of such findings may lead to changes in criteria used in assessing grain quality in the intermediate to high amylose classes.
Keywords: Grain quality, rapid Visco-analysis (RVA), random forest model, Rheology, Texture profile analysis
Background
In rice varietal improvement programs, the texture of cooked rice is primarily indicated by amylose content (AC) [Juliano 2006; Juliano et al. 2009]. This param-eter is used to classify rice into five AC classes asso-ciated with cooked rice texture: waxy (0–2%), very low (3–9%), low (10–19%), intermediate (20–25%), and high (> 25%) [Kumar and Khush 1986a; Kumar and Khush 1986b]. However, samples in the same AC class could have different sensory profiles [Cham-pagne et al. 2010], which suggest that within an AC class, rice varieties are still quite diverse in terms of cooking and eating quality. Attempts to fine-tune rice characterisation include introducing gel consistency
(GC) data to differentiate high-AC rice into soft and hard classes [Cagampang et al. 1973]; and gelatinisa-tion temperature (GT) to further differentiate samples within an AC class into different GT classes [e.g.,Yang et al. 2014; Pang et al. 2016]. Hence, rice variety de-velopment and improvement programs use these AC, GT, and GC indicators to develop breeding targets for specific markets. Other attributes, such as pasting properties and mechanical textural properties of rice varieties, also provide further insights into cooked rice texture. However, many of the findings still point to associations of texture with AC [e.g., Li et al. 2017; Hori et al. 2016; Tran et al. 2011; Li et al. 2016]; thereby effectively masking associations among these attributes with the diversity of rice germplasm within an AC class. It must be noted that many of the past studies used narrow ranges of germplasm to perform
* Correspondence:[email protected];[email protected]
1International Rice Research Institute (IRRI), College, Los Baños, Laguna,
Philippines
Full list of author information is available at the end of the article
associations within each AC class [e.g.,Yang et al.
2014; Tuaño et al. 2014; Garcia et al. 2011].
One of the best ways to determine the associations of other cooking quality factors with texture is to make AC a constant in studies. An approach is to focus analyses on waxy rice varieties, which have negligible concentra-tions of amylose. However, the global waxy rice market is small (only 1% of the rice trade); thus the waxy rice approach is not widely used [Calpe 2004]. The biggest market share for rice comes from those who prefer varieties with intermediate to high AC in South Asia and South East Asia [Tuaño et al. 2016; Calingacion et al.
2014]. Hence, insights on diversity of textural attributes would be most valuable from studies that focused on varieties coming from these two AC classes.
Information about other cooking quality attributes within an AC class may be obtained by further charac-terising the behaviour of starch during the cooking and the cooling process. Rapid Visco-Analysis (RVA) is rou-tinely used to determine the pasting behaviour of starch-water suspensions. The pasting curve provides metrics that indicate disintegration and retrogradation of starch, and is based on rheological principles [Zaidul et al.
2007; Fitzgerald et al. 2003; Doutch et al. 2012]. These metrics includepeak viscosity(PV, the maximum viscos-ity registered during the heating–holding stages), trough viscosity (TV, the minimum viscosity after PV), final viscosity (FV, the viscosity measurement at the end of the cooling stage), breakdown (BD, the difference be-tween PV and TV), lift-off (LO, the difference between TV and FV), andsetback(SB, the difference between FV and PV). The pasting curve also shows the pasting temperature (PTemp, temperature at the point at which the viscosity increase is greater than the set point for viscosity change rate) and thepeak time(PT, the time it took to reach PV) [Fitzgerald et al. 2003; Bao 2008]. On the other hand, reports of viscoelastic properties of starch pastes via rheometry typically mention the values for maximum storage modulus (G’max) and feature the curves for G’, loss modulus (G”), and tan (δ) [Hsu et al.
2000; Iturriaga et al.2006; Tsai and Lii2000]. Extracting more information from the viscoelastic curves could provide information about the diversity of rice varieties within the same AC class.
Texture parameters could be classified into three types: geometrical properties, mechanical properties, and properties related to moisture and fat content [Brandt et al. 1963]. Texture profiling using the Texture Analyser focuses on mechanical attributes. For cooked rice, four mechanical attributes measured by the Texture Analyser are applicable: hardness, adhesiveness, cohesiveness, and springiness [Champagne et al. 1998]. These mechanical attributes could provide more dimensions in rice charac-terisation within the same AC class.
Classification of diverse germplasm within intermediate and high AC classes based on multidimensional data such as those generated by RVA, rheometry, and texture ana-lysis will shed interesting insights about cooking and eat-ing quality. Such insights could then be obtained through dimension reduction and correlation studies applied to multidimensional cooking quality data. Predicted cooking quality classes can also be used to determine grain quality attributes that affect the market prices of rice varieties [e.g., Cuevas et al.2016; Unnevehr et al.1985].
In this study, multinomial logistic regression and ran-dom forests are the data mining techniques that were employed. The multinomial logistic regression is an extension of the binary logistic regression, a technique used to calculate the probability of membership in one of more than two nominal or unordered categories (out-come variables) based on maximum likelihood estima-tion [Dixit et al. 2015, reviewed in Madhu et al. 2014]. Random forests, on the other hand, is a prediction tool composed of a combination of decision trees that can be used for classification and to measure the importance of variables [Breiman 2001]. The importance of a variable is estimated based on increases in prediction error when the data for that variable is permuted while the data for other variables are kept unchanged [Liaw and Wiener
2002]. In other words, an important variable that has a considerable effect on the accuracy of classification can be identified through a random forest model [Ziegler and König2014].
To the best of our knowledge, these data mining tech-niques have not been applied to classify rice accessions based on cooking and organoleptic attributes. The obj-ectives of this study, therefore, were to (1) characterise the textural and cooking properties of a collection of rice varieties belonging to the intermediate- and to the high-AC classes; and (2) apply modeling techniques to predict distinct cooking quality ideotypes based on visco-elastic and textural attributes.
Methods Rice varieties
the sample was ground to fine powder (Cyclone Sample Mill 3010–030, Udy Corporation, Fort Collins, USA). The homogenized rice flour was used for various bio-chemical analyses.
Amylose content measurement
Amylose content (AC) was determined based on the col-orimetric reaction of the amylose-iodine complex devel-oped using the method of ISO 6647 [International Organization for Standardization2007a, 2007b]. In brief, 100 mg flour was suspended in ethanol (1 mL) and so-dium hydroxide (9 mL, 1 N). The suspension was then heated (95 °C, 10 min) to gelatinise the starch. Then, the sample was cooled to room temperature and the volume of the suspension was made up to 100 mL using deionised water. The starch in the gelatinised sample was injected into the glass transition lines of a San ++ Segmented Flow Analyser (SFA) system (Skalar Analytical B.V., AA Breda, The Netherlands); it was allowed to react with an aqueous solution containing 10% CH3COOH (1 N) and 30% KI-I2
(2%:0.2%) to form amylose-iodine complex. Absorbance of the sample’s amylose-iodine complex was measured at a wavelength of 620 nm and AC was quantified from a standard curve using varieties of known ACs (IR65, IR24, IR64, and IR8). The ACs of the varieties used in the standard curve were determined using the reference method of ISO 6647 [International Organization for Standardization 2007a, 2007b]. Samples were then classi-fied into AC classes using the AC ranges previously re-ported [Graham2002].
Gelatinisation temperature (GT) measurement
The GT of the rice samples were characterised through differential scanning calorimetry (DSC) as previously de-scribed [Cuevas et al. 2010]. In brief, milled rice flour (4 mg) was immersed in water (8 mg) and the suspension was hermetically sealed in aluminum pans. The sealed pans were then heated (25–120 °C), with temperature being increased at a rate of 10 °C min−1, using a DSC model Q100 (TA Instruments, DE, USA). Data on thermal transitions were collected and analysed using the Universal Analysis 2000 software. The peak of the endotherm was reported as the GT. Samples were classified as low-GT (below 67 °C), as intermediate-GT (68–73 °C), and as high-GT (GT≥74 °C) [Cuevas et al.
2010; Musyoki et al.2015].
Rapid Visco-analyses
Rice flour (3 g) was suspended in reverse osmosis-purified (RO) water (25 g) in a canister and viscosity changes were then measured using a Rapid Visco Analyzer (RVA, Model 4-D, Newport Scientific, Warriewood, Australia), follow-ing the heat (50–95 °C)–hold (95 °C)–cool (95–50 °C) time/temperature profile described in the AACC Method
61–02 [American Association of Cereal Chemists Inc
2000]. The time/temperature profile was controlled and the data was collected and processed using the Thermo-Cline for Windows (TCW) version 2.6.
Rheometry
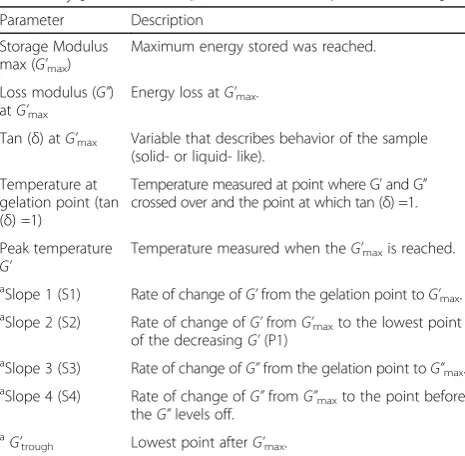
For each sample, rice flour was suspended in reverse-os-mosis water (1:2 (w/v)) and then placed at the centre of a Peltier plate of the Advanced Rheometer 2000 (TA In-struments, New Castle, DE). The rheometer was fitted with a parallel plate geometry (Ø = 40 mm). To minimise evaporation during the test, the sample was covered with a solvent trap sealed with water. During the test, the sample was subjected to heating ramp (35–95 °C) at 4 ° C min−1ramp rate then to a cooling ramp (95–35 °C) at the same ramp rate. The frequency of oscillation was set at 1 cycle per second (1 Hz). Measurements were per-formed in triplicate. The TA Advantage Software 2003 (version 4.0.0) was used to record the data (Table 1). Additional parameters were calculated using Microsoft Excel 2013 (Table 1, Additional file 2: Figure S1). The temperature at the gelation point (i.e., the crossover point where tan (δ) = 1), the loss modulus (G”) at G’max, the tan (δ) atG’max(the ratio of G” to G’at G’max), and the temperature atG’maxwere determined based on the G’and the G” curves. Slopes 1 and 3 (S1 and S3) were measured from the gel point (where tan (δ) = 1) toG’max
and G”max. Slope 2 (S2) was measured at G’max to the lowest point of the decreasingG’(G’trough) while Slope 4 (S4) was measured from G”max to the point before the
G”leveled off.
Table 1Description of the viscoelastic properties measured via rheometry [Hsu et al.2000; Ahmed et al.2008; Mandala2012] Parameter Description
Storage Modulus max (G’max)
Maximum energy stored was reached.
Loss modulus (G”) atG’max
Energy loss atG’max.
Tan (δ) atG’max Variable that describes behavior of the sample
(solid- or liquid- like).
Temperature at gelation point (tan (δ) =1)
Temperature measured at point where G’and G” crossed over and the point at which tan (δ) =1.
Peak temperature
G’
Temperature measured when theG’maxis reached.
aSlope 1 (S1) Rate of change of
G’from the gelation point toG’max. aSlope 2 (S2) Rate of change of
G’fromG’maxto the lowest point
of the decreasingG’(P1)
aSlope 3 (S3) Rate of change of
G”from the gelation point toG”max. aSlope 4 (S4) Rate of change of
G”fromG”maxto the point before
theG”levels off.
a
G’trough Lowest point afterG’max. a
Texture profile analyses
For each sample, 25 unbroken milled rice grains were submerged in 1 mL water for 15 min in a test tube, which was then covered to minimise water evaporation. The test tube was heated in a boiling water bath (20 min) and then placed in a water bath (50 °C) until texture profile analysis. Three cooking replications were conducted. Three cooked unbroken rice grains were subjected to a two-cycle compression test using a TA.XT-Plus Texture Analyser equipped with a cylin-drical probe (Ø = 35 mm, Stable Micro Systems Ltd., Surry, UK). The texture profile resulting from this two-compression test is composed of two sets of one positive and one negative curves, which can be divided into regions that represent downstrokes (increasing values) and upstrokes (decreasing values) (Additional file 2: Figure S2). Hardness(HRD, the peak of the first positive curve), adhesiveness (ADH, the area under the negative curve, representing the work required to pull the plunger from the sample on the base plate), cohe-siveness(COH, the ratio of the area of the second posi-tive curve to that of the first posiposi-tive curve), and
springiness(SPR, the ratio of the time elapsed from the upstroke to the peak in the second curve (T2) to the time elapsed from starting point to the peak of the first curve (T1), representing sample height recovery after the initial compression) [Lyon et al. 2000]. These pa-rameters were measured at 90% strain and test speed at 0.5 mm s−1. For each cooking replicate, three compres-sion replicates were conducted.
Protein content measurement
Crude protein content (PC) was measured using a modified protocol based on the automated colorimet-ric method (AACC Method 46–09) [AACC 2000]. A test portion of flour (50 mg) was digested in sulphuric acid (2 mL) with 1 g anhydrous potassium sulphate:se-lenium mixture (50:1, w/w) for 1 h at 370 °C. The sample was then cooled to room temperature and made up to volume (20 mL) with deionised water. It was kept overnight to allow for sedimentation. The liberated ammonium in the digest was then allowed to react with a solution containing sodium salicylate (0.94 M) and sodium nitroprusside (0.00026 M), and aqueous sodium hypochlorite (0.525%, also contained 30% Brij-35) while going through the glass transition lines in a San ++ Segmented Flow Analyser (SFA) sys-tem at 16 mL min−1. Absorbance values of the ammonia-salicylate complex were determined at λ= 660 nm. The % Kjeldahl N values of the samples were determined based on the linear relationship between absorbance and analyte concentration, following the Beer-Lambert Law. This linear relationship was based on a standard curve developed using ammonium
sulfate solutions with different concentrations. The crude PC was calculated by multiplying the Kjeldahl N value by 5.95 [Villareal et al.1991].
Statistics
Statistical analyses were carried out in R (version 3.3.2, released 2016). Ward’s cluster analysis was used to group the samples into three clusters based on 25 variables (AC, PC, RVA, advanced rheometry, and texture param-eters). The raw dataset was used in developing a multi-nomial logistic regression (MLR) model to identify different clusters using Eq. 1:
f Xið ;kÞ ¼βkXi; ð1Þ
where f(Xi,k) is the score associated with the sample i
assigned to clusterk (a non-binary categorical response variable), βkis the vector of regression coefficients
asso-ciated with clusterk, and Xiis the vector of explanatory
variables describing samplei.
Tests of random forests (RF) were conducted with 500 trees and three variables randomly selected at each split. These random forests generated standardised scores that indicated the importance of each of the nine retained variables (determined by MLR) in classifying samples into the three clusters and also identified the most important variables per cluster. To rank the vari-ables according to importance, the random forest algo-rithm determined the magnitude of increase in the prediction error (i.e., decrease in prediction accuracy) when the out-of-bag data were permuted (or excluded) for one variable while data for all other variables were held constant [Liaw and Wiener 2002; Louppe et al.
2013]. Hence, variables that had higher changes in mag-nitude of increases in prediction error were deemed more important than those variables that tend to have lower magnitudes.
Sensory evaluation
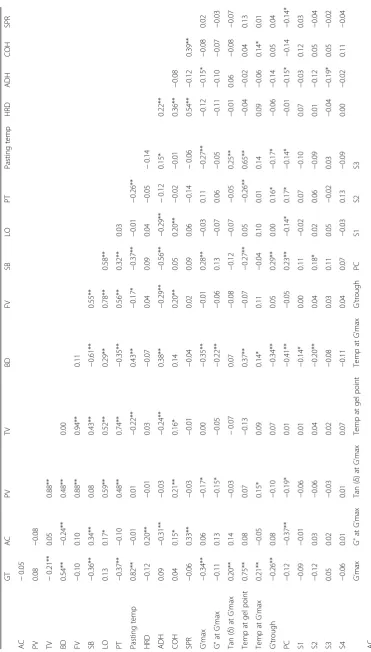
Table 2 Pearson correlation matrix GT AC PV TV BD FV SB LO PT Pastin g temp HRD ADH COH SP R AC − 0.05 PV 0.08 − 0.08 TV − 0.21 ** 0.05 0. 88** BD 0.54** − 0.24 ** 0. 48** 0.00 FV − 0.10 0.10 0. 88** 0.94** 0.11 SB − 0.36 ** 0.34** 0. 08 0.43** − 0. 61** 0.55** LO 0.13 0.17* 0. 59** 0.52** 0.29** 0.78** 0.58** PT − 0.37 ** − 0.10 0. 48** 0.74** − 0. 35** 0.56** 0.32** 0.03 Pas ting temp 0.82** − 0.01 0. 01 − 0.22** 0.43** − 0.17* − 0.37 ** − 0.01 − 0.26 ** HRD − 0.12 0.20** − 0.01 0.03 − 0. 07 0.04 0.09 0.04 − 0.05 − 0. 14 ADH 0.09 − 0.31 ** − 0.03 − 0.24** 0.38** − 0.29** − 0.56 ** − 0.29 ** − 0. 12 0.15* 0.22 ** COH 0.04 0.15* 0. 21** 0.16* 0.14 0.20** 0.05 0.20** − 0.02 − 0.01 0.36 ** − 0.08 SP R − 0.06 0.33** − 0.03 − 0.01 − 0. 04 0.02 0.09 0.06 − 0.14 − 0. 06 0.54 ** − 0.12 0.39** G ’ max − 0.34 ** 0.06 − 0.17* 0.00 − 0. 35** − 0.01 0.28** − 0.03 0.11 − 0.27 ** − 0.12 − 0.15 * − 0.08 0.02 G ” at G ’ max − 0.11 0.13 − 0.15* − 0.05 − 0. 22** − 0.06 0.13 − 0.07 0.06 − 0.05 − 0.11 − 0.10 − 0.07 − 0.03 Tan ( δ )a tG ’ max 0.20** 0.14 − 0.03 − 0.07 0.07 − 0.08 − 0.12 − 0.07 − 0.05 0.25** − 0.01 0.06 − 0.08 − 0.07 Temp at gel point 0.75** 0.08 0. 07 − 0.13 0.37** − 0.07 − 0.27 ** 0.05 − 0.26 ** 0.65** − 0.04 − 0.02 0.04 0.13 Temp at G ’ max 0.21** − 0.05 0. 15* 0.09 0.14* 0.11 − 0.04 0.10 0.01 0.14 0.09 − 0.06 0.14* 0.01 G ’ trou gh − 0.26 ** 0.08 − 0.10 0.07 − 0. 34** 0.05 0.29** 0.00 0.16* − 0.17 * − 0.06 − 0.14 0.05 0.04 PC − 0.12 − 0.37 ** − 0.19* 0.01 − 0. 41** − 0.05 0.23** − 0.14 * 0.17* − 0.14 * − 0.01 − 0.15 * − 0.14 − 0.14* S1 − 0.09 − 0.01 − 0.06 0.01 − 0. 14* 0.00 0.11 − 0.02 0.07 − 0.10 0.07 − 0.03 0.12 0.03 S2 − 0.12 0.03 − 0.06 0.04 − 0. 20** 0.04 0.18* 0.02 0.06 − 0.09 0.01 − 0.12 0.05 − 0.04 S3 0.05 0.02 − 0.03 0.02 − 0. 08 0.03 0.11 0.05 − 0.02 0.03 − 0.04 − 0.19 * 0.05 − 0.02 S4 − 0.06 0.01 0. 01 0.07 − 0. 11 0.04 0.07 − 0.03 0.13 − 0.09 0.00 − 0.02 0.11 − 0.04 G ’ max G ” at G ’ max Tan ( δ )a tG ’ max Temp at gel point Temp at G ’ max G ’ trough PC S1 S2 S3
Table
2
Pearson
correlation
ma
trix
(Continued)
Pas
ting
temp
HR
D
AD
H
CO
H
SP
R
G
’
max
G
”
at
G
’
max
0.78**
Tan
(
δ
)a
tG
’
max
−
0.12
0.50**
Te
mp
at
gel
point
−
0.43
**
−
0.
26**
0.12
Te
mp
at
G
’
max
−
0.79
**
−
0.
73**
−
0.15*
0.27**
G
’
trough
0.54**
0.44**
−
0.04
−
0.29**
−
0.
30**
PC
0.16*
0.01
−
0.19*
−
0.17*
0.05
0.20**
S1
0.39**
0.31**
−
0.01
−
0.16*
−
0.
28**
0.18*
0.04
S2
0.27**
0.19*
−
0.03
−
0.16*
−
0.
06
0.13
0.10
0.33**
S3
0.33**
0.34**
0.08
−
0.06
−
0.
20**
0.25**
0.06
0.39**
0.34**
S4
0.02
−
0.
04
−
0.10
−
0.16*
0.16*
0.11
0.01
0.34**
0.29**
0.49**
*
p
<
0.1,
**
p
<
0.05,
***
p
<
placed in sample cups once the panellists requested for the samples. A rice breeding line, IR06N155 (harvested in the dry season of 2013 at IRRI’s Long-Term Continu-ous Cropping Experiment), was used as a standard. It was served to the panellists six times, randomly distrib-uted in different rice tasting sessions.
The sensory panelists who participated in sensory evaluation were selected based on their availability and previous training in sensory descriptive profiling. The training phase included a battery of difference tests, sample and method familiarisation, and adjustment of the lexicon based on the panelists’contexts [Champagne et al.2010]. The rice samples used in the training phase were commercially available milled rice sold as Sinando-meng, Jasmine, and Long-grain rice.
The attributes tested during the rice tasting sessions represented the texture perceived at various stages of eating rice: from when the rice grains are first placed in the mouth up to after swallowing the rice. Panellists evaluate the intensity of each attribute on a 150-mm scale that has been adapted from established 15-point
reference scales [Goodwin Jr. et al. 1996]. The R soft-ware was used for statistical analyses. Means and stand-ard deviations were calculated per cluster.
Results and discussion
This study characterized cooking quality properties of 211 diverse rice accessions based on 25 cooking quality variables including those routinely tested in grain quality evaluation programs (AC, GT, PC, and RVA parameters) along with specialized traits to capture viscoelastic properties measured by rheometry (Table1) and textural properties measured by TPA. Previous publications indicate that many of these variables are correlated [e.g., Chung et al. 2011, Singh et al. 2006, Bao et al. 2006, Allahgholipour et al.2006, Vandeputte et al.2003, Tan and Corke2002, Xie et al.2011, Martin and Fitzgerald2002] and may thus be treated as redun-dant variables. In this study, it was determined that 10 of the 25 variables were highly correlated (r> 0.75 orr
<−0.75, Table2). Pasting temperature and temperature at the gel point were highly correlated with GT.
Although peak viscosity (PV) was highly correlated with trough (TV) and final (FV) viscosities; FV was also highly correlated with lift-off (LO) and TV. In addition, G’max was positively correlated with G” at G’max and negatively correlated with temperature at G’max. Thus, six of these correlated attributes (PT, temperature at gel point, TV, FV, G” Temp at G’max) were removed as redundant from the subsequent analyses and 19 vari-ables were retained, including GT, LO, G’max, and PV.
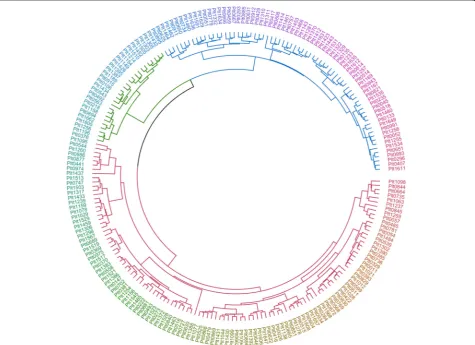
By employing Ward’s cluster analysis to 19 variables (Table 2), three distinct clusters were identified (Fig. 1). Among them, cluster 1 was the biggest, with 114 sam-ples, followed by cluster 2 with 70 samsam-ples, and by clus-ter 3 with 27 samples.
Clusters 1 and 2 have high AC; on the other hand, samples in cluster 3 could clearly be classified as inter-mediate AC (Table3, Fig.2a). Due to the similarities in ranges of AC between clusters 1 and 2, it is important to distinguish these two clusters based on visco-elastic parameters, through advance rheometry, and on tex-tural attributes. In the past, rice samples with similar ACs have been reported to have distinguishable textural properties [e.g., Champagne et al.2010; Champagne et al.1999]; hence, it is important to explore other indica-tors of cooking behaviors’ and organoleptic properties
in order to fine tune how rice varieties within the high AC classes are classified.
Gelatinisation temperature is (GT) often regarded as one of the most important factors affecting cooked rice quality and it is often viewed in combination with AC because an increase in AC reportedly leads to elevated GT [Juliano et al.2009; Yang et al.2014]. In this study, cluster 2 (high AC) and cluster 3 (intermediate AC) were clearly classified as high GT; on the other hand, cluster 1 (high AC) has been classified as low GT (Fig.
2a, Table3). This indicates that AC alone cannot con-tribute to increase in GT (Table 2). GT in addition, might potentially be influenced by medium chain length contribution of amylopectin (Miura et al.2018). In this context, starch structure would play an import-ant role to fine-tune the cooking quality ideotypes of the samples.
Protein content (PC) has been reported to affect cooked rice stickiness [Champagne et al. 2009] and surface hardness [Okadome 2005]. In this study, how-ever, the averages of PC for the three clusters ranged from 8.30 to 8.66% (Table 3), suggesting that PC is probably not a discriminatory factor for clustering these samples. While clusters 2 and 3 had similar ranges of PC, the cluster 1 appeared to have the widest range in PC (Fig. 2a). These results agree with a previ-ously published report that PC was not an attribute that can differentiate cooking quality classes within rice collections [Bett-Garber et al.2001].
The TPA provided measurements for HRD, ADH, COH, and SPR. The three clusters had similar values for HRD (Table 3), with ranges also observed in waxy rice [Boualaphanh et al. 2011]. This indicates further that AC did not solely affect HRD for the samples in this study, as these two parameters are weakly corre-lated (Table 2). However, due to the similarities in values, HRD potentially could not define the three quality clusters. Diversity lines differ for ADH ranged from 0.02 to 0.04 kg·sec, COH ranged from 0.42 to 0.44, and SPR from 0.10 to 0.11 (Table 3). The box plots indicated that the ranges of the textural attri-butes represented in clusters 1 and 2 overlapped such that it was difficult to separate the two clusters from each other (Fig. 2b).
Pasting parameters are additional indicators of or-ganoleptic quality, with parameters extensively studied particularly with their relationships with AC, PC, and mechanical texture attributes [reviewed in Champagne et al. 1999, Okadome et al. 2005, Yoenyongbuddhagal and Noomhorm2002]. Results indicated that the clus-ters 1 and 2 exhibited similar averages for the different pasting parameters (Table 3); however, the averages for BD and SB clearly distinguish cluster 3 from the other two clusters (Table 3). Cluster 3 had the lowest
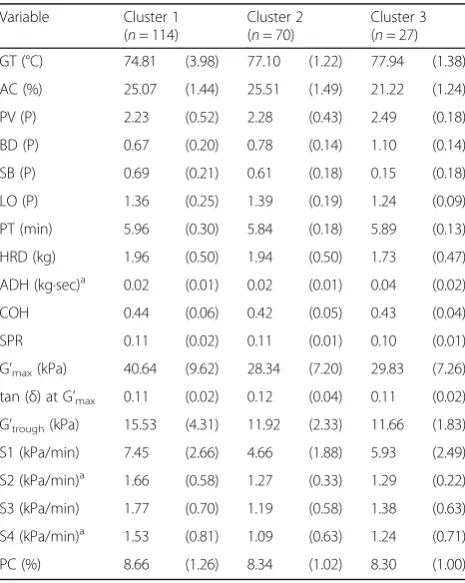
Table 3Means of 19 grain quality indicators of rice samples, by cluster. Standard deviations are indicated in parentheses
Variable Cluster 1
(n= 114)
Cluster 2 (n= 70)
Cluster 3 (n= 27)
GT (°C) 74.81 (3.98) 77.10 (1.22) 77.94 (1.38)
AC (%) 25.07 (1.44) 25.51 (1.49) 21.22 (1.24)
PV (P) 2.23 (0.52) 2.28 (0.43) 2.49 (0.18)
BD (P) 0.67 (0.20) 0.78 (0.14) 1.10 (0.14)
SB (P) 0.69 (0.21) 0.61 (0.18) 0.15 (0.18)
LO (P) 1.36 (0.25) 1.39 (0.19) 1.24 (0.09)
PT (min) 5.96 (0.30) 5.84 (0.18) 5.89 (0.13)
HRD (kg) 1.96 (0.50) 1.94 (0.50) 1.73 (0.47)
ADH (kg·sec)a 0.02 (0.01) 0.02 (0.01) 0.04 (0.02)
COH 0.44 (0.06) 0.42 (0.05) 0.43 (0.04)
SPR 0.11 (0.02) 0.11 (0.01) 0.10 (0.01)
G’max(kPa) 40.64 (9.62) 28.34 (7.20) 29.83 (7.26)
tan (δ) at G’max 0.11 (0.02) 0.12 (0.04) 0.11 (0.02)
G’trough(kPa) 15.53 (4.31) 11.92 (2.33) 11.66 (1.83)
S1 (kPa/min) 7.45 (2.66) 4.66 (1.88) 5.93 (2.49)
S2 (kPa/min)a 1.66 (0.58) 1.27 (0.33) 1.29 (0.22)
S3 (kPa/min) 1.77 (0.70) 1.19 (0.58) 1.38 (0.63)
S4 (kPa/min)a 1.53 (0.81) 1.09 (0.63) 1.24 (0.71)
PC (%) 8.66 (1.26) 8.34 (1.02) 8.30 (1.00)
a
setback among the three clusters (Table3). This agrees with previous reports that indicate that setback and AC are correlated [e.g., Allahgholipour et al.2006; Tan and Corke 2002; Chen et al. 2008]. Cluster 3 also has the highest BD (Table 3), indicating that the samples
in this cluster are most resilient to continuous agita-tion stress.
Although most of the traditional grain quality parame-ters (AC, PC, GT and viscosity profiles of RVA) could not distinguish high-AC accessions represented within
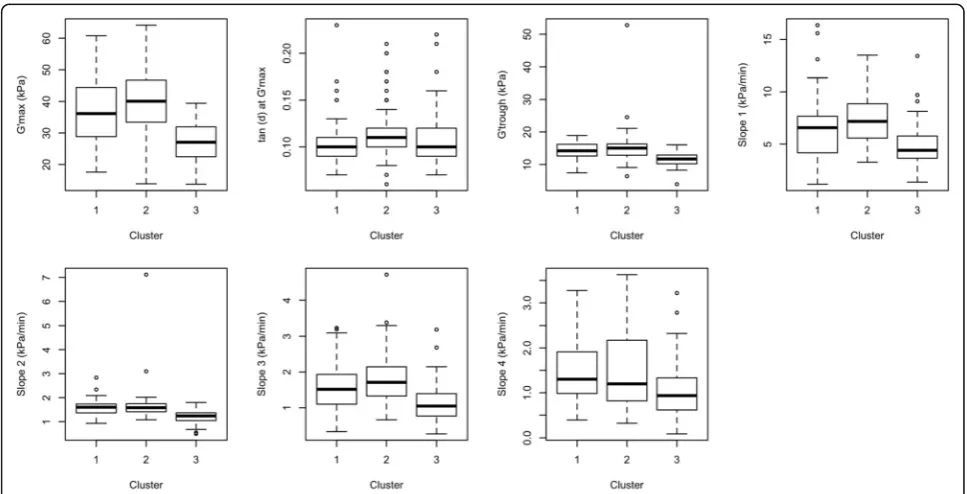
Fig. 3Boxplots of the three clusters of rice samples for rheometry parameters: G’max, tan (δ) at G’max, G’trough, Slope 1 (G’), Slope 2 (G’), Slope 3 (G”), Slope 4 (G”)
clusters 1 and 2, rheometry parameters have shown a nice range of differentiation between cluster 1 and 2 (Table3 and Fig.3). Cluster 1 represented lines had the highest averages for G’max and G’trough while the other two clusters had similar values. Likewise, cluster 1 could clearly be distinguished from cluster 2 and cluster 3 based on S1, S2, S3, and S4 derived from the rheometer curves (Table3and Fig.3).
In breeding programs, rice cooking quality classifica-tion is typically based on AC, GC, and GT considered individually [e.g., Juliano et al. 2009; Bett-Garber et al.
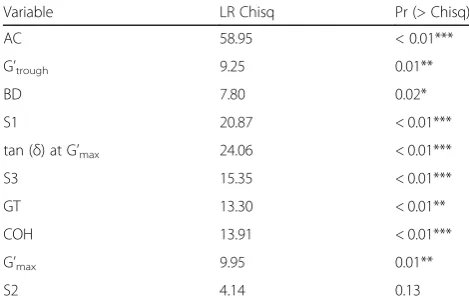
2001]. Although influence of AC on cooking quality is helpful when considering diverse rice collections con-taining both japonica and indica rice, the classical means of quality classification will probably not work when dealing with rice varieties within the same AC class in an indica germplasm collection. This study, therefore, used MLR (Eq. 1) in categorising the samples within the high-AC groups by including multiple vari-ables in a classification model for cooking quality ideo-types. The “Forward Selection (Akaike Information Criterion, AIC)” allows stepwise selection to exclude the multi-collinear variables from the model. Through this step, 10 out of 19 variables were retained in the model, most of which were significant (p< 0.05) in the likelihood ratio test (Table 4). The 10 attributes which contributed significantly to the model included AC and GT from routine grain quality parameters; BD from RVA; G’max,tan (δ), G’trough, S1, S2, and S3 from rheo-metry; and COH from TPA. The model has high classi-fication accuracy (93.84%, Table 5) with sufficient explanatory power, as indicated by the change in – 2Loglikelihood in the final model (χ2= 339.66, df = 18,
p< 0.01, Table 5). Also, the pseudo-R2values indicate high levels of fit to differentiate clusters represented by cooking quality groups (Table5).
The magnitudes of the coefficients (i.e., multinomial log-odds) differed across clusters (Table 5); however, these do not indicate the importance of these variables in explaining the model. The relative importance of these variables was determined via random forest. Re-sults show that AC was the most important variable in defining Cluster 3 (Fig.4); this is expected because this cluster has the lowest AC values (Fig. 2a and Table 3). On the other hand, the two most important variables differentiating clusters 1 and 2 were rheometry parame-ters, S1 and G’max. Amylose content ranked third in im-portance for both clusters, perhaps because AC can differentiate these two clusters from Cluster 3. The MLR model (Table 5) indicates that for every unit in-crease in BD, tan (δ) at G’max, and GT, the multinomial log-odds distinguished accessions represented in cluster 1 from cluster 2. Meanwhile, for every unit increase in G’trough, S1, S3, COH, and G’max, the multinomial log-odds that the sample belonged to cluster 2 rather than to cluster 1 decreased.
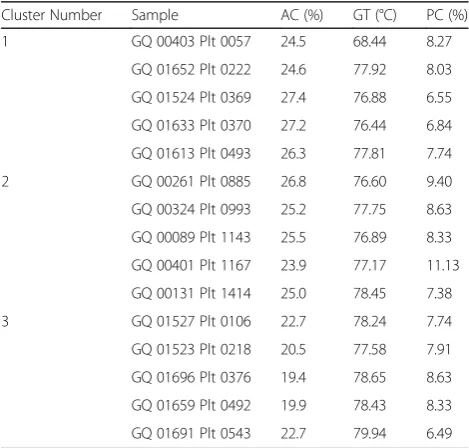
The capacity to differentiate between rice varieties within the same AC class through instrumental means becomes truly important if the differences can be de-tected by rice consumers. Hence, five samples from each cluster were subjected to descriptive profiling for texture
Table 5Summary of multinomial logistic regression for variables characterising the different rice quality clusters. Cluster 1 is not shown in Table5because it is the reference cluster. Table5
indicates the multinomial log-odds that samples represented in Cluster 2 or in Cluster 3, were compared to reference cluster 1 to calculate every unit increase or decrease in the different grain quality attributes included in the multinomial logistic regression model
Grain quality attribute
Estimate
Cluster 2 Cluster 3
Intercept −25.51 (15.27) 3.61 (0.08)***
AC (%) 0.08 (0.30) −9.17 (2.94)***
G’trough −0.33 (0.19)* −1.48 (0.93)
BD 0.06 (0.03)** 0.72 (3.55)
S1 −0.88 (0.22)*** −1.37 (3.20)
tan (δ) at G’max 0.55 (0.14)*** 0.21 (11.71)
S3 −2.84 (0.84)*** −0.12 (0.66)
GT 0.54 (0.18)*** 2.03 (6.97)
COH −0.24 (0.08)*** 0.01 (11.97)
G’max −0.15 (0.06)*** 0.22 (8.68)
N 70 27
Note: Total N = 211; AIC = 106.20; Overall classification accuracy: 93.84% Reference category for the regression model is cluster 1 (n = 114) Standard errors of the estimates are indicated in parentheses *p< 0.1, **p< 0.05, ***p< 0.01.
Goodness-of-fit statistics: Residual Deviance = 66.20; Degrees of freedom = 18
–2Log-likelihood: The intercept-only model: 405.87; The final model: 66.20; χ2
= 339.66;p< 0.01 Pseudo-R2
: McFadden = 0.84; Cragg & Uhler = 0.94; Cox & Snell = 0.80
Table 4Likelihood ratio (LR) test
Variable LR Chisq Pr (> Chisq)
AC 58.95 < 0.01***
G’trough 9.25 0.01**
BD 7.80 0.02*
S1 20.87 < 0.01***
tan (δ) at G’max 24.06 < 0.01***
S3 15.35 < 0.01***
GT 13.30 < 0.01**
COH 13.91 < 0.01***
G’max 9.95 0.01**
S2 4.14 0.13
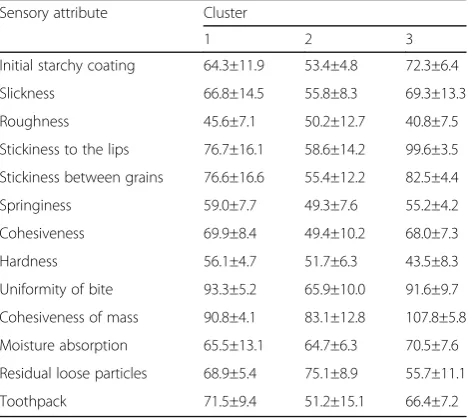
by a trained sensory panel (Table 6, Additional file 3: Table S1). The sensory profiles generated for textural at-tributes were compared (Fig. 5, Table 7). It was notable that clusters 1 and 2 had similar ranges of AC but had distinguishable sensory attributes. There was a remark-able difference between clusters 1 and 2 in terms of stickiness (both to the lips and between grains), cohe-siveness, cohesiveness of mass, toothpack, and uniform-ity of bite. Furthermore, accessions representing cluster 1 were perceived to be slightly harder and springier than accessions from cluster 2, although both have high AC
ranges. These results suggest that lines represented in clusters 1 and 2, distinguished initially based on rheome-try and mechanical texture properties, could be differen-tiated by humans (Table 7). This further suggests that there may be relationships among force-related textural attributes perceived by people, rheological properties, and those attributes measured by texture profile ana-lyses; and these attributes may distinguish lines with high-AC content. The differences in sensory profiles be-tween clusters 1 and 3 appear to be related to moisture absorption, residual loose particles, and initial starchy coating (Fig. 5). Results also indicate that, despite the difference in AC class, accessions representing cluster 3 were similar to samples in cluster 1 in terms of cohesive-ness, cohesiveness of mass, roughcohesive-ness, slickcohesive-ness, sticki-ness between grains, and toothpack. Attributes such as cohesiveness, cohesiveness of mass, toothpack, and uni-formity of bite have not been explored as deeply as the force-related textural properties.
Conclusions
To predict cooking quality ideotypes of indica rice with intermediate-to-high AC, we used 25 variables covering routine cooking quality predictors, RVA, rheometry, and instrumental texture profiling. Results showed that these intermediate- and high-AC samples could be clas-sified into two distinct clusters using 19 variables. Clus-ters 1 and 2 both contained samples with high-AC while cluster 3 had samples with intermediate AC. This is the first study in which MLR was used to further dif-ferentiate high-AC samples using rheometry, TPA, and RVA parameters simultaneously. The differences in sensory profiles between the two clusters validate the use of rheometric properties as proxy metrics to distin-guish cooking and eating quality within high-AC
Fig. 4Importance of the nine grain quality variables included in the final MLR model in each cluster, as calculated using Random Forests
Table 6Samples that underwent descriptive sensory profiling from the three clusters and their values for AC, GT, and PC. IDs linked to accession names have been described in Additional file3: Table S1
Cluster Number Sample AC (%) GT (°C) PC (%)
1 GQ 00403 Plt 0057 24.5 68.44 8.27
GQ 01652 Plt 0222 24.6 77.92 8.03
GQ 01524 Plt 0369 27.4 76.88 6.55
GQ 01633 Plt 0370 27.2 76.44 6.84
GQ 01613 Plt 0493 26.3 77.81 7.74
2 GQ 00261 Plt 0885 26.8 76.60 9.40
GQ 00324 Plt 0993 25.2 77.75 8.63
GQ 00089 Plt 1143 25.5 76.89 8.33
GQ 00401 Plt 1167 23.9 77.17 11.13
GQ 00131 Plt 1414 25.0 78.45 7.38
3 GQ 01527 Plt 0106 22.7 78.24 7.74
GQ 01523 Plt 0218 20.5 77.58 7.91
GQ 01696 Plt 0376 19.4 78.65 8.63
GQ 01659 Plt 0492 19.9 78.43 8.33
ranges. This study calls for a deeper look into variables extracted from rheometry and descriptive sensory evaluation, as these could enhance our capacity to clas-sify rice into quality classes that match consumer pref-erences. A deeper understanding about these attributes will be important as breeding strategies become
increasingly reliant on product profiles. The capacity to measure these attributes in an efficient and quantitative manner can also help set standards that can be used for developing policy and trade recommendations to cap-ture the cooking and eating quality properties of rice in varietal development programs. These rice quality rec-ommendations will be handy as rice-growing countries continue to strive to supply domestic and export needs.
Additional files
Additional file 1:Table S4.Phenotype data of grain quality cooking and eating quality parameters, rapid viscosity analyzer, advance rheometry and texture attributes of core collection panel. (XLSX 66 kb)
Additional file 2: Figure S1.Storage (G’) and loss moduli (G”) curves of GQ00043-PLT1298 (1:2 w/vflour: water ratio) obtained during heating and cooling steps in a rheometer. The parameters defined in therheometry profiles are described in Table1.Figure S2.A typical two-compression TPA curve obtained from a texture analyzer. Hardness(kg) is peak force of the first compression (H1). Adhesiveness is the negative force area of the first bite.Cohesiveness is the ratio of the positive force area during the second compression portion to that during thefirst compression (A2/A1). Springiness is defined as the ratio of T2 to T1, where T1 is total distance travelledby the probe on downstroke and T2 is distance traveled on downstroke by the probe from point of samplecontact to end of downstroke (T2/T1). (ZIP 214 kb)
Additional file 3:Table S1.Designations of samples used for sensory evaluation, selected from the three clusters.Table S2.Data used for multivariate analyses for the samples selected for sensory evaluation.
Fig. 5Box plots comparing the three clusters based on 13 texture attributes evaluated by sensory panelists based on a 150-mm scale. The sensory attributes [13] evaluated were: cohesiveness (COH), cohesiveness of mass (COH_MASS), hardness (HRD), initial starchy coating (ISC), moisture absorption (MOIST_ABS), residual loose particles (RLP), roughness (ROUGH), slickness (SLICK), springiness (SPR), stickiness between grains (STK_GRAINS), stickiness to the lips (STK_LIPS), toothpack (TPK), uniformity of bite (UOB)
Table 7Comparison of intensities of sensory attributes based on descriptive test conducted through panel evaluation
Sensory attribute Cluster
1 2 3
Initial starchy coating 64.3±11.9 53.4±4.8 72.3±6.4
Slickness 66.8±14.5 55.8±8.3 69.3±13.3
Roughness 45.6±7.1 50.2±12.7 40.8±7.5
Stickiness to the lips 76.7±16.1 58.6±14.2 99.6±3.5
Stickiness between grains 76.6±16.6 55.4±12.2 82.5±4.4
Springiness 59.0±7.7 49.3±7.6 55.2±4.2
Cohesiveness 69.9±8.4 49.4±10.2 68.0±7.3
Hardness 56.1±4.7 51.7±6.3 43.5±8.3
Uniformity of bite 93.3±5.2 65.9±10.0 91.6±9.7
Cohesiveness of mass 90.8±4.1 83.1±12.8 107.8±5.8
Moisture absorption 65.5±13.1 64.7±6.3 70.5±7.6
Residual loose particles 68.9±5.4 75.1±8.9 55.7±11.1
Table S3.Sensory evaluation scores1for the fifteen rice accessions from the three clusters. (DOCX 30 kb)
Abbreviations
AC:Amylose content; ADH: Adhesiveness; COH: Cohesiveness; DSC: Differential scanning calorimetry; FV: Final viscosity; GT: Gelatinisation temperature; HRD: Hardness; LO: Lift-off; MLR: Multinomial Logistic Regression; PC: Protein content; PV: Peak viscosity; RVA: Rapid Visco-Analysis; SB: Setback; SPR: Springiness; TPA: Texture profile analysis; TV: Trough viscosity
Acknowledgments
The authors thank Valerien Pede, IRRI Agri-Food Policy Platform, for assistance in conducting MLR and in interpreting the results. The authors also acknowledge support of other IRRI staff, Lucena Samadio for conducting texture profile analyses; Lilia Molina and the staff of the Grain Quality and Nutrition Service Laboratory (GQNSL) for performing amylose content and RVA measurements; and Roslen Anacleto, Roldan Ilagan, Artemio Madrid, Jr., and Fernando Salisi for growing the core collection.
Funding
The cost of data collection and grain quality analyses were covered through the funds available from the Global Rice Science Partnership (GRISP), the CGIAR Research Program on Rice Agri-Food Systems (RICE), Stress-Tolerant Rice for Africa and South Asia (STRASA) Phase III for BMGF funding, and the Philippine Department of Science and Technology’s Accelerated Science and Technology Human Resource Development Program National Science Consortium (ASTHRDP-NSC).
Availability of data and materials
All data supporting the conclusions of this article are provided as figures, tables and supplementary figures.
Authors’contributions
NS and RPC conceived and designed the experiments. CJD performed experiments and analysed the data together with RPC. All authors wrote the paper. All authors read and approved the final manuscript
Authors information
RPC holds a PhD and work as a research scientist in the area of food science at International Rice Research Institute (IRRI). CJD completed MSc and worked in the area of texture and advance rheometry. NS holds a PhD and is employed as Head of Grain Quality and Nutrition Center at IRRI.
Ethics approval and consent to participate
The International Rice Research Institute currently does not have an Institutional Review Board. All participants in the sensory evaluation part of the study gave written consent prior to the sensory evaluation and had the option to terminate their participation at any point of the study. No minors participated in the sensory evaluation sessions.
Consent for publication
All subjects participated in sensory evaluation gave consent to publish the work.
Competing interests
All Authors declare that they have no competing interests.
Publisher’s Note
Springer Nature remains neutral with regard to jurisdictional claims in published maps and institutional affiliations.
Author details
1International Rice Research Institute (IRRI), College, Los Baños, Laguna,
Philippines.2Present address: Pangasinan State University, Bayambang,
Pangasinan, Philippines.
Received: 26 April 2018 Accepted: 10 September 2018
References
Ahmed J, Ramaswamy HS, Ayad A, Alli I (2008) Thermal and dynamic rheology of insoluble starch from basmati rice. Food Hydrocoll 22(2):278–287
Allahgholipour M, Ali AJ, Alinia F, Nagamine T, Kojiima Y (2006) Relationship between rice grain amylose and pasting properties for breeding better quality rice varieties. Plant Breed 125:357–362
American Association of Cereal Chemists Inc (2000) Approved methods of the American Association of Cereal Chemists, 10th edn. American Association of Cereal Chemists, St. Paul
Bao JS (2008) Accurate measurement of pasting temperature by the rapid Visco-Analyser: a case study using rice flour. Rice Sci 15(1):69–72
Bao JS, Shen S, Sun M, Corke H (2006) Analysis of genotypic diversity in the starch physicochemical properties of nonwaxy rice: apparent amylose content, pasting viscosity and gel texture. Starch - Stärke 58:259–267 Bett-Garber KL, Champagne ET, McClung AM, Moldenhauer KA, Linscombe SD,
McKenzie KS (2001) Categorizing rice cultivars based on cluster analysis of amylose content, protein content, and sensory attributes. Cereal Chem 78(5): 551–558
Boualaphanh C, Calingacion MN, Cuevas RP, Jothityangkoon D, Sanitchon J, Fitzgerald MA (2011) Yield and quality of traditional and improved Lao varieties of rice. SciAsia 37(2):89–97
Brandt MA, Skinner EZ, Coleman JA (1963) Texture profile method. J Food Sci 28(4):404–409
Breiman L (2001) Random forests. Mach Learn 45(1):5–32
Cagampang GB, Perez CM, Juliano BO (1973) A gel consistency test for eating quality of rice. J Sci Food Agri 24:1589–1594
Calingacion MN, Laborte AG, Nelson A, Resurreccion AP, Concepcion JC, Daygon VD, Mumm R, Reinke R, Dipti S, Bassinello PZ, Manful J, Sophany S, Lara KC, Bao J, Xie L, Loaiza K, El-hissewy A, Gayin J, Sharma N, Rajeswari S, Manonmani S, Rani NS, Kota S, Indrasari SD, Habibi F, Hosseini M, Tavasoli F, Suzuki K, Umemoto T, Boualaphanh C, Lee HH, Hung YP, Ramli A, Aung PP, Ahmad R, Wattoo JI, Bandonill E, Romero M, Brites CM, Hafeel R, Lur H-S, Cheaupun K, Jongdee S, Blanco P, Bryant R, Thi Lang N, Hall RD, Fitzgerald MA (2014) Diversity of global rice markets and the science required for consumer-targeted rice breeding. PLoS One 9(1):e85106
Calpe C (2004) International trade in rice: recent developments and prospects. World Rice Research Conference, Tsukuba, Japan, In
Champagne ET, Bett KL, Vinyard BT, McClung AM, Barton FE, Moldenhauer KA, Linscombe SD, McKenzie KS (1999) Correlation between cooked rice texture and rapid Visco Analyser measurements. Cereal Chem 76(5):764–771 Champagne ET, Bett-Garber KL, Fitzgerald MA, Grimm CC, Lea J, Ki O, Jongdee S,
Xie L, Bassinello P, Resurreccion AP, Ahmad R, Habibi F, Reinke RF (2010) Important sensory properties differentiating premium rice varieties. Rice 3(4): 270–281
Champagne ET, Bett-Garber KL, Thomson JL, Fitzgerald MA (2009) Unraveling the impact of nitrogen nutrition on cooked rice flavor and texture. Cereal Chem 86(3):274–280
Champagne ET, Lyon BG, Min BK, Vinyard BT, Bett KL, Barton FE, Webb BD, McClung AM, Moldenhauer KA, Linscombe S, McKenzie KS, Kohlwey DE (1998) Effects of postharvest processing on texture profile analysis of cooked rice. Cereal Chem 75(2):181–186
Chen M-H, Bergman CJ, Pinson SRM, Fjellstrom RG (2008)Waxygene haplotypes: associations with pasting properties in an international rice germplasm collection. J Cereal Sci 48(3):781–788
Chung H-J, Liu Q, Lee L, Wei D (2011) Relationship between the structure, physicochemical properties andin vitrodigestibility of rice starches with different amylose contents. Food Hydrocoll 25(5):968–975
Cuevas RP, Daygon VD, Corpuz HM, Reinke RF, Waters DLE, Fitzgerald MA (2010) Melting the secrets of gelatinisation temperature in rice. Func Plant Bio 37: 439–447
Cuevas RP, Pede VO, McKinley J, Velarde O, Demont M (2016) Rice grain quality and consumer preferences: a case study of two rural towns in the Philippines. PLoS One 11(3):e0150345
Doutch J, Bason M, Franceschini F, James K, Clowes D, Gilbert EP (2012) Structural changes during starch pasting using simultaneous rapid Visco analysis and small-angle neutron scattering. Carb Poly 88(3):1061–1071 Fitzgerald MA, Martin M, Ward RM, Park WD, Shead HJ (2003) Viscosity of rice
flour: a rheological and biological study. J Agri Food Chem 51(8):2295–2299 Garcia DM, Bassinello PZ, Ascheri DRP, Ascheri JLR, Trovo JB, Cobucci RMAC
(2011) Cooking quality of upland and lowland rice characterized by different methods. Food Sci Tech 31(2):341–348
Goodwin HL Jr, Koop LA, Rister ME, Miller RK, Maca JV, Chambers E, Hollingsworth M, Bett KL, Webb BD, McClung AM (1996) Developing a common language for the U.S. rice industry: Linkages among breeders, producers, processors, and consumers. In: TAMRC Consumer Product Market Research Report. Agri Market Res Center 43, Texas
Graham R (2002) A proposal for IRRI to establish a Grain Quality and Nutrition Research Center. In: IRRI Discussion Paper Series No. 44. International Rice Research Institute, Los Banos, p 15
Hori K, Suzuki K, Iijima K, Ebana K (2016) Variation in cooking and eating quality traits in Japanese rice germplasm accessions. Breed Sci 66:309–318 Hsu S, Lu S, Huang C (2000) Viscoelastic changes of rice starch suspensions
during gelatinization. J Food Sci 65(2):215–220
International Organization for Standardization (2007a) ISO 6647-2: 2007– Rice—Determination of amylose content—Part 2: Routine methods, p 10 International Organization for Standardization (2007b) ISO 6647-1: 2007–
Rice—Determination of amylose content—Part 1: Reference method, p 11 Iturriaga LB, de Mishima BL, Añon MC (2006) Effect of amylose on starch pastes
viscoelasticity and cooked grains stickiness in rice from seven argentine genotypes. Food Res Int 39(6):660–666
Juliano BO (2006) Trends in rice quality demand in Asia. In: Sumarno, Suparyono, Fagi, AM, Adnyana, MO (eds) Rice industry. Cuture and Environment. Indonesian Center for Rice Research, Subang, West Java, pp 43–53 Juliano BO, Perez CM, Resurreccion AP (2009) Apparent amylose content and
gelatinization temperature types of Philippine rice accessions in the IRRI Gene Bank. Phil Agri Sci 92(1):106–109
Kumar I, Khush GS (1986a) Gene dosage effect of amylose content in rice endosperm. Jap J Genet 61:559–568
Kumar I, Khush GS (1986b) Genetics of amylose content in rice (Oryza sativaL.). J Genet 65(1–2):1–11
Li H, Prakash S, Nicholson TM, Fitzgerald MA, Gilbert RG (2016) The importance of amylose and amylopectin fine structure for textural properties of cooked rice grains. Food Chem 196:702–711
Li K, Bao JS, Corke H, Sun M (2017) Association analysis of markers derived from starch biosynthesis related genes with starch physicochemical properties in the USDA rice mini-core collection. Front Plant Sci 8:424
Liaw A, Wiener M (2002) Classification and regression by random Forest. R News 2(3):18–22
Louppe G, Wehenkel L, Sutera A, Geurts P (2013) Understanding variable importances in forests of randomized trees. In: Burges CJC, Bottou L, Welling M, Ghahramani Z, Weinberger KQ (eds) Adv Neural Info Processing Systems, pp 431–439
Lyon BG, Champagne ET, Vinyard BT, Windham WR (2000) Sensory and instrumental relationships of texture of cooked rice from selected cultivars and postharvest handling practices. Cereal Chem 77(1):64–69
Madhu B, Ashok NC, Balasubramanian S (2014) A multinomial logistic regression analysis to study the influence of residence and socio-economic status on breast cancer incidences in southern Karnataka. Intl J Math Stat Inv 2(5):1–8 Mandala IG (2012) Viscoelastic properties of starch and non-starch thickeners in
simple mixtures or model food. In: de Vicente J (ed) Viscoelasticity: from theory to biological applications. IntechOpen. Rijeka, Croatia, pp 217–236 Martin M, Fitzgerald MA (2002) Proteins in rice grains influence cooking
properties. J Cereal Sci 36(3):285–294
Miura S, Crofts N, Saito Y, Hosaka Y, Oitome NF, Watanabe T, Kumamaru T, Fujita N (2018) Starch synthase IIa-deficient mutant Rice line produces endosperm starch with lower gelatinization temperature than japonica Rice cultivars. Front Plant Sci 9:645.https://doi.org/10.3389/fpls.2018. 00645eCollection 2018
Musyoki MA, Kioko WF, Mathew NP, Daniel A, Muriira KG, WN D, Felix M, Chemutai LR, Mwenda NS, Kiambi MJ, Ngithi NL (2015) Genetic diversity studies on selected rice (Oryza sativa) genotypes based on amylose content and gelatinization temperature. Adv Crop Sci Tech 3:5
Okadome H (2005) Application of instrument-based multiple texture
measurement of cooked milled-rice grains to rice quality evaluation. Jap Agri Res Quart 39(4):261–268
Okadome H, Toyoshima H, Shimizu N, Suzuki K, Ohtsubo K (2005) Quality prediction of rice flour by multiple regression model with instrumental texture parameters of single cooked milled rice grains. Cereal Chem 82(4): 414–419
Pang Y, Ali J, Wang X, Franje NJ, Revilleza JE, Xu J, Li Z (2016) Relationship of rice grain amylose, gelatinization temperature, and pasting properties for breeding better eating and cooking quality of rice varieties. PLoS One 11(12):e0168483
Singh N, Kaur L, Sandhu KS, Kaur J, Nishinari K (2006) Relationships between physicochemical, morphological, thermal, rheological properties of rice starches. Food Hydrocoll 20(4):532–542
Tan Y, Corke H (2002) Factor analysis of physicochemical properties of 63 rice varieties. J Sci Food Agri 82:745–752
Tran N, Daygon VD, Resurreccion AP, Cuevas RP, Corpuz HM, Fitzgerald MA (2011) A single nucleotide polymorphism on theWaxygene explains a significant component of gel consistency. Theor Appl Genet 123(4):519–525 Tsai ML, Lii CY (2000) Effect of hot-water-soluble components on the rheological
properties of rice starch. Starch - Stärke 52(2–3):44–53
Tuaño APP, Aoki N, Fujita N, Oitome NF, Merca FE, Juliano BO (2014) Grain and starch properties of waxy and low-apparent amylose Philippine Rices and of NSIC Rc222. Phil Agri Sci 97(4):329–339
Tuaño APP, Regalado MJC, Juliano BO (2016) Grain quality of rice in selected retail stores and supermarkets in the Philippines. Intl J Phil Sci Tech 9(1):15–22 Unnevehr LJ, Juliano BO, Perez CM (1985) Consumer demand for rice grain
quality in Southeast Asia. In: International Rice research conference. International Rice Research Institute, Los Baños, Philippines, pp 15–23 Vandeputte GE, Derycke V, Geeroms J, Delcour JA (2003) Rice starches. II.
Structural aspects provide insight into swelling and pasting properties. J Cereal Sci 38(1):53–59
Villareal CP, Maranville JW, Juliano BO (1991) Nutrient content and retention during milling of brown Rices from the international Rice research institute. Cereal Chem 68(4):437–439
Xie L, Chen N, Tang S, Luo J, Jiao G, Hu P (2011) Use of Mixolab in predicting rice quality. Cereal Chem 88(4):333–337
Yang F, Chen Y, Tong C, Huang Y, Xu F, Li K, Corke H, Sun M, Bao JS (2014) Association mapping of starch physicochemical properties with starch synthesis-related gene markers in nonwaxy rice (Oryza sativaL.). Mol Breeding 34(4):1747–1763
Yoenyongbuddhagal N, Noomhorm A (2002) Effect of physicochemical properties of high-amylose Thai rice flours on vermicelli quality. Cereal Chem 79(4):481–485
Zaidul ISM, Norulaini NAN, Omar AKM, Yamauchi H, Noda T (2007) RVA analysis of mixtures of wheat flour and potato, sweet potato, yam, and cassava starches. Carb Poly 69(4):784–791