F
IRER
EGIMEA
TTRIBUTES OFW
ILDLANDF
IRESIN
Y
OSEMITEN
ATIONALP
ARK, USA
Jan W. van Wagtendonk1*, and James A. Lutz2
1USGS Western Ecological Research Center, Yosemite Field Station,
El Portal, CA 95318, USA
2University of Washington, College of Forest Resources,
Box 352100, Seattle, WA 98195, USA
*Corresponding author: Tel.: (209) 379-1306; email: jan_van_wagtendonk@usgs.gov
ABSTRACT
Past attempts to suppress all fi res in some western forests have altered historic fi re regimes. Accumulated debris and dense understories of shade tolerant species coupled with a warmer climate have led to catastrophic wildfi res. Prescribed fi res and wildland fi re use fi res are used by land managers to reduce fuels and restore natural conditions. Little is known about how wildfi res, prescribed fi res, and wildland fi re use fi res differ in their fi re regime attributes. We compared the attributes of start date, duration, 95th percentile burning index, size, fi re rotation and fi re return interval, and fi re severity of 144 fi res >40 ha that occurred in Yosemite National Park from 1974 through 2005, and mean patch size and patch squareness (an index of complexity) of 106 fi res that occurred from 1984 through 2005. We used fi re history, weather records, and the Relative differenced Normalized Burn Ratio (RdNBR) derived from satellite imagery to make the comparisons. Prescribed fi res started both earlier and later than wildfi res and wildland fi re use
fi res, and had the shortest return intervals. Prescribed fi res burned during periods with a lower 95th percentile burning index (an estimate of potential fl ame length and fi re line intensity), and
resulted in larger patches that were unchanged or that burned with low severity. Wildfi res were
the largest in size and had the largest percent area burned at moderate and high severity. Wildfi res also had the largest moderate and high severity patches, and the high severity patches were the
most square. The signifi cant differences in fi re regime attributes suggest that land managers
seeking to restore natural fi re regimes and forest composition and structure must consider more
than the metrics of area burned or fuel loading.
Keywords: fi re intensity, fi re return interval, fi re rotation, fi re seasonality, fi re severity, fi re size,
fi re spatial complexity, prescribed fi re, wildfi re, wildland fi re use
Citation: van Wagtendonk, J.W., and J.A. Lutz. 2007. Fire regime attributes of wildland fi res in Yosemite National Park, USA. Fire Ecology 3(2): 34-52.
INTRODUCTION
Fire has been an ecological force in western US ecosystems for millennia. Flammable fuels, abundant ignition sources, and hot, dry summers combine to produce conditions
conducive to an active fi re role. Fire regimes include the temporal, spatial, and magnitude attributes of fi re, and together those attributes
describe the role fires play in different
ecosystems. Past attempts to suppress all
historic fi re regimes (Skinner and Chang 1996). Accumulated debris on the forest fl oor, dense understories of shade tolerant species, and a warmer climate have led to larger areas being burned and higher tree mortality (van Wagtendonk and Fites-Kaufman 2006).
Land managers have a variety of methods
to manage fi re in these altered landscapes.
Although mechanical thinning can sometimes be used to reduce fuel loading and tree density
in National Parks, fi re is the only treatment
that can be used over large areas. Prescribed
fi res are set by land managers to reduce fuels
and to restore ecological function in areas that have departed from natural conditions.
A prescription is used to defi ne burning
conditions that are safe and effective in
meeting management objectives. Wildland fi re
use, defi ned as the management of wildland
fi res for resource benefi ts, is a strategy that allows fi res ignited by lightning to burn only if they meet pre-defi ned conditions specifi ed in a management plan. Fire suppression remains an important management strategy for human-caused fi res and wildland fi res that are out of prescription. These suppressed fi res are called wildfi res.
There is currently a great deal of effort being devoted to reducing fuels using mechanical methods or prescribed burns. However, areas needing treatment are so large and the opportunities to implement them so infrequent, that these efforts alone may prove
futile. Stephens et al. (2007) recommend that
wildland fi re use be implemented in remote
areas inside and outside of wilderness to
increase the area treated with fi re. Parsons
(2000) states that none of the fi ve federal
wilderness management agencies (Bureau of Indian Affairs, Bureau of Land Management, Forest Service, National Park Service, U.S. Fish and Wildlife Service) have been able to restore naturally occurring fi re to a level that
approaches pre-settlement fi re regimes. He
concludes that prescribed fi re should be used
to aid in restoring natural fi re regimes in
wilderness areas. Both prescribed fi res and
wildland fi re use fi res will be necessary to reverse the effects of decades of fi re exclusion.
There is some concern that prescribed fi res
are not suffi ciently intense to mimic naturally
occurring fi res (Miller and Urban 2000).
Because one of the goals for managing parks and wilderness areas is to restore natural fi re regimes and characteristic vegetation structure and composition, it is important to know the extent to which prescribed fi res and wildfi res deviate from those regimes.
Sugihara et al. (2006) classifi ed fi re
regimes based on distributions for seven fi re
regime attributes grouped into categories of time, space, and magnitude. Temporal attributes include seasonality and fi re return interval; spatial attributes include fi re size
and spatial complexity of the fi res; and
magnitude attributes include fi reline intensity,
fi re severity, and fi re type. Although there are many other attributes that they could have
used, Sugihara et al. (2006) state that those
seven attributes were the ones that were that are most commonly considered to be important to ecosystem function.
Fire seasonality is defi ned as a combination of the date a fi re starts and its duration. Fire return interval is the length of time between
fi res at a specifi c point on the landscape and can be expressed as a mean, median, minimum, or maximum. Other measures related to fi re return interval include fi re rotation, which is the time
necessary for fi re to burn an area equivalent
to the total area of an ecosystem (Heinselman 1978), and fi re frequency, which is the inverse of fi re return interval. Fire size is the area
burned by the fi re, and spatial complexity is
defi ned as the variability in the patchiness and gradient structure of the burned area. Fireline intensity is the rate of energy release per unit of
fi re fl aming front. Although other measures of
can be visualized through its relationship with
fl ame length (Byram 1959) and the burning
index, an estimate of potential fl ame length
and fi reline intensity (Deeming et al. 1977). Fireline intensity is also the measure of fi re magnitude that is most commonly understood and used by fi re behavior analysts. Fire severity is defi ned as the magnitude of the effect that a
fi re has on the environment (van Wagtendonk
2006). It is commonly measured using remote sensing indexes, but other methods such as fi eld surveys of fi re effects are also used (Key 2006, Key and Benson 2004). Fire type describes the vegetation and fuel layers through which a fi re propagates and includes ground fi res, surface
fi res, and crown fi res. Van Wagner (1977)
defi ned three phases of crown fi res: passive
crown fi res torch individual trees or groups
of trees, active crown fi res spread through the crowns in conjunction with a surface fi re, and independent crown fi res spread far ahead of or in the absence of a surface fi re.
Fire regimes in Sierra Nevada forests are altered by human activities in several ways. Fire seasons are extended by human-caused ignitions during periods of time when lightning strikes are negligible or absent. Fire durations are shortened and fi re return intervals increased as fi re suppression efforts extinguish many fi res when they are still small. As a result, most
fi res are smaller in size, but those fi res that do escape control become much larger than would occur naturally because of the increase in fuel loading (Running 2006). These large fi res burn with greater intensity and have large patches of severe effects. Although surface fi res are still
common, active crown fi res and independent
crown fi res have begun to appear. Independent
crown fi res have been extremely rare in the
Sierra Nevada in the past (van Wagtendonk and Fites-Kaufman 2006).
Our objective is to quantify fi re regime
attributes for prescribed fi res, wildfi res, and wildland fi re use fi res to determine if there were differences. Based on this information, land
managers can make more informed decisions about the alternative strategies for managing wildland fi res.
METHODS
Study Area
Yosemite National Park is a 302,688 ha reserve in the Sierra Nevada of California, USA. Elevations range from 600 m in the foothills to 4,000 m at the crest. The park has hot, dry summers and cold, moist winters. Temperature ranges from a July maximum temperature normal (1971–2000) of 35 °C in the lowest canyons to a January minimum temperature normal of -14 °C at the crest of the range. Annual normal precipitation for the same period varies from 800 mm at lower elevations and in local rain shadows to 1,720 mm at higher elevations, with most precipitation at higher elevations falling as
snow (Daly et al. 2002, Daly 2006).
The vegetation responds to climate and topography with broad zones roughly corresponding to elevation. Chaparral woodlands occur in the foothill zone; conifer forests cover much of the lower montane, upper montane, and subalpine zones; and meadows occupy the alpine zone above tree line (van Wagtendonk and Fites-Kaufman 2006) (Figure 1). The dry chaparral woodlands
consist of a manzanita (Arctostaphylos
viscida) and ceanothus (Ceanothus cuneatus) understory beneath a canyon and interior live oak (Quercus chrysolepsis, Q. wislizenii) and
foothill pine (Pinus sabiniana) overstory. As
elevation increases, the foothill vegetation is replaced with lower montane forest consisting
of ponderosa pine (P. ponderosa) stands mixed
with incense-cedar (Calocedrus decurrens),
sugar pine (P. lambertiana), California
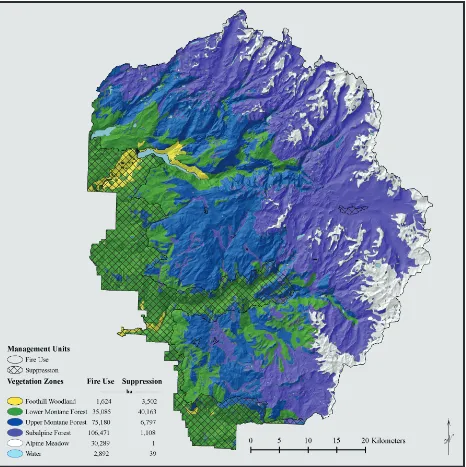
Figure 1. Fire management zones and vegetation zones in Yosemite National Park. In the fi re use zone, most lightning fi res are allowed to burn under prescribed conditions. In the suppression
zone, all human-caused and lightning-caused fi res are suppressed. Prescribed fi res are used to
reduce hazardous fuels and restore natural conditions in both zones.
gives way to the upper montane forest of nearly pure red fi r (A. magnifi ca) forests with western
white pine (P. monticola), western juniper
(Juniperus occidentalis), and Jeffrey pine (P. jeffrey) occurring on exposed granitic ridges. Montane chaparral occurs in patches beneath the upper montane forest. The subalpine forest
is dominated by lodgepole pine (P. contorta),
which, as treeline is approached, is replaced
by mountain hemlock (Tsuga mertensiana)
and whitebark pine (P. albicaulis). Meadows
consisting of herbs, grasses, sedges, and shrubs occur at all elevations.
Fire scars are a primary source of
information for documenting the historic fi re
determined that fi res were frequent in the past but decreased sharply after the mid-1800s, coinciding with Euro-American settlement of the Yosemite region. Swetnam (1993) reported
fi re scar records in fi ve giant sequoia groves located from Yosemite to Sequoia National Park that confi rmed the presence of fi re in the Sierra Nevada for the past 3,000 years. Between 1300 and the mid-1800s, intervals free of fi re scars ranged from less than 13 yr during dry periods to between 15 yr and 30 yr
during cool periods. Swetnam et al. (2000)
examined fi re scars in the southwestern part
of Yosemite along a transect from 1,090 m to
2,425 m. They found that mean fi re return
intervals for fi res recorded by 25 % or more
of the fi re-scarred trees ranged from 4.94 yr in ponderosa pine at the lowest elevation to 10.57 yr in Jeffrey pine at the highest. Swetnam
et al. (2000) also found that 55 % of the fi re scars occurred in the latewood part of the tree ring, indicating that these fi res burned between July and early October. An additional 21 % occurred between June and July and 17 % between mid-September and December.
Scholl (2007) found similar results for lower montane forests north and south of Yosemite Valley. In the northern location, the mean return interval for fi res recorded by 25 % of the trees was 10.0 yr, while south of the valley it was 6.9 yr. He reconstructed fi re size from fi re scars and found that 22 % of the
fi res were <25 ha and 1 % were between 1,275 ha and 2,125 ha. Gassaway (2007) recorded
fi re scars from 62 trees in her study area in
Yosemite Valley and determined a composite
mean fi re return interval of 1.92 yr. She
attributed those frequent fi res to intentional
burning done by Native Americans because Yosemite Valley experiences few lightning ignitions (van Wagtendonk 1994).
Collins and Stephens (2007) cross dated 420 trees in the Illilouette Creek basin just south of Yosemite Valley and calculated a
mean fi re return interval of 6.3 yr for the
period between 1700 and 1900. Based on scars recorded between 1972 and 2000, when
the wildland fi re use program started, they
concluded that the number and extent of fi res
approached historical levels.
Fire suppression in Yosemite National Park began in 1891 when the U.S. Army was assigned the responsibility for protecting the park (Rothman 2007). When the National Park Service was established in 1916, it continued the total suppression program. In 1968, Park Service policy changed and the use of prescribed fi res and natural fi res was permitted. Yosemite initiated prescribed burning in 1970 and has allowed wildland fi res to burn under prescribed conditions since 1972.
The wildland fi re use program was based on an
analysis of natural fi re return intervals and the magnitude of departures from these intervals for each of the vegetation types in the park
(van Wagtendonk et al. 2002). Areas of the
upper montane and subalpine zones, where departures are generally two or fewer return intervals, have been categorized as wildland
fi re use zones (Figure 1). In these areas,
lightning fi res that meet specifi c prescriptions are allowed to burn to meet land management
objectives, but human-caused wildfi res are
suppressed. Approximately 83 % of the park is in this zone. In the remaining 17 %, primarily in lower montane forests, all human-caused and lightning-caused wildfi res are suppressed. These areas have not burned in three or more
fi re return intervals, have unnaturally high
fuel accumulations, and are close to developed areas or park boundaries. The park uses prescribed fi res in the upper and lower montane forests to reduce fuel hazards and to restore natural conditions. Between 1930 and 2005 there have been 1,594 wildfi res. Of these, 585 were caused by humans and 1,009 ignited by lightning.
For this analysis, we aggregated fi res into
three management types: prescribed fi res
by humans and those lightning-ignited fi res
that were suppressed), and wildland fi re use
(lightning ignitions allowed to burn under
prescribed conditions). Some wildland fi re
use fi res exceeded their prescriptions and
subsequently were converted to wildfi res and
suppressed. In those cases, we assigned the entire fi re to the fi re management type in which it had the largest burned area.
Data Sources
We used data from a fi re atlas maintained
by the park, fi re weather records, and satellite
imagery to determine fi re regime attributes.
The fi re atlas contains the fi re name, fi nal area
burned, fi re management type, cause, start
date, end date, and digitized perimeter of all of the fi res that have occurred in the park since 1930. Daily weather records maintained by the Forest Service were available for a weather station centrally located in the park that had records dating back to 1974 (http://famweb. nwcg.gov/). In addition to weather and fuel moisture observations, the fi re weather records include fi re behavior potential and occurrence indices from the National Fire Danger Rating
System (Deeming et al. 1977). Satellite
imagery became available in 1974, soon after the prescribed burning program began in 1970
and the wildland fi re use program in 1972.
Therefore, we had to limit our analysis to the period between 1974 and 2005.
Thode (2005) and Miller and Thode (2007)
previously compiled fi re severity data from
satellite imagery for all fi res >40 ha in the Sierra Nevada. This data set included 144
fi res in Yosemite National Park including 37
prescribed fi res, 75 wildland fi re use fi res, and
32 wildfi res that burned a total of 44,062 ha
within the foothill woodland, lower montane forest, upper montane forest, and subalpine forest zones (Table 1, Figure 2).
Miller and Thode (2007) used Landsat Multitemporal Spectral Scanner (Landsat MSS) imagery and the Normalized Difference Vegetation Index (NDVI) at a resolution of
~80 m to map the severity of fi res between
1974 and 1983. They used Landsat Thematic Mapper (Landsat TM) imagery and the Normalized Burn Ratio (NBR) at a resolution
of 30 m to map fi res from 1984 through 2005.
Thode (2005) concluded that there was no
signifi cant difference between severity maps
derived from the NDVI and NBR; therefore, we were able to use the entire Landsat record
(1974-2005) for our analysis. When fi res
extended beyond the boundary of the park into the adjacent Stanislaus National Forest, we analyzed the entire fi re. Differences in NDVI and differences in NBR (dNBR) depend on the pre-fi re vegetation, which varies by forest type and successional stage (Miller and Thode 2007). Therefore, to account for heterogeneity
of pre-fi re vegetation among fi res, we used
relative measures of fi re severity: the Relative
Vegetation zone
Fire management type
Prescribed fi re Wildfi re Wildland fi re use All fi res
Foothill Woodland 275 709 47 1,031
Lower Montane Forest 10,627 8,635 8,977 28,239
Upper Montane Forest 1,064 3,275 8,188 12,527
Subalpine Forest 25 213 2,026 2,264
Alpine Meadow 0 0 0 0
Total 11,991 12,832 19,238 44,061
differenced NBR (RdNBR) for fi res mapped with Landsat TM and the Relative NDVI
(RNDVI) for fi res mapped with Landsat MSS
(Thode 2005, Miller and Thode 2007).
In her analysis of fi res throughout the Sierra Nevada including Yosemite, Thode (2005) determined numerical thresholds to distinguish between portions of a fi re that burned at low, moderate, and high severities, as well as areas
that were unchanged between pre-fi re and
post-fi re satellite images. Unchanged areas usually refl ected low intensity surface fi res that burned beneath the overstory canopy and that did not burn or scorch the overstory canopy. She classifi ed areas within the digitized fi re history perimeters as unchanged if the severity was so low that she could not detect a change in the
images that were one year post-fi re, and she
Figure 2. Fire severity levels for all fi res >40 ha, Yosemite National Park, 1974 through 2005. Where fi res have reburned the same area, the fi re severity of the most recent fi re is shown. The
extended the perimeters to include areas that
showed a change due to fi re but were outside
of the recorded perimeters. The RNDVI thresholds were: unchanged – less than 25; low – greater than or equal to 25 and less than 198; moderate – greater than or equal to 198 and less than 419; and high– greater than or equal to 419. The RdNBR thresholds were: unchanged – less than 42; low – greater than or equal to 42 and less than 220; moderate – greater than or equal to 220 and less than 566; and high – greater than or equal to 566.
Calculation of Fire Regime Attributes
We chose to evaluate six of the seven fi re
regime attributes described by Sugihara et
al. (2006): seasonality, return interval, size,
spatial complexity, intensity, and severity. Fire
type (ground, surface, or crown fi re) was not
considered because historic data on type were not available. In addition to fi re return interval for each fi re, we also calculated fi re rotation for the vegetation zones. We used start date and duration to depict seasonality and the burning
index to represent fi re line intensity. We
determined fi re size, return interval, rotation, severity, and spatial complexity from the satellite-derived fi re severity maps. We used mean patch size (MPS) and patch squareness (SqP) to represent spatial complexity (Frohn 1998). Mean patch size is a measure of fragmentation, and patch squareness is a measure of complexity. Patch squareness is an index that runs from 0 for square, minimally complex patches, to 1 for patches that were least square-like and highly complex. Unlike contagion and fractal dimension, MPS and SqP are optimized for use with data arranged in rasters, as with Landsat data (Frohn 1998).
Some differences in fi re regime attributes
among fi re management types could be due to
differences in vegetation. Because vegetation zones correspond to elevation, we used the
average elevation of each fi re to adjust for
the effect of vegetation zones on fi re regimes. The elevations were used as a covariate in the analysis.
Start date and fi re duration. We converted start dates to Julian dates to indicate the
season of burning. Because no fi res burned
from December into January, we were able to calculate duration by subtracting the start date from the end date. For wildland fi re use fi res, the park recorded the date of the fi rst winter storm as the end date.
Burning index, fl ame length, and fi reline intensity. Because peak weather has the greatest infl uence on fi re behavior and effects, we used
the 95th percentile burning index calculated
from the daily values during a fi re to represent that fi re rather than the average daily burning index. Daily values ranged from zero to 58. If we had used the average over the duration of
a fi re (which was often two months or more),
we would have diluted the infl uence of peak
weather periods. For example, one fi re burned for 144 days and had an average burning index
of 24 while the 95th percentile value was 41.
We converted 95th percentile burning index
values to fl ame length and fi reline intensity
using equations in Deeming et al. (1977) and
Byram (1959).
Fire size, return interval, and rotation.
Because Kolden (2007) concluded that manually-mapped perimeters correlated
poorly with remotely-sensed fi re perimeters,
we used the fi re perimeters derived by Thode
(2005) from satellite imagery to calculate the
areal extent of each fi re. We determined the
fi re return interval for each fi re that reburned areas burned by previous fi res by calculating
the number of years between fi res weighted by
would be 13 [(9 x 100)/300 + (15 x 200)/300]. Fire rotation was calculated by dividing the area in each vegetation zone (Figure 1) by the area burned in that zone for all fi res and each
fi re management type (Table 1).
Fire severity. We calculated the percent area burned in each fi re severity level by fi re management type (prescribed fi re, wildfi re,
wildland fi re use) from the RNDVI and RdNBR
data compiled by Thode (2005) and Miller and Thode (2007).
Mean patch size and patch squareness.
Because spatial complexity measures are affected directly by the spatial resolution of the satellite data, we used only the 30 m Landsat
TM images from 1984 to 2005 (106 fi res) and
not the coarser resolution data from the Landsat MSS for spatial complexity analysis. We analyzed the RdNBR data with FRAGSTATS
(McGarigal et al. 2002) and used the output to
calculate mean patch size and patch squareness metrics (Frohn 1998).
Statistical Analysis
We used one-way analysis of covariance with elevation as a covariate to test for
differences among fi re management types for
start date, duration, burning index, percent fi re severity level, size, and return interval. For the percent fi re severity analysis, we analyzed each severity level separately using the arcsine square root transformation to normalize the data. We used two-way analysis of covariance with elevation as a covariate to test for differences among fi re management types and fi re severity levels for the spatial complexity metrics. We normalized SqP values with the arcsine square root transformation. All hypotheses tests were 2-tailed and at the 0.05 signifi cance level. Bonferroni multiple comparison tests were used to detect differences among means. For these comparisons, the signifi cance levels were
adjusted to 0.0167 for one-way ANOVAs and to 0.0083 two-way ANOVAs.
RESULTS
Management type was signifi cant for all
of the fi re regime attributes except fi re return interval. Fire severity level was signifi cant for both patch size and patch squareness.
Elevation was not signifi cant for the 95th
percentile burning index, fi re return interval, patch squareness, and the low and high percent severity levels.
Start date and fi re duration. Mean fi re start dates varied by fi re management type (F2, 140 = 3.91, P = 0.022) (Table 2). Prescribed fi res tended to have two seasons, one in the spring and another in the fall (Figure 3). The number of lightning fi re ignitions that were allowed to
burn as part of the wildland fi re use program
reached a peak in July, while wildfi res started primarily in August. Multiple comparison
tests showed that prescribed fi re start dates
were signifi cantly different (P ≤ 0.001) from start dates for both wildfi res and wildland fi re use fi res.
Fire duration was also signifi cantly affected by fi re management type (F2, 140 = 12.478, P ≤
0.001) (Table 2). Most prescribed fi res and
wildfi res lasted less than 20 days, while the
most common duration of wildland fi re use
Fire management
type
Start date Duration
Mean SD Mean SD
date ··· days ···
Prescribed fi re 7/21 102.2 25.3 23.9
Wildfi re 8/19 40.5 37.3 40.8
Fire use 8/2 30.4 85.5 37.4
All fi res 8/3 61.0 58.6 44.6
fi res was from 101 days to 120 days. Multiple comparisons showed that there were no signifi cant differences between prescribed fi res and wildfi res (P ≤ 0.001), and that wildland
fi re use fi res burned signifi cantly longer than the other two fi re management types.
Burning index, fl ame length, and fi reline intensity. The mean 95th percentile burning index varied signifi cantly by fi re management type (F2, 140 = 15.21, P ≤ 0.001) (Table 3). The
modal number of prescribed fi res occurred
when the 95th percentile burning index was
between 6 and 10. Wildfi res burned most
frequently when the 95th percentile burning index was between 31 and 35, while wildland
fi re use fi res most often occurred when the
95th percentile burning index was between 36 and 40. The multiple comparisons showed that the mean 95th percentile burning index for prescribed fi res differed signifi cantly from the index for either wildfi res or wildland fi re use
fi res (P ≤ 0.001). The estimated mean fl ame length for prescribed fi res was 0.31 m less than wildfi res and 0.45 m less than wildland fi re use fi res (F2, 140 = 15.31, P ≤ 0.001) (Table 3). Similarly, fi reline intensities were 118.08 kW m-1 and 123.60 kW m-1 less, respectively (F
2, 140 = 11.87, P ≤ 0.001) (Table 3).
Fire size, return interval, and rotation.
Fire size was signifi cantly affected by fi re
management type (F2, 140 = 6.29, P = 0.002)
(Table 4). Wildland fi re use fi res were
signifi cantly larger than prescribed fi res, and
the mean area burned by wildfi res was more
than four times the mean area burned by wildland fi re use fi res (P =0.012). Most of the difference was a result of two large wildfi res that were greater than 19,000 ha.
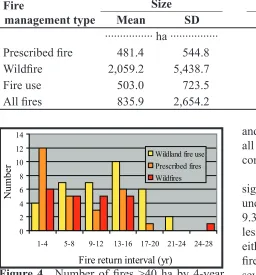
Fire return intervals were calculated for the 82 fi res that reburned 13,838.7 ha in previous
fi res (Table 4, Figure 4). Fire management
type did not signifi cantly affect fi re return intervals (F2, 78 = 2.34, P = 0.103). Return interval values for the reburned areas ranged
from 7.3 yr for prescribed fi res to 11.4 yr
for wildland fi re use fi res. Fire rotations for
Figure 3. Number of fi res >40 ha by monthly start dates for prescribed fi res, human-caused
wildfires, lightning-caused wildfi res, and
lightning-caused wildland fi re use fi res,
Yosemite National Park, 1974 through 2005.
0 5 10 15 20 25 30 35
Jan Mar May Jul Sep Nov
Number
Wildland Fire Use Prescribed Fires Wildfires
Fire management type
95th percentile
burning index Flame length Fireline intensity
Mean SD Mean SD Mean SD
··· index ··· ··· m ··· ··· kW m-1 ···
Prescribed fi re 20.0 10.7 0.61 0.33 120.10 126.36
Wildfi re 30.1 9.1 0.92 0.28 238.18 127.07
Fire use 34.9 7.7 1.06 0.24 311.97 133.11
All fi res 29.8 10.9 0.91 0.33 243.70 152.51
the foothill woodland zone ranged from 224 yr for wildfi res to 3,381 yr for wildland fi re
use fi res (Table 5). Rotations for the lower
montane forest zone were similar for the three management types, from 220 yr to 270 yr. In the upper montane forest and subalpine forest zones, prescribed fi res had the longest rotations
and wildland fi re use fi res the shortest. When
all fi re management types and zones were
considered together, the rotation was 213 yr.
Fire severity. Fire management type
significantly affected the percentage of
unchanged fi re severity within a fi re (F2, 140 = 9.372, P ≤ 0.001). Wildfi res had signifi cantly less percent area at the unchanged level than either prescribed fi res (P ≤ 0.001) or wildland
fi re use fi res (P = 0.023). For the unchanged
severity level, prescribed and wildland fi re
use fi res did not signifi cantly differ (Figure 5).
The percentage of low severity fi re differed
signifi cantly among fi re management types (F2, 140 = 4.56, P = 0.012). Prescribed fi res had more low severity fi re than wildfi res (P
= 0.009) but did not differ signifi cantly from wildland fi re use fi res. There were signifi cant differences in the percent of low severity between wildfi res and wildland fi re use fi res (Figure 5). The percent burned at moderate severity also was signifi cantly affected by fi re
Figure 4. Number of fi res >40 ha by 4-year
fi re return intervals for prescribed fi res, human-caused wildfi res, lightning-caused wildfi res, and lightning-caused wildland fi re use fi res, Yosemite National Park, 1974 through 2005.
0 2 4 6 8 10 12 14
1-4 5-8 9-12 13-16 17-20 21-24 24-28 Fire return interval (yr)
Number
Wildland fire use Prescribed fires Wildfires Fire
management type
Size Return interval
Mean SD Fires Area Mean SD
··· ha ··· no. ha ··· yr ···
Prescribed fi re 481.4 544.8 25 6,963.3 7.3 5.9
Wildfi re 2,059.2 5,438.7 20 2,266.5 8.9 6.8
Fire use 503.0 723.5 37 4,608.9 11.4 5.4
All fi res 835.9 2,654.2 82 13,838.7 9.6 6.1
Table 4. Fire size (ha) and the number of fi res considered in the return interval calculation, the area (ha) reburned by those fi res, and the return interval (yr) for prescribed fi res, wildfi res, and fi re use fi res >40 ha in Yosemite National Park, 1974 through 2005.
Vegetation zone
Fire management type
Prescribed fi re Wildfi re Wildland fi re use All fi res
··· yr ···
Foothill Woodland 578 224 3,381 154
Lower Montane Forest 220 270 260 83
Upper Montane Forest 2,388 776 310 203
Subalpine Forest 133,398 15,657 1,646 1,473
Total 784 732 488 213
management type (F2, 140 = 15.25, P ≤ 0.001), with wildfi res having a signifi cantly greater
percentage than both prescribed fi res (P ≤
0.001) and wildland use fi res (P = 0.010). Fire
management type was also signifi cant for the
percent of high severity burned area (F2, 140 = 21.44, P ≤ 0.001). Each fi re management type differed signifi cantly from the other two (P ≤
0.001) with respect to the proportion burned at high severity (Figure 5).
Mean patch size and patch squareness.
Fire management type (F2, 411 = 3.02, P =
0.050), fi re severity level (F3, 411 = 2.83, P = 0.038), and their interaction (F6, 411 = 6.54, P ≤
0.001) all had signifi cant effects on mean patch size (Figure 6). Prescribed fi res had the largest
unchanged and low severity patches, while
wildfi res had the largest moderate and high
severity patches. Wildland fi re use fi res had relatively even size distribution of unchanged, low, and moderate severity patches, while high severity patches were comparatively smaller. When severity patches were considered together, there were no signifi cant differences among management types. However, when
fi re management types were lumped within
severity levels, multiple comparisons showed signifi cant differences in patch sizes between
high severity and moderate severity levels (P
= 0.016).
Patch squareness differed signifi cantly
by fi re management type (F2, 411 = 11.64,
P ≤ 0.001) and fi re severity level (F3, 411 =
41.41, P ≤ 0.001), but their interaction was
not signifi cant (F6, 411 = 1.68, P = 0.124). Unchanged and low severity patches tended to be the least square for all management types, and high severity patches the most square (Figure 7). Patch squareness for prescribed
fi res differed signifi cantly from wildfi res when
severity levels were combined (P = 0.019).
When fi re management types were combined
into severity levels, all comparisons between
levels were signifi cant (P ≤ 0.001) except
between unchanged patches and both low and moderate severity patches.
Figure 5. Percent area burned by severity level for prescribed fi res, wildfi res, and fi re use fi res >40 ha, Yosemite National Park, 1974 through 2005.
0 5 10 15 20 25 30 35 40 45
Unc Low Mod Hi Unc Low Mod Hi Unc Low Mod Hi Prescribed Wildfire Fire use
Percent
Figure 6. Mean patch size (ha) by severity level for prescribed fi res, wildfi res, and fi re use fi res >40 ha, Yosemite National Park, 1984 through 2005.
0 2 4 6 8 10 12 14
Unc Low Mod Hi Unc Low Mod Hi Unc Low Mod Hi
Prescribed Wildfire Fire use
Patch size (ha)
Figure 7. Patch squareness by severity level for prescribed fi res, wildfi res, and fi re use fi res >40 ha, Yosemite National Park, 1984 through 2005.
0.0 0.2 0.4 0.6 0.8 1.0
Unc Low Mod Hi Unc Low Mod Hi Unc Low Mod Hi
Prescribed Wildfire Fire use
DISCUSSION
The effect of fi re management type, whether prescribed, wildfi re, or wildland fi re use, was pronounced for some fi re regime attributes and non-existent for others. The causes of those differences were not always evident but can be explained by examining the management objectives of the fi res and the conditions under which they burned.
Although the mean start dates were within a month of each other, the distribution of dates over the year showed considerable differences.
Prescribed fi res were most frequently ignited
by managers in October and September with a small peak in January. This is because conditions in the fall and early spring are suitable for safe but effective burning. Wildland fi re use fi res and wildfi res ignited by lightning followed storm patterns with most ignitions occurring in July, August, and September (van Wagtendonk 1994), consistent with the fi ndings of Swetnam et al. (2000).
Given the objectives for the fi re
management types, it is not surprising that fi re duration differed signifi cantly. Wildland fi re use fi res are allowed to burn over long periods of time as long as prescriptions are met. The
average duration for those fi res was over
twice as long as either wildfi res or prescribed
fi res. Wildfi res are extinguished as soon as practicable, usually within 20 days. Prescribed
fi res are designed to be accomplished in a short period of time, although several long-duration prescribed fi res lasted as long as 40 days.
The low 95th percentile burning index,
fl ame length, and fi reline intensity values
for prescribed fires were well within
the prescription limits set for Yosemite. Because the objective for these burns was to incrementally reduce heavy accumulations of fuels, the prescriptions were more conservative than conditions for naturally occurring fi res. Wildfi res and wildland fi re use fi res occurred primarily in the summer; consequently, the
mean 95th percentile burning indexes, fl ame
lengths and fi reline intensities were higher.
The value of these attributes for wildland fi re use fi res were slightly higher than for wildfi res because wildland fi re use fi res were allowed to burn over long durations, which often included periods of extreme weather.
Prescribed fi res and wildland fi re use fi res averaged about 500 ha in size. Because it was an objective to allow these fi res to burn, they reach relatively large sizes. These fi res
were twice as large as the fi res that Scholl
(2007) reconstructed from fi re scars, but
underreporting is often a problem with fi re scar reconstructions (Collins and Stephens 2007).
Wildfi res, on the other hand, were suppressed
as soon as possible, but those few that escaped suppression often grew to very large sizes. The average size of wildfi res was fi ve times that of both prescribed and wildland fi re use
fi res. Most of this difference is attributable to three large wildfi res that burned a total of over 51,000 ha. Such large fi res did not occur in the wildland fi re use zone, where there appears to be a practical maximum size for freely burning
fi res that is limited by natural barriers such as exposed rock, areas of lower productivity and fuel accumulation, or areas where recent fi res
have decreased fuel loading (Collins et al. in
press).
Fire return intervals for reburned areas
of all fi re management types were within the
ranges reported by other authors for the same vegetation zones (Skinner and Chang 1996,
Swetnam et al. 2000, Collins and Stephens
2007, Scholl 2007). It is important to note that these values apply only to areas that have reburned since 1974 and do not represent area-wide return intervals, which would be longer. On the other hand, the lengths of the
fi re rotations indicate that fi re has occurred less often than in previous centuries.
There were pronounced differences in the percent fi re severity levels among the fi re
much larger percentage of unchanged and low severity burned area than wildfi res and slightly
more than wildland fi re use at those severity
levels. Because the objective of prescribed
fi res is to reduce fuels safely and effectively, it was expected that severity would remain
low to unchanged. Wildfi res and wildland
fi re use fi res burned under hotter and drier conditions that produced large high severity patches. The percent moderate severity burned area for wildfi res was twice that of prescribed
fi res and half again as much as wildland fi re
use. Wildfi res had 10 times as much high
severity burned percentage as prescribed fi res and nearly three times as much as wildland fi re use.
Fire regime attributes cannot be considered in isolation from each other, as it
is the combination of attributes that defi nes
the ecological effect of a given fi re. Fires of comparable size but typical of each of the three different management types yielded strikingly
different landscape patterns (Figure 8). The prescribed South Fork Fire was ignited in October, 2002. It burned 1,404 ha with predominantly low severity on north-facing slopes. The Tuolumne Fire began as a wildland
fi re use fi re in August, 2003, but was converted to a wildfi re when it exceeded its prescription. Most of the area burned while in suppression status. It was controlled at 1,484 ha, and most of the large patches of high severity occurred after the conversion. The 1988 East LeConte
Fire was managed as part of the wildland fi re
use program. It grew to 1,547 ha between September 1 and November 19. Although there were some patches of high severity, most of the area burned with moderate severity. These three fi res all show a range of severity levels, which led in turn to a range of post-fi re vegetation and fuels.
Mean size of unchanged patches was more than twice as large for prescribed fi res as for wildfi res or wildland fi re use fi res. The size
Figure 8. Example prescribed fi re, wildfi re, and wildland fi re use fi re severity maps. The prescribed South Fork Fire burned 1,404 ha in 2002. It has a large area of low severity fi re typical
of prescribed burns in Yosemite. The Tuolumne wildfi re burned 1,484 ha in 2003 and has large
patches of high severity. The 1988 wildland fi re use East LeConte Fire burned 1,547 ha and has a
differential also occurred for low severity patches, but it was not as great. Because
prescribed fi res tended to be low intensity
surface fi res, they were less likely to open
the canopy, and therefore resulted in the large unchanged patches mapped by Thode (2005).
Wildfi res had the largest patches of moderate
severity patches with some nearly twice as large as prescribed and wildland fi re use fi res. As intensity increases, severity increases
creating larger patches. Wildfi res had high
severity patches that were three times as large as the other two management types, but these patches were only half the size of the moderate severity patches. Most high severity areas occured where fi res burned through the canopy for a short period of time and then dropped back down to the surface. Sustained independent crown fi res, which can create large patches of high severity, have been rare and occurred in only the three largest wildfi res under extreme weather conditions.
Forests of the Sierra Nevada are partially characterized by their patchiness at large (100 ha to 1000 ha) scales, particularly in late successional old-growth (Franklin and Fites-Kaufman 1996). Within large forests, species composition and structure vary considerably at smaller (1 ha to 10 ha) scales (Langley 1996). Relative to areas of uniform forest cover, the patchiness of Sierra Nevada forests may be responsible for higher levels of plant and animal diversity, and at least some of this small scale heterogeneity has been maintained by vegetation-fi re feedbacks (Miller and Urban 1999, Stephens 2001). Fires can increase or decrease landscape heterogeneity through the creation of varying sized patches burned at a given severity.
Patch size may have implications for
future landscape heterogeneity and fi res.
Compared to wildland fi re use, prescribed
burns have more contiguous patches of low severity. While this may reduce fuel loading in the near term, the lack of canopy mortality
may be creating a larger area of more uniform canopy fuels. Although high intensity canopy
fi res have been rare in the park, perpetuation
of large areas of uniformly dense canopy cover could make future large-scale high severity
fi re more likely. Climate change may also be
increasing the possibility of previously rare fi re
events (McKenzie et al. 2004, Hessburg et al.
2005, Running 2006, Westerling et al. 2006).
Patch squareness, which measures the complexity of areas of burn severity, was similar for unchanged and low severity patches. Moderate and high severity patches for prescribed fi res were slightly more square than those of wildfi res and wildland fi re use
fi res. This could be attributed to the small
size of those patches; small patches tend to be less complex than large ones. As patches increase in size, there are more opportunities for convoluted shapes to occur. For example, small high severity patches comprised only 0.1 % of the 1993 prescribed North Fire (Figure 9). The high severity patch squareness value was 0.39, indicating a relatively simple patch shape. On the 1985 wildland fi re use Kendrick Fire, high severity patches were larger and comprised 9.6 % of area burned (Figure 9). The patch squareness for high severity patches was 0.85, indicating relatively more complex patch shape.
The most important ecological implication that can be drawn from these results is that prescribed fi res differ in their fi re regime attributes from both wildfi res and wildland fi re use fi res. When one or more fi re attributes differ from the natural fi re regime, the presence and abundance of plant and animal species could be altered. For example, out-of-season burning could affect germination, growth and fl owering of herbaceous plants and shrubs (Kauffman and
Martin 1990, but see Knapp et al. 2007) and
could impact breeding populations of nesting
animals. While there is justifi cation for the
Figure 9. Spatial complexity maps of the 1993 prescribed North Fire (left) and the 1985 wildland
fi re use Kendrick Fire (right). The North Fire had a patch squareness value for high severity
patches of 0.39, indicating relatively simple patch shape. The wildland fi re use Kendrick Fire had a patch squareness value for high severity patches of 0.85, indicating relatively more complex patch shape.
summer and early fall. Similarly, attempts should be made to burn with higher intensities. This will result in a greater proportion of the area being burned with moderate and high
severity, better mimicking the natural fi re
regime.
The signifi cant differences in fi re regime attributes suggest that land managers seeking to restore natural fi re regimes and characteristic forest composition and structure must consider more than just the amount of area burned or
fuels reduced. Prescribed fi res, as currently
implemented, and wildfi res produce patch
structures that are probably different from historic conditions. There are many tradeoffs between wildfi res and wildland fi re use, but
paramount is the return to more natural fi re
regimes and more structurally heterogeneous forests that have less potential for large,
catastrophic fi res. More areas need to be
treated by prescribed fi re and wildland fi re use to prevent the increase in high severity catastrophic fi res. As more areas are treated with prescribed fi res, the areas can be placed in the wildland fi re use zone, and the incidence of wildfi res will be reduced.
ACKNOWLEDGEMENTS
LITERATURE CITED
Byram, G.M. 1959. Combustion of forest fuels. Pages 61-89 in: K.P. Davis, Forest fi re control
and use. McGraw-Hill, New York, New York, USA.
Collins, B.M., J.D. Miller, A.E. Thode, N.M. Kelly, J.W. van Wagtendonk, and S.L. Stephens.
In press. Natural wildfi res become self-limiting in Sierra Nevada mixed conifer forests.
Ecological Applications.
Collins, B.M., and S.L. Stephens. 2007. Managing natural wildfi res in Sierra Nevada wilderness
areas. Frontiers in Ecology and the Environment 5: 523-527.
Daly, C. 2006. Guidelines for assessing the suitability of spatial climate data sets. International Journal of Climatology 26: 707-721.
Daly, C., W.P. Gibson, G.H. Taylor, G.L. Johnson, and P. Pasteris. 2002. A knowledge-based approach to the statistical mapping of climate. Climate Research 22: 99-113.
Deeming, J.E., R.E. Burgan, and J.D. Cohen. 1977. The National Fire Danger Rating System – 1978. USDA Forest Service General Technical Report INT-39.
Franklin, J.F., and J.A. Fites-Kaufmann. 1996. Assessment of late-successional forests of the
Sierra Nevada. Pages 627-662 in: D.C. Erman, editor. Sierra Nevada ecosystem project: fi nal
report to Congress, Volume II. University of California, Davis, Wildland Resources Center Report 37.
Frohn, R.C. 1998. Remote sensing for landscape ecology: new metric indicators for monitoring, modeling, and assessment of ecosystems. CRC Press, Boca Raton, Florida, USA.
Gassaway, L. 2007. Native American fi re patterns in Yosemite Valley: a cross-disciplinary study. Proceedings Tall Timbers Fire Ecology Ecology Conference 23: 29-39.
Heinselman, M.L. 1978 Fire in wilderness ecosystems. Pages 249-278 in: J.C. Hendee, G.H. Stankey, and R.C. Lucas, editors. Wilderness management. USDA Forest Service Miscellaneous Publication 1365.
Hessburg, P.F., J.K. Agee, and J.F. Franklin. 2005. Dry forests and wildland fi res of the inland
Northwest USA: contrasting the landscape ecology of the pre-settlement and modern eras. Forest Ecology and Management 211: 117-139.
Kauffman, J.B., and R.E. Martin. 1990. Sprouting shrub response to different seasons and fuel
consumption levels of prescribed fi re in Sierra Nevada mixed conifer systems. Forest Science
36: 748-764.
Key, C.H. 2006. Ecological and sampling constraints on defi ning landscape fi re severity. Fire Ecology 2(2): 34–59.
Key, C.H., and N.C. Benson. 2004. Landscape assessment (LA) sampling and analysis methods. Pages LA1-LA55 in: D.C. Lutes, R.E. Keane, J.F. Caratti, C.H. Key, N.C. Benson, S. Sutherland, and L.J. Gangi. 2006. FIREMON: Fire effects monitoring and inventory system. USDA Forest Service General Technical Report RMRS-GTR-164CD.
Knapp, E.E., D.W. Schwilk, J.M. Kane, and J.E. Keeley. 2007. Role of burning season on initial
understory vegetation response to prescribed fi re in a mixed conifer forest. Canadian Journal
of Forest Research 37: 11-22.
Kolden, C.A., and P.J. Weisberg. 2007. Assessing accuracy of manually-mapped wildfi re
perimeters in topographically dissected areas. Fire Ecology 3(1): 22-31.
McGarigal, K., S.A. Cushman, M.C. Neel, and E. Ene. 2002. FRAGSTATS: Spatial Pattern Analysis Program for Categorical Maps. University of Massachusetts, Amherst. <www. umass.edu/landeco/research/fragstats/fragstats.html> Accessed 6 July 2007.
McKenzie, D., Z.M. Gedalof, D.L. Peterson, and P. Mote. 2004. Climatic change, wildfi re, and
conservation. Conservation Biology 18: 890-902.
Miller, C., and D.L. Urban. 1999. Interactions between forest heterogeneity and surface fi re
regimes in the southern Sierra Nevada. Canadian Journal of Forest Research 29: 202-212.
Miller, C. and D.L. Urban. 2000. Modeling the effects of fi re management alternatives on
mixed-conifer forests in the Sierra Nevada. Ecological Applications 10: 85-94.
Miller, J.D., and A.E. Thode. 2007. Quantifying burn severity in a heterogeneous landscape with a relative version of the delta Normalized Burn Ratio (dNBR). Remote Sensing of Environment 109: 66–80.
Parsons, D.J. 2000. The challenge of restoring fi re to wilderness. Pages 276-282 in: D.N. Cole,
S.F. McCool, W.T. Borrie, and J. O’Loughlin, compilers. Wilderness science in a time of change. Volume 5: Wilderness ecosystems, threats, and management. USDA Forest Serverce Proceedings RMRS-P-15-VOL-5.
Rothman, H.K. 2007. Blazing heritage: a history of wildland fi re in the National Park Service.
Oxford University Press, New York, New York, USA.
Running, SW. 2006. Is global warming causing more larger wildfi res? Science 313: 927- 928.
Scholl, A. 2007. The role of people, fi re, and climate on fi re and vegetation dynamics in mixed conifer forests in Yosemite National Park, California. Dissertation, Pennsylvania State University, University Park, USA.
Skinner, C.N., and C. Chang. 1996. Fire regimes: past and present. Pages 1041-1067 in: D.C. Erman, editor. Sierra Nevada ecosystem project: Final report to Congress, Volume II. University of California, Davis, Wildland Resources Center Report 37.
Stephens, S.L. 2001. Fire history differences in adjacent Jeffrey pine and upper montane forests in the eastern Sierra Nevada. International Journal of Wildland Fire 10: 161-167.
Stephens, S.L., R.E. Martin, and N.E. Clinton. 2007. Prehistoric fi re area and emissions from
California’s forests, woodlands, shrublands, and grasslands. Forest Ecology and Management 251: 205–216.
Sugihara, N.G., J.W. van Wagtendonk, and J. Fites-Kaufman. 2006. Fire as an ecological process. Pages 58-74 in: N.G. Sugihara, J.W. van Wagtendonk, J. Fites-Kaufman, K.E. Shaffer, and A.E. Thode, editors. Fire in California’s ecosystems. University of California Press, Berkeley, USA.
Swetnam, T.W. 1993. Fire history and climate change in giant sequoia groves. Science 262: 885-889.
Swetnam, T.W., C.H. Basian, K. Morino, and A.C. Caprio. 2000. Fire history along elevational transects in the Sierra Nevada, California. University of Arizona Laboratory of Tree-Ring Research Final Report, Tucson, Arizona, USA.
Thode, A.E. 2005. Quantifying the fi re regime attributes of severity and spatial complexity using
fi eld and imagery data. Dissertation, University of California, Davis, USA.
Van Wagner, C.E. 1977. Conditions for the start and spread of crownfi re. Canadian Journal of
Forest Research 7: 23-34.
van Wagtendonk, J.W. 1994. Spatial patterns of lightning strikes and fi res in Yosemite National
van Wagtendonk, J.W. 2006. Fire as a physical process. Pages 38-57 in: N.G. Sugihara, J.W. van Wagtendonk, J. Fites-Kaufman, K.E. Shaffer, and A.E. Thode, editors. Fire in California’s ecosystems. University of California Press, Berkeley, USA.
van Wagtendonk, J.W., J. Fites-Kaufman. 2006. Sierra Nevada bioregion. Pages 264-294 in: N.G. Sugihara, J.W. van Wagtendonk, J. Fites-Kaufman, K.E. Shaffer, and A.E. Thode, editors. Fire in California’s ecosystems. University of California Press, Berkeley, USA.
van Wagtendonk, J.W., K.A. van Wagtendonk, J.B. Meyer, and K.J. Paintner. 2002. The use of
geographic information for fi re management planning in Yosemite National Park. The George
Wright Forum 19: 19-39.