R E S E A R C H
Open Access
A static video summarization method
based on the sparse coding of features and
representativeness of frames
Dong-ju Jeong
1, Hyoung Jin Yoo
2and Nam Ik Cho
1*Abstract
This paper presents a video summarization method that is specifically for the static summary of consumer videos. Considering that the consumer videos usually have unclear shot boundaries and many low-quality or meaningless frames, we propose a two-step approach where the first step skims a video and the second step performs
content-aware clustering with keyframe selection. Specifically, the first step removes most of redundant frames that contain only little new information by employing the spectral clustering method with color histogram features. As a result, we obtain a condensed video that is shorter and has clearer temporal boundaries than the original. In the second step, we perform rough temporal segmentation and then apply refined clustering for each of the temporal segments, where each frame is represented by the sparse coding of SIFT features. The keyframe selection from each cluster is based on the measure of representativeness and visual quality of frames, where the representativeness is defined from the sparse coding and the visual quality is the combination of contrast, blur, and image skew measures. The problem of keyframe selection is to find the frames that have both representativeness and high quality, which is formulated as an optimization problem. Experiments on videos with various lengths show that the resulting summaries closely follow the important contents of videos.
Keywords: Video summarization, Consumer video, Video analysis, Keyframe extraction, Keyframe selection
1 Introduction
The wide spread use of mobile phones and wearable cam-eras has brought a culture that many people enjoy cap-turing and sharing images and videos with one another. It is especially notable that users are capable of storing and accessing more and larger videos than before. Hence, it is also becoming important to efficiently search for the videos that contain the desired contents, where video summaries can help them to efficiently catch the main points and look for relevant data [1].
Video summarization is the condensation of a video into a storyboard that contains keyframes or several video segments [2], the goal of which is to make the video as small as possible while keeping the flow of the story and essential parts of frames and/or video clips. There have
*Correspondence: [email protected]
1Department of Electrical and Computer Engineering, INMC, Seoul National University, 1 Gwanak-ro, Gwanak-gu, Seoul 08826, Korea
Full list of author information is available at the end of the article
been a huge number of methods for the summarization of well-edited videos such as movies and TV contents [3–6], where a well-edited video means that it has clear shot boundaries and was shot under well-controlled envi-ronments with stable and high-quality cameras. In con-trast to these well-edited videos, consumer videos (shot by hand-held mobile cameras, camcorders, or egocentric cameras such as sports glasses and action cams) usually have unclear or no shot boundaries and also contain many low-quality frames or even meaningless ones. Hence, above mentioned video summarization methods, which were designed for the well-edited videos, do not work well for consumer videos, so recent studies are targeting consumer videos [2, 7–9].
In general, there are some challenges related to the consumer video summarization. First, it should work for various lengths of shots; especially it has to be able to treat a shot that may be very long in duration. This also means that it does not have to focus too much on visual
details in a frame and should avoid using a model that can-not represent the whole visual contents of a long video. Second, for treating various kinds of videos, it is desired to use features that can play important roles in any type of video. One may assume that the frames containing a person’s face or moving objects are important, but this is not always the case. The third one is that in address-ing the keyframe selection problem, we are given the difficult choice between two things: choosing represen-tative frames or quality ones. Last, because the desired number of keyframes is itself subjective, a video summa-rization method should be able to adjust the number of keyframes.
Considering the challenges stated above, we propose a new algorithm that is especially suited for summa-rizing long consumer videos in reasonable computation times. The proposed algorithm consists of two steps: the first step is skimming a video, i.e., reducing the number of frames by using spectral clustering with simple color histograms, which greatly reduces time for the refined clustering and keyframe selection in the second step. The refined clustering in the second step is to cluster the images based on the sparse coding of SIFT features. In this process, we can also define the representativeness with the sparse coding coefficients. We also formulate the quality measures of each frame in this step such as contrast, blur, and image skew. The main problem is to find the frames that have both representativeness and high quality, which is formulated as an optimization problem in the form of graph matching [10, 11]. Also, since not every method can meet the various requirements of users or diverse kinds of
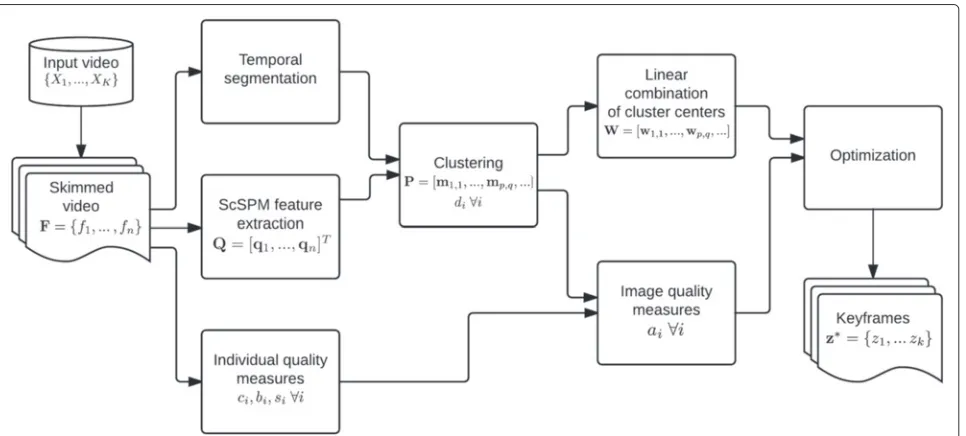
videos, the algorithm is designed to easily adopt new fea-tures if needed. Figure 1 shows a flowchart of our method, where each block contains notations for showing what is obtained from each processing step. Many experimental video clips and their step-by-step results produced by our algorithm are available in http://ispl.snu.ac.kr/~jeongdj/ videosummary.html.
The rest of this paper is organized as follows: The second section introduces the related works on video summarization, the third section presents video skim-ming and temporal segmentation, and the fourth section describes measuring the quality of frames and selecting keyframes. The experimental results and the conclusion are presented in the last two sections.
2 Related works
The conventional algorithms for video summary were developed for videos that are manipulated by pro-fessional editors. These well-edited contents have mostly clear shot boundaries but sometimes ambiguous ones such as fade in/out and camera view changes. Hence, the conventional algorithms focused on finding the ambiguous shot boundaries and also finding the keyframes in a shot that represent the shot. For example, Omidyeganeh et al. [3] developed a keyframe extrac-tion algorithm, where they exploited features extracted from the wavelet transform subbands of each frame to partition the whole video into subshots and select the final keyframes. Chasanis et al. [4] proposed an algo-rithm that uses shot boundary detection and the spectral clustering method, and they formulated the scene
tion as keyframe alignment. Although there are also many methods that do not detect shot boundaries [5, 12, 13], dividing the whole video into subshots con-tributes to stabilize the keyframe extraction results [3, 4, 14–17]. Given its importance, shot boundary detection is still a much studied topic [18–20].
However, as stated in the introduction, the above stated methods do not work well for unstructured videos (ama-teur and consumer videos) because they are poorly shot and edited. These videos have many unclear shot bound-aries, and they also have meaningless, redundant, or low-quality frames. Hence, studies focusing on unstructured videos have recently been gaining attention, which are focused on static or dynamic summaries of consumer and/or egocentric videos. For some examples of static summarization methods that we study in this paper, Cong et al. [7] considered video summarization as a dictionary selection problem, where keyframes that represent the whole video content form the dictionary. But this method is not suitable for long and complex videos because the long content is not well represented by a dictionary. The algorithm proposed by Ejaz et al. [8] was based on the assumption that visual attention would indicate the importance of each frame in general videos. They used spatial and temporal attention values and emphasized the motion information. However, this framework is vulner-able to some factors such as the capturers’ or objects’ movement and quality of frames and depends on how much time one determines to make a scene. Meanwhile, there have been some algorithms targeting only egocen-tric videos [2, 9]. They are similar to those for general consumer videos in that they perform temporal segmen-tation and score the frames based on certain criteria. However, they make use of information that is confined to the first-person views and needs high computatonal loads, which makes them unsuitable for videos not captured by first-person cameras and/or long videos. There are also several methods that focus on temporal segmentation of consumer videos [1, 9, 21, 22], where “temporal segmen-tation” may work as “shot boundary detection” for well-edited videos and it is also applied to video annotation algorithms [23, 24].
3 Video skimming and temporal segmentation
Consumer videos usually have redundant frames, when compared with movie or TV contents that are well edited. Hence, we first skim the video, i.e., remove the redun-dant frames by using spectral clustering with simple color histograms. The skimmed video is then temporally seg-mented for the second step.
3.1 Video skimming by spectral clustering
To remove the redundant frames very fast, we first apply a clustering method with simple features. Then, from each
of the clusters, we find some frames that are nearest to the center of the cluster. This results in a skimmed video, where redundant frames are naturally reduced and the scenes are represented by a relatively small number of frames, and also most of the transient scenes are elimi-nated.
To be specific, the video is first divided into evenly spaced subshotsX1,. . .,XK, each of which is about 3–4 min long in our implementation. Note that the first step is to roughly skim the video, and that the length of even spacing is not so important but needs to be short enough not to miss some important frames. For each subshot, we apply spectral clustering [25] with the normalized HSV histogram as a feature, for the fast grouping of similar frames as in [4]. Also, according to the report in [26] that the Hellinger distance measure instead of the Euclidean distance gives more plausible image retrieval results, we also apply this measure for the comparison of histogram features. Specifically, weL1 normalize the histograms and then square root each element so that each of them has unitL2 norm.
To be more precise with the spectral clustering of each subshot defined above, let us denote the kth subshot as Xk =[x1,x2,x3,. . .,xNk] , k ∈ {1,. . .,K}whereK is the
number of subshots andNkis the size ofXk. For each sub-shot, the similarity matrixA∈RNk×Nkand the matrixL= D−1/2AD−1/2are computed, whereDis the degree matrix each of whose diagonal entries is the sum of the elements belonging to the same row. The matrixLis used as a proxy of the Laplacian matrixI−L[25], whereIis the iden-tity matrix. Then, the spectral clustering to divide thekth subshot intoMclusters is to solve a relaxed optimization problem:
max
Y trace(Y
TLY) s.t. YTY=I
M (1)
whereYis the relaxed version ofZ∈RNk×Mdefined as
Z(i,j)=
1 ifxi∈(jth cluster)
0 otherwise. (2)
It is known that the maximum value of trace(YTLY) in (1) is equal to the sum of the Mlargest eigenvalues of L [27].1 Thus, in our clustering process, the
decent number of frames for each cluster that contains many similar frames and sometimes rare and transient frames. Thus, it is possible to remove the redundant frames and leave only a small number of frames by select-ing only the ones that are close to the cluster centers. The results of the first step, i.e., the skimmed videos for the input videos, are also available at the above stated site. For the rest of this paper, the “frames” refer to the frames in this skimmed video, which are denoted as F= {f1,. . .,fn}.
3.2 Temporal segmentation
The clustering in the above procedure is somewhat rough in that we use smallθa that produces many frames sim-ilar to the cluster centers, and also that the neighboring clusters contain almost the same results because the video is first evenly segmented so that neighboring segments may contain the same scene. The purpose of this rough clustering is just to obtain a skimmed video and also to remove redundant or unimportant frames for reducing computations for the following keyframe selection steps. For the keyframe selection, we need to apply refined clus-tering to the skimmed video and then find keyframes from each cluster. Temporal segmentation provides some video segments in each of which the clustering is per-formed. In this way, we force each segment to produce one or more keyframes because each segment is sufficiently large and important enough to have a keyframe. Without the temporal segmentation step, the clustering would be performed with all the frames inF, and some frame repre-senting an important part of the video might be precluded from the video summary.
For the temporal segmentation, we perform the kernel temporal segmentation (KTS) method [21], which detects the change points of a signal (a video stream here) sta-tistically. Since any kind of features can be used for this method, we reuse the color histograms that were used in the above process for saving the computations. Let H=[π(f1),. . .,π(fn)] denote the color histograms of the
frames. We define a kernel functionK:H×H→Ras
Kπ(fi),π(fj)=(fi)·(fj)
=1− √1
2π(fi)−π(fj)2
(3)
where : H → His the feature mapping indirectly defined byK, andHis the associated feature space. The KTS algorithm performs segmentation by minimizing an objective function such that the sum of within-segment variances is minimized, while penalizing over-segmentation simultaneously:
min m;t1,...,tm
Jm,n:=Lm,n+C·g(m,n) (4)
where m is the number of segment boundaries at
t1,. . .,tm, andLm,nis defined as
Lm,n= m
i=0
vti,ti+1, vti,ti+1 =
ti+1−1
t=ti
(ft)−μi22,
μi=
ti+1−1
t=ti (ft)
ti+1−ti
, t0=1,tm+1=n+1,
(5)
andg(m,n)can be computed as
g(m,n)=m(log(n/m)+1). (6) Note thatLm,nis the sum of all the within-segment vari-ances andg(m,n)increases when we add more segments, which penalizes over-segmentation. The constantC con-trols the trade-off between under- and over-segmentation. The within-segment variances in (5) can be computed as
vti,ti+1= ti+1−1
t=ti
(ft)22−2 ti+1−1
t=ti
(ft)·μi+(ti+1−ti)μi22
= ti+1−1
t=ti
(ft)22−
1
ti+1−ti
ti+1−1
t=ti (ft)
2 2 = ti+1−1
t=ti
K(π(ft),π(ft))− 1 ti+1−ti
ti+1−1
s=ti ti+1−1
t=ti
K(π(fs),π(ft)).
(7)
Since nothing but the inner products between’s needs to be known, our own kernel function and the Gram matrix can be efficiently exploited in the algorithm. Opti-mization of the objective function is based on dynamic programming, and it was reported in [21] that the time complexity of the algorithm is O(mmaxn2) where mmax
is the largest possible number of segment boundaries. Also, the n ×n Gram matrix and its cumulative sums are calculated for the within-segment variances, and the amount of memory they take up is one of the major problems. Because the runtime and memory complex-ity increase quadratically withn, reduction of redundant frames (decrease inn) in the above process is very effec-tive. For example, a 3-h-long video is reduced to 739 frames in the video skimming step, and the temporal seg-mentation and the next procedures are performed with
n=739.
representativeness and quality of a frame when selecting keyframes.
Specifically, our task of keyframe extraction is to find the optimal keyframe set z∗ = {z1,. . ., zk} from the entire candidate frame set F, where k is the number of keyframes, according to an optimization criterion:
z∗=argmin
z⊂F
λE1(z)+E2(z) (8)
whereE1andE2are the cost functions related to frame
quality and representativeness, respectively. To solve this problem, we formulate our task as a graph matching prob-lem, which can be effectively used to consider both frame quality and representativeness.
4.1 Measuring the quality and representativeness of a frame
In order to give a narrow chance of being a keyframe to the low-quality images, we measure the contrast as variance of pixels. The metric of blurriness is measured according to [29] and the skewness from [30]. For encoding these measures into the cost functionE1, we denote the badness
of contrast, blur, and skewness of theith frame asci,bi, andsi, respectively, which are normalized into the range of [ 0, 1] by the sigmoid function (a larger value means worse quality):
ci=2/(1+exp(−τ1·ci)), bi=2/(1+exp(−τ2·bi)),
si=
τ3·si ifτ3·si<1
1 otherwise ∀i∈ {1,. . .,n}
(9)
where ci, bi, and si are the original measures of ci, bi, andsi, respectively. Becauseci∈[ 0, 0.25] with normalized intensities andbi ∈[ 0, 1] as in [29], we choose different parameters τ1 = −20 and τ2 = −5 for the sigmoid
functions. Also, since the value ofsimeans the degree of skewness in radians, we setsito be proportional tosiwith τ3 = 2. These types of metrics can be used for the
sum-marization of any type of video and the quality measures may also be replaced with other metrics according to some specific input video types.
In addition, we observe that the users try to keep the cameras still (in the case of consumer video shots) or keep the sight for a while (in the case of egocentric video) when they are taking important scenes or observing prominent objects. Hence, in the consumer videos, the shots from still camera works are usually important ones, and also the image qualities are good due to stillness of a cam-era. Hence, we define one more measure of image quality for this, as the distance of a frame from its cluster center. Specifically, since the frames have small differences in the still scenes, the distance of theith frame from its cluster
center, denoted asdi, is used as an additional measure of image quality.
For this, we apply more refined clustering to the tem-poral segments obtained in the above procedure and find the distance of each frame from its cluster center. We refer “refined clustering” as the one using the SIFT vectors, rather than the simple color histograms that were used in the first step, for considering the patterns of objects in the scene and alleviating the demerits of color features. More specifically, we adopt the idea of spatial pyramid match-ing with dense SIFT descriptors (ScSPM) [31] devised for image classification, because we may regard the clustering as an image classification task and the ScSPM vector is a kind of feature that can overcome the limitation of color features; they do not distinguish some scenes with simi-lar color distributions [3]. The ScSPM method is based on sparse representation, butl2regularizer can also be used
with a sufficiently over-complete dictionary according to the studies of collaborative representation [32, 33]. That is, if we denotey,x∗, andDas a SIFT descriptor, its coef-ficient vector, and a visual dictionary respectively, thenx∗ is given by
x∗=argmin
x y−Dx
2
2 + αx22
=(DTD+αI)−1DTy
(10)
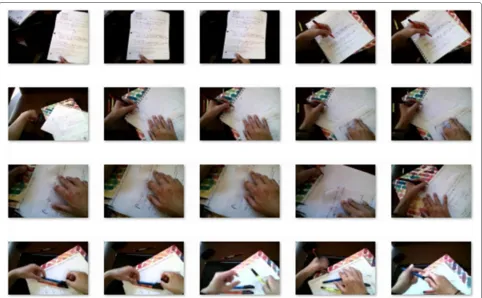
so it is possible to obtainx∗by simply multiplying yby a pre-computed matrix (DTD + αI)−1DT, where D is from a dataset containing diverse image categories such as Caltech-101 dataset [34] whose images can provide the atoms of a dictionary with sufficiently various shapes. One can use the atoms of a visual dictionary even though they would not be used to classify the images with which they are trained. Thus, the visual dictionaryDdoes not have to be trained with our experimental videos, and the frame clustering yields reliable results as shown in Fig. 2 that shows the examples of frames belonging to the same clus-ter. Now that each frame is represented by the coefficient vector defined above, let us denote the center of the vec-tors in the qth cluster of the pth temporal segment as mp,q. Then, the distance of each framefifrom its center is denoted asdi, which is added to the image quality mea-sures. In this situation, each cluster may be either small or big, which would give rise to an unbalanced distance measure. To alleviate this problem, we use Mahalanobis distance to computedis.
In summary, the quality measure forfi(thei-th frame) is defined as the combination of the distancedi, contrast
ci, blurrinessbi, and skewnesssiin the form of
ai=di
Fig. 2An example of images belonging to the same cluster. Frames that look similar to each other can agglomerate to form a cluster. The number of its members increases with the time duration of the scene they show
behaves like g(x) = x when x ∈[ 0, 1] and likeg(x) =
1 when x ∈[ 1,∞). When ai is close to 0, then fi is regarded as a good-quality frame. Because skewness does not have any meaning for severely low-contrast or blurred images, it should be used only to find out good frames among high-contrast and non-blurred images. For this reason, we use the g(ci + bi + si) term where si loses
its importance whenci orbi is large. Besides, the square root computation is intended to give similaraivalues to low-contrast or blurred images, and lastly,aiis multiplied by di to consider whether or not the scene caught the capturer’s attention as mentioned above. Figure 3 shows some frames with the lowest or highestai values in their clusters to compare these two classes of frames. Finally,
E1(z)in (8) is the sum ofais of the frames belonging to a keyframe set.
Based on the clustering result, the representativeness of the keyframes is defined as “how the selected keyframe set is close to the set of cluster centers{mp,q},” which is conceptually defined as
E2(z)=Diff(z,{mp,q}). (12)
4.2 Formulation of cost function and its optimization With the above conceptual definitions ofE1(z)andE2(z),
the optimization of (8) is actually formulated as a graph matching problem [10, 11, 35]. Specifically, we define a complete graphG=(V,E), whereVis a set ofmp,qs and every pair of vertices is connected by a single edge. The representativeness of keyframes in (12) is defined as “the similarity of their patterns to those of the cluster centers.” For this, suppose that a vectormp,qcan be reconstructed by the linear combination of the other ones. If the num-ber ofmp,qs isk, and we denote the concatenated matrix
P=[m1,1,m1,2,. . .,mp,q,. . .]∈Rd×k(dis the dimension ofmp,q), then the coefficients of their linear combinations are given by
min
wp,q∈Rk
Pwp,q−mp,q22+ηwp,q22
s.t.wTp,q1k =1,w(p,q),i=0
(13)
wherei is the index ofmp,qin P. In (13), the first term is for reconstruction errors, and the second is a regular-ization term that suppresses some big weights and gets wp,qto prefer to learn small weights. The smallerηgets, the more the role ofmp,q’s neighbors is emphasized for its reconstruction. By solving this problem, we can get the concatenated matrixW =[w1,1,w1,2,. . .,wp,q,. . .]∈ Rk×k.
Since each keyframe is extracted from its cluster, let us define a binary association matrixG ∈ {0, 1}k×nthat encodes this, whereG(i,j) =1 if thejth frame belongs to theith cluster. In addition, let the cost matrixA ∈ Rk×n contain the overall frame costs, where A(i,j) = aj if
G(i,j) = 1. Also, the feature vectors of all thenframes given by ScSPM form a matrix of the candidatesQ = [q1,q2,q3,. . .,qn]T∈Rn×d. Given the matricesG,A,Q, andW, we find the optimal correspondencesXby solving the following problem:
min
z⊂F λE1(z)+E2(z)⇔
min
X λtrace(AX
T)+ (I
k−W)XQ1
s.t.X∈ {0, 1}k×n, X1n=1k,
X(i,j)=0 if G(i,j)=0
(14)
where λ is a regularization weight for the trade-off between the frame cost and the reconstruction error.
FindingX is to get the keyframe set z∗ ⊂ F, soE1(z)
andE2(z)correspond to trace(AXT)and(Ik−W)XQ1
respectively where the former means the sum ofais of the selected keyframes and the latter decreases as the pat-terns of the keyframe set andPget similar to each other. Multiplying a frame cost bydiin (11) allows this optimiza-tion problem to be stable, which means that it reduces the influence ofλ’s variation. However, the problem of (14) is NP-hard and nonlinear with integer constraints. To effi-ciently solve this problem, the reconstruction error term is linearized and the binary constraint X ∈ {0, 1}k×n is relaxed to the continuous domain [ 0, 1]k×n, leading to the following problem:
min
z⊂F λE1(z)+E2(z)⇔
min
X,U,Vλtrace(AX T)+1T
k(U+V)1d
s.t.U≥0k×d, V≥0k×d, (Ik−W)XQ=U−V
X∈[ 0, 1]k×n, X1n=1k,
X(i,j)=0 if G(i,j)=0
(15)
whereU,V∈Rk×dare the auxiliary matrices representing upper- and lower-bounds respectively for(Ik−W)XQ1,
soU+Vmeans the size of the interval for(Ik−W)XQ, the norm of which is minimized along with1Tk(U+V)1d. This problem can be solved with linear programming. Last, to discretizeX, we perform the iterated conditional modes (ICM) row by row for every entry ofX. As a result of the above procedure,Xhas onlyk1s. Hence, if the ith col-umn ofXhas a non-zero entry, then it means that fi is selected as a keyframe. After sorting by time, we obtain the final storyboard. Finally, the overview of our method is illustrated in Fig. 4.
5 Experimental results
In our experiments, the UTE (UT Egocentric) [2] and the ADL (activities of daily living) [36] databases were used. The UTE dataset consists of 4 videos that are about 3– 5 h long, and the ADL dataset contains 20 videos, most of which are less than an hour long. For the comparison, we selected 5 different baselines: (1) uniform sampling, (2) clustering-based (with color histograms) [4], (3) visual attention-based [8], (4) object-driven (only for the UTE dataset) [2], and (5) our method without the optimiza-tion procedure. What we intend by the last one is that the frame that has the lowest cost in each cluster is selected as a keyframe.
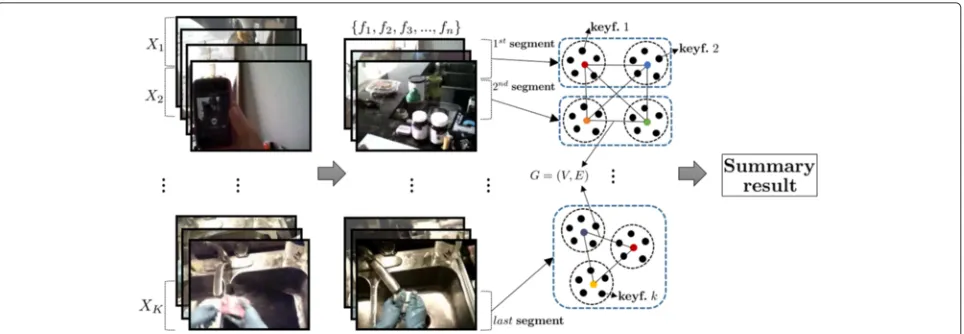
Fig. 4Overview of our method.{f1,f2,f3,. . .,fn}is the set of remaining frames after redundant frame pruning, andmp,qs combine to form a fiducial graph described in this figure.kframes are selected as the keyframes and sorted by time to result in the final summary
controlled them depending on the length of a video. Also, the value of λ was adjusted between 101 and 103. The value of η can be determined by examining the recon-struction error in (14), and it could be set as the value with the minimum reconstruction error for each input video; but we used the value of η consistent in every experiment for simplicity—to avoid repeating the same steps.
It has often been seen in the literature that only mean-opinion scores (MOS) are used for evaluation, while some researchers recently exploited the precision and recall criterion [1, 8] for objectiveness, especially for static sum-marization. For this, a human subject makes his/her own summary and then it is compared to the summaries made by automatic methods. Because comparing two images is itself subjective, it is important to reduce the subjectiv-ity in this work. Hence, we asked 11 subjects to take the following steps with the videos of the two datasets in the experiments: (1) summarize a video with a series ofevents
in words, (2) label the keyframes corresponding to the events in an automatic summarization result, and lastly (3) score each video summary from 0 to 5. We made every subject sure that an event may be matched to nothing or to more than one keyframe. Given the questionnaires sub-mitted by the subjects, we counted the number of labeled keyframes (NLK) and events reflected in a summary (NRE)to compute precision and recall scores. These are given by
Precision= NLK
NK
, Recall= NRE
NE
F-measure=2 Precision×Recall Precision+Recall
(16)
where NK and NE are the numbers of keyframes and events respectively. Tables 1 and 2 show these quantitative
results on the UTE and the ADL datasets, respec-tively. The clustering-based and the visual attention-based methods shared the temporal segmentation results with ours, but the latter one performed temporal segmenta-tion once more on each video segment to get more and shorter segments so that one frame with the highest score could be selected in each segment. The methods used to compare with each other resulted in the similar number of keyframes in our experiments, and we believe that it is the appropriate way to make both the best results of each method and a fair comparison. Some examples of video summaries are shown in Figs. 5 and 6.
The MOS criterion reflects the overall quality of a summary, particularly regarding image quality, impor-tant objects, and so on. Because each subject has his/her own scoring criterion, we used the standard scores (i.e., score←5+1·(score−mean)/std_dev) and confidence intervals. Table 3 shows the MOSs, and it means that the general criteria on keyframe quality (i.e., contrast, blurri-ness, skewblurri-ness, and duration of its scene) are efficient for video summarization. These criteria do not require much computational load and can be applied to videos with vari-ous lengths. The MOS results also show that the proposed method attained better scores than the other ones, as the precision-recall results do.
Table 1UTE dataset results averaged w.r.t. subjects
Method Video name NRE NE NLK NK Precision Recall F-measure
Uniform sampling P01 6.3 9.5 7.6 12 0.636 0.711 0.656
P02 7.8 10.2 8.9 15 0.594 0.778 0.668
P03 4.5 8.3 5.9 12 0.492 0.545 0.513
P04 6.4 9.0 7.6 16 0.477 0.718 0.565
Avg. 6.2 9.3 7.5 13.8 0.550 0.688 0.600
Clustering-based [4] P01 6.7 9.5 7.6 11 0.694 0.755 0.709
P02 8.4 10.2 10.5 16 0.653 0.823 0.720
P03 5.5 8.3 7.5 14 0.532 0.664 0.588
P04 7.9 9.0 10.1 18 0.561 0.894 0.677
Avg. 7.1 9.3 8.9 14.8 0.610 0.784 0.674
Attention-based [2] P01 7.1 9.5 7.9 12 0.659 0.790 0.708
P02 6.0 10.2 6.8 13 0.524 0.601 0.555
P03 5.5 8.3 7.0 12 0.583 0.661 0.611
P04 7.3 9.0 8.5 16 0.534 0.811 0.634
Avg. 6.5 9.3 7.6 13.3 0.575 0.716 0.627
Object-driven [8] P01 7.0 9.5 9.4 13 0.720 0.776 0.731
P02 7.5 10.2 10.9 19 0.574 0.741 0.641
P03 6.0 8.3 8.2 12 0.682 0.720 0.692
P04 7.0 9.0 8.5 16 0.534 0.793 0.632
Avg. 6.9 9.3 9.3 15.0 0.628 0.758 0.674
Proposed (w/o optimization) P01 6.1 9.5 6.5 10 0.655 0.686 0.659
P02 7.1 10.2 8.1 13 0.622 0.704 0.655
P03 5.8 8.3 7.4 11 0.669 0.707 0.683
P04 7.7 9.0 8.8 15 0.588 0.867 0.689
Avg. 6.7 9.3 7.7 12.3 0.634 0.741 0.672
Proposed P01 7.1 9.5 7.8 10 0.782 0.791 0.773
P02 8.2 10.2 9.3 13 0.713 0.811 0.756
P03 6.8 8.3 8.5 11 0.777 0.830 0.798
P04 7.9 9.0 9.5 15 0.630 0.889 0.725
Avg. 7.5 9.3 8.8 12.3 0.726 0.830 0.763
of this method’s result is an example that shows this case very well. It represents the scene at a kitchen, but it fails to show us what the capturer is mainly doing there. Using only color features also has the limit that it has trou-ble detecting a shot boundary between two video shots
similar in color [3]. Although the attention-based method extracts good keyframes in static scenes, it also selects the frames with strong motions as keyframes as shown in Fig. 6, which shows many transient scenes where the capturer is moving. It made us adjust the weight between
Table 2ADL dataset results averaged w.r.t. subjects and videos
Method NRE NE NLK NK Precision Recall F-measure
Uniform sampling 5.5 8.3 6.2 9.2 0.685 0.705 0.685
Clustering-based [4] 6.4 8.3 6.8 8.8 0.778 0.789 0.772
Attention-based [8] 5.8 8.3 6.6 9.5 0.705 0.746 0.710
Proposed (w/o optimization) 6.3 8.3 7.0 9.2 0.779 0.784 0.769
Fig. 5The video summaries of UTE P03.mp4 that is about 3 h long. Its scenes start at home, and the capturer goes grocery shopping, has a meal, and then washes the dishes. The result of our method shows a series of frames by which one could figure out the plot, while the others, especially the first three results, have many frames that would be bad to contain in a video summary
Table 3Average standard MOS results with 95 % confidence intervals in our experiments
Dataset Method MOS
UTE Uniform sampling 4.17±.30
Clustering-based [4] 5.10±.29
Attention-based [8] 4.49±.23
Object-driven [2] 5.36±.32
Proposed (w/o optimization) 5.18±.22
Proposed 5.69±.29
ADL Uniform sampling 4.41±.20
Clustering-based [4] 5.25±.18
Attention-based [8] 4.57±.16
Proposed (w/o optimization) 5.26±.14
Proposed 5.51±.16
the spatial and the temporal attention values described in [8] to obtain better results with the longer and more complicated videos. For this reason, the attention-based method seems to be more suitable for edited videos or those with lesser motions. The object-driven method has the superior abilities to find out keyframes with good quality of frames themselves, but it may give rise to false positives in a scene. If a scene shows many conspicuous things such as objects, hands, and faces, the algorithm tends to extract more keyframes in that scene than in oth-ers, which may make a subject regard them as false posi-tives. For example, this method’s result in Fig. 5 has many keyframes—in a certain sense, too many as compared to the video’s length—that show the scene at the kitchen and the fifth and sixth keyframes are almost the same. As a results, the object-driven method attained better results in evaluation on MOS scores than on precision-recall scores. The methods using clustering such as the clustering-based
one and ours have a problem with the number of clus-ters, because it determines the number of keyframes and whether or not some scene is reflected in a video sum-mary. The first two frames of our result in Fig. 6 show the same activity, so some of the subjects regarded one of them as a redundant keyframe. Also, the first keyframe of our result in Fig. 5 may be regarded as a false positive because the capturer stays home for a short time at the beginning of this video. Figure 7 shows a worse case with such problem. These redundant keyframes would disap-pear with a shorter summary’s length setting, but it might cause other proper keyframes to also be removed because of clustering with a constant threshold.
As mentioned above, we are given the choice between choosing representative frames and quality ones, so we formulate the last step in our algorithm as an optimization problem. Figure 8 shows the frames with the minimum values of ai or di in their clusters and the keyframes resulted from our optimization step with various values ofλ. This figure confirms that the keyframes with a small λvalue are similar to those closest to the centers of their clusters, while the ones with a largerλvalue tend to be similar to those with the minimumaivalues, as expected. In our experiments, the frames at the second row in Fig. 8 had little differences in the values ofai anddi with one another, so the keyframe results did not have exactly the same frames with the minimumaiordivalues in that clus-ter. While any image may be qualified as a good keyframe at the second row, the summary that has a laundry room image as the first keyframe is more suitable in terms of the video’s story, which led to the higher scores on both the precision and the recall criteria. However, someone might prefer the first frame at the first row, and this is basically a matter of opinion.
We conducted additional experiments to confirm how our method deals with the videos showing camerawork such as camera pan and zoom. The SumMe dataset [1] contains both first-person and third-person videos, which
Fig. 8Comparison of parts of the summaries on ADL P_07.mp4 with variousλvalues at the optimization step. This video shows the scenes, “going to a laundry room” and “using a computer.” Each row contains the frames in the first or second cluster of the video. The first two columns show the frames obtained with the minimum (a)aior (b)divalues, and (c–e) show the resultant keyframes withλ=0,λ=101, andλ=102, respectively. In the first row, even though the frames of (a) and (e) have high contrast, they are less appropriate ones as story board images of “laundry room,” while the frames of (b–d) would be more appropriate ones
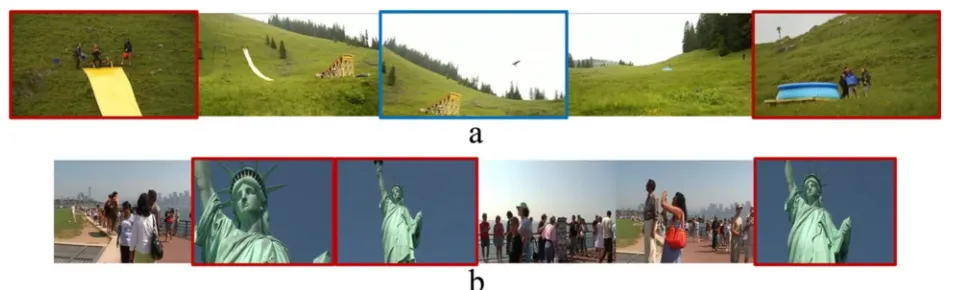
are a few minutes long, so we summarized the third-person videos with strong camerawork as shown in Fig. 9. A scene with camera zoom probably has important infor-mation (e.g., prominent objects), and if so, one of the frames within the scene qualifies for a keyframe. Those scenes are usually long or stable enough to clearly show important information, which can be encoded by our representativeness measure. The keyframes with red bor-ders in Fig. 9 were captured at the moments of zoom, and they hold a majority in the summaries. On the one hand, a scene with camera pan is probably transient and not suitable to have a keyframe; in fact, the video skim-ming and keyframe selection steps are likely to preclude those scenes from a summary. However, they sometimes have stable and meaningful information when the camera keeps tracking some objects as the third image in Fig. 9a. Even though this scene was captured at the moment of pan
and is rather short, many frames that look similar to each other formed a cluster and yielded a keyframe. Measuring duration of a scene can help to decide whether or not a scene with zoom or pan deserves to be included in a sum-mary, and the duration is one of our criteria for selecting keyframes.
As shown in Figs. 5 and 6, the summaries are different in length, which is because all but the uniform sampling method cannot set the exact number of keyframes in the experiments. This may be a limitation of our algorithm. Finally, as stated previously, some of the skimmed videos and static summary results are shown in http://ispl.snu.ac. kr/~jeongdj/videosummary.html.
6 Conclusions
We have proposed a video summarization algorithm for consumer videos, which is specifically designed for the
long and unedited videos. For the fast processing, the video is first roughly segmented and clustered to be a skimmed video, and then the keyframes with good qual-ity and representativeness are selected. At the first video skimming step, our method removes most of the redun-dant frames very fast by applying spectral clustering on the evenly spaced segments with simple color histogram features. In the second keyframe selection step, we formu-late the keyframe extraction as an optimization problem, where we consider the representativeness as the effective-ness of being a linear combination of other keyframes, and also consider quality in terms of contrast, blurri-ness, skewblurri-ness, and distinctiveness. Experimental results show that the proposed method works well on the UTE and the ADL datasets but shows some limitation in that the number of keyframes is not finely controlled, which needs further research in the clustering and optimization processes.
Endnote
1The notations related to the spectral clustering are
only for this section.
Competing interests
The authors declare that they have no competing interests.
Authors’ contributions
• A video summarization method is proposed, which is specifically suited for long and unedited consumer videos.
• For the fast summary of long and unedited videos, the input video is first skimmed by spectral clustering with simple color histogram features. • We balance the representativeness and image quality when selecting
keyframes, because there are many bad quality images in consumer videos, which is formulated as an optimization problem over a graph. • The representativeness is formulated in terms of similarity to cluster
centers, so that the selected frames effectively cover many of similar frames in a subshot.
Acknowledgements
This research was supported by Projects for Research and Development of Police Science and Technology under Center for Research and Development of Police science and Technology and Korean National Police Agency (PA-C000001).
Author details
1Department of Electrical and Computer Engineering, INMC, Seoul National University, 1 Gwanak-ro, Gwanak-gu, Seoul 08826, Korea.2Samsung Electronics, Ltd., 426-910 Gyeonggi Do, Suwon, Korea.
Received: 9 November 2015 Accepted: 12 June 2016
References
1. M Gygli, H Grabner, H Riemenschneider, L Van Gool, inEuropean Conference on Computer Vision. Creating summaries from user videos, vol. 8695, (2014), pp. 505–520
2. YJ Lee, J Ghosh, K Grauman, inIEEE Conference on Computer Vision and Pattern Recognition. Discovering important people and objects for egocentric video summarization, (2012), pp. 1346–1353
3. M Omidyeganeh, S Ghaemmaghami, S Shirmohammadi, Video keyframe analysis using a segment-based statistical metric in a visually sensitive parametric space. IEEE Trans Image Process.20(10), 2730–2737 (2011) 4. VT Chasanis, CL Likas, NP Galatsanos, Scene detection in videos using shot clustering and sequence alignment. IEEE Trans. Multimed.11(1), 89–100 (2009)
5. SEF de Avila, APB Lopes, A da Luz Jr, A de Albuquerque Araújo, Vsumm: a mechanism designed to produce static video summaries and a novel evaluation method. Pattern Recogn Lett.32(1), 56–68 (2011) 6. BT Truong, S Venkatesh, Video abstraction: a systematic review and
classification. ACM Trans Multimedia Comput Commun Appl.3(1) (2007). doi:10.1145/1198302.1198305
7. Y Cong, J Yuan, J Luo, Towards scalable summarization of consumer videos via sparse dictionary selection. IEEE Trans Multimed.14(1), 66–75 (2012)
8. N Ejaz, I Mehmood, SW Baik, Efficient visual attention based framework for extracting key frames from videos. Signal Process Image Commun.28(1), 34–44 (2013)
9. Z Lu, K Grauman, inIEEE Conference on Computer Vision and Pattern Recognition. Story-driven summarization for egocentric video, (2013), pp. 2714–2721
10. H Jiang, M Drew, Z-N Li, Matching by linear programming and successive convexification. IEEE Trans Pattern Anal Mach Intell.29(6), 959–975 (2007) 11. H Li, X Huang, L He, Object matching using a locally affine invariant and
linear programming techniques. IEEE Trans Pattern Anal Mach Intell.
35(2), 411–424 (2013)
12. M Furini, F Geraci, M Montangero, M Pellegrini, Stimo: still and moving video storyboard for the web scenario. Multimedia Tools Appl.46(1), 47–69 (2010)
13. N Ejaz, TB Tariq, SW Baik, Adaptive key frame extraction for video summarization using an aggregation mechanism. J Vis Commun Image Represent.23(7), 1031–1040 (2012)
14. W Chen, YJ Zhang, Parametric model for video content analysis. Pattern Recogn Lett.29(3), 181–191 (2008)
15. M Cooper, J Foote, inIEEE International Conference on Multimedia and Expo. Discriminative techniques for keyframe selection, (2005), pp. 502–505 16. A Amiri, M Fathy, Hierarchical keyframe-based video summarization using
QR-decomposition and modified k-means clustering. EURASIP J Adv Signal Process.2010:892124, 1–16 (2010)
17. M Guironnet, D Pellerin, N Guyader, P Ladret, Video summarization based on camera motion and a subjective evaluation method. EURASIP J Image Video Process.2007:060245, 1–12 (2007)
18. GG Lakshmi Priya, S Domnic, Walsh-hadamard transform kernel-based feature vector for shot boundary detection. IEEE Trans Image Process.
23(12), 5187–5197 (2014)
19. P Mohanta, S Saha, B Chanda, A model-based shot boundary detection technique using frame transition parameters. IEEE Trans Multimed.14(1), 223–233 (2012)
20. M Birinci, S Kiranyaz, A perceptual scheme for fully automatic video shot boundary detection. Signal Process Image Commun.29(3), 410–423 (2014)
21. D Potapov, M Douze, Z Harchaoui, C Schmid, inEuropean Conference on Computer Vision. Category-specific video summarization, vol. 8694, (2014), pp. 540–555
22. Y Poleg, C Arora, S Peleg, inIEEE Conference on Computer Vision and Pattern Recognition. Temporal segmentation of egocentric videos, (2014), pp. 1346–1353
23. I González-Díaz, T Martínez-Cortés, A Gallardo-Antolín, F Díaz-de-María, Temporal segmentation and keyframe selection methods for user-generated video search-based annotation. Expert Syst Appl.42(1), 488–502 (2015)
24. G Abdollahian, CM Taskiran, Z Pizlo, EJ Delp, Camera motion-based analysis of user generated video. IEEE Trans Multimed.12(1), 28–41 (2010) 25. AY Ng, MI Jordan, Y Weiss, inAdvances in Neural Information Processing
Systems. On spectral clustering: Analysis and an algorithm, (2001), pp. 849–856
26. R Arandjelovic, A Zisserman, inIEEE Conference on Computer Vision and Pattern Recognition. Three things everyone should know to improve object retrieval, (2012), pp. 2911–2918
27. H Zha, X He, CHQ Ding, M Gu, HD Simon, inAdvances in Neural Information Processing Systems. Spectral relaxation for k-means clustering, (2001), pp. 1057–1064
28. A Likas, N Vlassis, JJ Verbeek, The global k-means clustering algorithm. Pattern Recognit.36(2), 451–461 (2003)
29. F Crete, T Dolmiere, P Ladret, M Nicolas, The blur effect: perception and estimation with a new no-reference perceptual blur metric. Proc SPIE.
30. HI Koo, NI Cho, Skew estimation of natural images based on a salient line detector. J Electron Imaging.22(1), 013020–013020 (2013)
31. J Yang, K Yu, Y Gong, T Huang, inIEEE Conference on Computer Vision and Pattern Recognition. Linear spatial pyramid matching using sparse coding for image classification, (2009), pp. 1794–1801
32. D Zhang, M Yang, X Feng, inIEEE International Conference on Computer Vision. Sparse representation or collaborative representation: which helps face recognition? (2011), pp. 471–478
33. J Waqas, Z Yi, L Zhang, Collaborative neighbor representation based classification usingl2-minimization approach. Pattern Recogn Lett.34(2), 201–208 (2013)
34. L Fei-Fei, R Fergus, P Perona, Learning generative visual models from few training examples: an incremental bayesian approach tested on 101 object categories. Computer Vission Image Understading.106(1), 59–70 (2007)
35. F Zhou, J Brandt, Z Lin, inIEEE International Conference on Computer Vision. Exemplar-based graph matching for robust facial landmark localization, (2013), pp. 1025–1032
36. H Pirsiavash, D Ramanan, inIEEE Conference on Computer Vision and Pattern Recognition. Detecting activities of daily living in first-person camera views, (2012), pp. 2847–2854
Submit your manuscript to a
journal and benefi t from:
7Convenient online submission
7Rigorous peer review
7Immediate publication on acceptance
7Open access: articles freely available online
7High visibility within the fi eld
7Retaining the copyright to your article