Punching Behaviour of Reinforced Concrete Footings at Testing
and According to Eurocode 2 and
fib
Model Code 2010
Zoran Bonic´*, Nebojsˇa Davidovic´, Todor Vacev, Nikola Romic´, Elefterija Zlatanovic´, and
Jelena Savic´
(Received August 24, 2016, Accepted July 17, 2017, Published online December 22, 2017)
Abstract: Punching shear resistance of column footings and foundation slabs varies significantly in different standards. The reason for this is because standards define differently the position of the critical perimeter in which the punching shear resistance should be determined, and quantify the influences of the main parameters like effective depth, shear slenderness, compressive strength of concrete, longitudinal reinforcement ratio and tension yield stress of reinforcement in different ways. In order to quantify the level of safety in Eurocode 2 and infibMC 2010, their design results are compared with the test results of the series of footings tested in completely realistic boundary conditions in terms of the subgrade soil. Besides the performed tests results, the analysis of the other investigations of the footing punching rested on the real soil is also included. Thus was obtained the answer to the question how individual characteristics of the footings and of the soil affect the punching bearing resistance and how accurately Eurocode 2 andfibMC 2010 predict the bearing capacity of the tested column footings. At the end, based on the test results and on the tests of others, and on and performed numerical analyses, a possible modification of Eurocode 2 in the field of reinforced concrete footing was proposed.
Keywords:column footing, experiment, punching, reinforced concrete, Eurocode 2,fibMC 2010.
1. Introduction
Shallow foundations transmit structural loads to the near-surface soil. Column footings and foundation slabs are main types of shallow foundations and structural members which support columns. Control of punching of the columns through those footings is mandatory part of the design of reinforced concrete footings exposed to notable concentrated forces through the columns. Complexity of the stress state in the footing rested on deformable ground requires, along with a detailed theoretical analysis, some experimental investi-gations in order to draw correct conclusions and to confirm the introduced theoretical postulates.
Behaviour of column footings and foundation slabs under load depends in general case on the soil characteristics, type and characteristics of the material of the footing and inten-sity of the load. Typically, high concentrated loads in the columns may lead to the abrupt failure of those footings— punching the column through the footing.
Although foundations have essential influence on the behaviour of the structure and to the soil, standards do not pay enough attention to their analysis, and in some standards
the specific details of the foundation analysis are not even mentioned.
2. Research Background
Concentrated load often causes high shear stresses in the loading zone, which may lead to the nonductile, sudden and brittle punching failure that was widely investigated at different kinds of structures, and especially at punching of flat slabs (Belletti et al.2015a; Bonic´ et al.2010; Brooms 2005; Fe´de´ration Internationale du Be´ton (fib) 2010; Hallgren and Bjerke 2002; Hallgren et al. 1998; Halvonik et al.2016; Hegger et al. 2006,2007, 2009; Husain et al. 2017; Kabir et al. 2016; Kee and Nam 2015; Kumer and Hoque2015; Menetrey 2002; Muttoni and Schwartz1991; Muttoni 2008; Muttoni and Ferna´ndez 2008, 2012; Olson (1989/2003); Pbdrby 1967; Siburg and Hegger 2014;
Siburg et al. 2014; Simo˜es et al. 2016a, b; Talbot 1913; Timm2003; Urban et al. 2013; Vacev et al. 2015). There are several models of punching of slabs and footings and calculation methods but none of them was generally accepted, so there exist significant differences regarding the determination of the position of the critical control perimeter in which the control of the of punching should be conducted, as well as regarding the quantification of the influences of the main parameters that affect the punching. In the majority of standards and proposed design models a unique control perimeter at certain distance from the Faculty of Civil Engineering and Architecture,
University of Nisˇ, Aleksandra Medvedeva 14, Nisˇ, Serbia. *Corresponding Author; E-mail: zokibon@yahoo.com CopyrightÓThe Author(s) 2017. This article is an open access publication
International Journal of Concrete Structures and Materials Vol.11, No.4, pp.657–676, December 2017
column faces is adopted. Thereat this distance may be varied significantly depending on the standard and pro-posed design model. Another way of determination of the critical perimeter is represented in the Eurocode 2. Here the position of the critical control perimeter is not constant, but the checking of the punching shear resistance of the con-crete is conducted at several perimeters within the zone of 2d from the column edges, where d is effective depth of the footing section. Thereat the control perimeter which gives the lowest value of the punching resistance represents the critical perimeter.
Complexity of behaviour of the soil and complexity of the subsoil-structure interaction lead to the fact that in majority of the standards is adopted the empirical method of design of the punching shear resistance of reinforced footings and reinforced foundation slabs. The fact that the number of the tested footings is considerably lower than the number of tested flat slabs lead to the situation that, due to the similarity of the problem, for the design of the punching shear resistance of reinforced concrete footings and reinforced concrete foundation slabs take empirical expressions obtained at the punching tests of reinforced
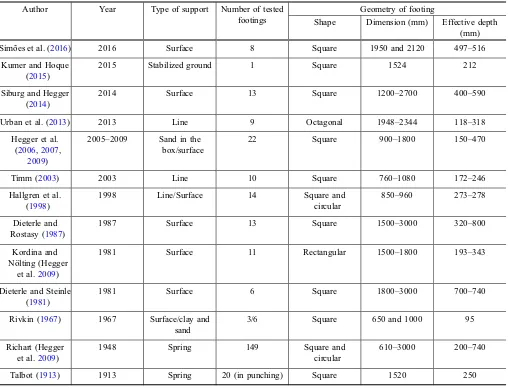
concrete flat slabs. Overview of the research of footings done until now, according to the available literature data, is presented in Table1. Even when the punching tests are conducted on footings, for the reason of simplification of organization of the experiment, the soil was in most cases simulated by hydraulic jacks, by steel springs, and by line resting, which produces the same effect as uniform reac-tive load of the soil. Punching investigation of the footing rested on real soil was done in practice only by Hegger et al. (2006, 2007, 2009)—in a sandbox, by Rivkin (Pbdrby 1967)—on sand and clay in situ, and by Kumer
and Hoque (2015) on stabilized soil.
In the paper is treated the influence of the main parameters to the punching shear resistance and punching behaviour of the reinforced concrete footings and foundation slabs, like: compressive strength of concrete, flexural reinforcement ratio, shear slenderness of the footing, soil reactive pressure distribution, stiffness of the footing-soil system, and mech-anism of footing punching.
The key result of the conducted parametric study will be determination of the factors whose influence is dominant in assessment of column footing punching.
Table 1 Overview of previous experiments on column footings.
Author Year Type of support Number of tested
footings
Geometry of footing
Shape Dimension (mm) Effective depth
(mm)
Simo˜es et al. (2016) 2016 Surface 8 Square 1950 and 2120 497–516
Kumer and Hoque
(2015)
2015 Stabilized ground 1 Square 1524 212
Siburg and Hegger
(2014)
2014 Surface 13 Square 1200–2700 400–590
Urban et al. (2013) 2013 Line 9 Octagonal 1948–2344 118–318
Hegger et al.
(2006,2007,
2009)
2005–2009 Sand in the
box/surface
22 Square 900–1800 150–470
Timm (2003) 2003 Line 10 Square 760–1080 172–246
Hallgren et al.
(1998)
1998 Line/Surface 14 Square and
circular
850–960 273–278
Dieterle and
Rostasy (1987)
1987 Surface 13 Square 1500–3000 320–800
Kordina and No¨lting (Hegger
et al.2009)
1981 Surface 11 Rectangular 1500–1800 193–343
Dieterle and Steinle
(1981)
1981 Surface 6 Square 1800–3000 700–740
Rivkin (1967) 1967 Surface/clay and
sand
3/6 Square 650 and 1000 95
Richart (Hegger
et al.2009)
1948 Spring 149 Square and
circular
610–3000 200–740
3. Experimental Investigation
For experimental testing program, conducted from 2009 to 2014, in situ specimens were provided along with subgrade soil preparation in order to achieve required geotechnical properties. Specimens were column footings with defined dimensions and characteristics of concrete and reinforce-ment. Figure1 represents the scheme of the experimental setup.
As one may see from Fig.1, a steel frame for the exper-imental purposes was made. Its role is reception of the hydraulic jack reactive force. The frame is a steel space structure consisted of a tin plate bottom and a space frame (a pair of vertical rods, two pairs of struts and strong horizontal crossbeam. The frame construction, as well as its dimensions enable forming of failure surfaces in the soil under the footing, in case of reaching sufficient value of force in the column. In this experiment, a step further has been done in respect to the earlier laboratory experiments documented in
literature, because the footing testing was conducted within the completely realistic boundary conditions in terms of the soil. Simultaneously, comparison and verification of the
Fig. 3 Test frame in the foundation pit.
Fig. 1 Scheme of the experimental setup.
Table 2 Achieved characteristics of test foundations.
Footing no. Footing height
h (mm)
Effective depth d (mm)
Concrete
strength fcm
(MPa)
Rebar diameter (mm)
Reinforcement
ratioqt(%)
Yield strength of reinforcement
fym(MPa)
Soil modulus of compressibility
MS(MPa)
Ultimate load (kN)
F1 200 175 30.37 8 0.40 570 54.0/61.2 1001/906a
F2 150 125 30.37 8 0.40 570 76.7 1050
F3 125 100 16.83 8 0.40 570 48.0 430
F4 175 150 16.83 8 0.40 570 39.5 656
F5 150 125 15.28 8 0.40 570 46.0 451
F6 150 125 7.92 8 0.40 570 37.5 440
F7 150 125 15.83 8.5 0.27 477 60.2 527
F8 150 125 15.83 8.5 0.48 477 66.5 645
F9 150 125 15.83 8.5 0.91 477 57.0 720
a
During the first test, the column stub failed at the load of 1001 kN. After a new column was constructed, the footing was punched at load of 906 kN.
earlier tests done in laboratories (taken from the literature), with these in situ tests was provided.
For the adopted conditions of the footing and soil (data given further in the paper) a soil bearing capacity analyses were done according to Eurocode 7. Thereat, it was adopted that the safety factors are equal to one. The internal friction angle of the soilu0was adopted based on recommendations from the scientific literature (Bowles2001). As this angle is increasing with the increase of the soil compaction, and considering that the soil compaction increased during the footing loading, the assessment of the ultimate bearing capacity of the soil was performed for different values in the rangeu0 =36–40°. For these values ofu0and for cohesion c0 =0, the ultimate axial forces in the column were in the range of 215.8–429.0 kN. Since the achieved punching forces during the experiment were significantly higher (even 1050 kN), and soil failure under the footing was not regis-tered, one may conclude that Eurocode 7 gives conservative results for the footings encompassed by this experiment.
All tested footings failed by punching of the column through the foundation body, and measured forces are given in Table2.
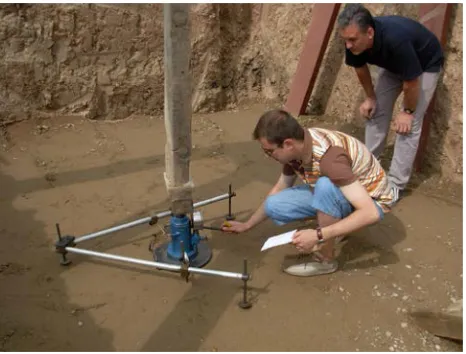
The experiment was performed by digging a pit with layout dimensions 495 m, and depth of 3 m, in which the prepared steel frame was lowered to the bottom (Figs.2,3). The excavated material was replaced with river aggregate of controlled density and size distribution (Fig.4). Thus pre-pared mixture was embedded into the 30 cm thick layers, and the compaction of each layer was done by vibrating plate. After the compaction of each layer, evaluation of compaction was done by circular plate load test and by dynamic test with light falling weight device (Fig.5). The measured mean values of the modulus of compressibility in the layers were in the range of 43.3–66.7 MPa. Also, com-paction of the top layer of subgrade soil was controlled before testing of each footing, and these values were in the range of 37.5–76.7 MPa (Table2), and they correspond to normal compaction of subgrade soil.
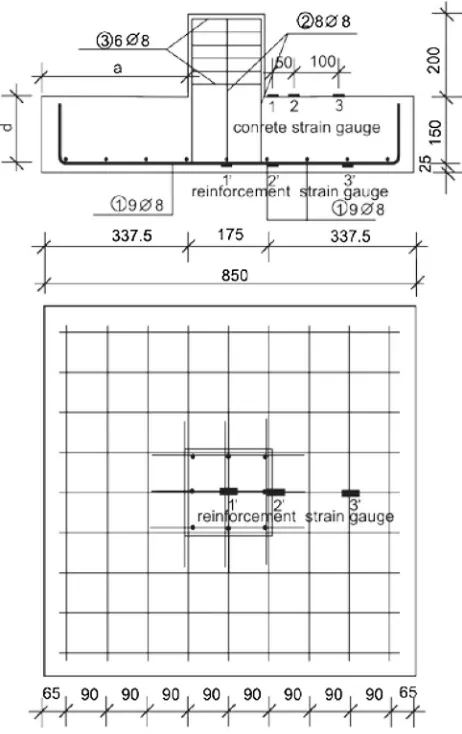
Footing was loaded by hydraulic jack with axis-symmetric vertical force until the occurring of punching of the footing (Figs.6, 7). The adopted dimensions of the specimens— precast column footings were 85985 cm in layout (Fig.8). The selected footing dimensions correspond in layout to the experiments of Hallgren and Hegger (Hallgren and Bjerke 2002; Hallgren et al.1998; Hegger et al.2006,2007;2009) Fig. 4 Granulometric composition of the subgrade soil.
Fig. 5 Control of the soil compactness.
Fig. 6 Experimental setup.
(for the purpose of result comparison). The footing depths were 12.5–20.0 cm and the diameters of the applied steel reinforcing bars were Ø8 and Ø8.5 mm. The reinforcement ratio of the footings was ranging from 0.27 to 0.91%. The properties of the used steel were determined on three sam-ples. The obtained mean values were as follows: tensile strength ftm=536–653 MPa and yield fym=477 and 570 MPa.
For the construction of the footings a three-fraction con-crete with maximum aggregate size of 16 mm and standard Portland cement were used. Concrete compressive strength was obtained at the time of testing using three cube speci-mens with dispeci-mension of 15 cm and one standard cylinder specimen, and all averaged values were converted to a standard cylinder. Mean values for all specimens are given in Table2.
4. Testing Procedure
The specimens (precast footings) were placed on the soil surface and loaded by vertical centric force applied by a hydraulic jack positioned between the crossbeam and the footing column stub (Figs.6,7). Load increments were set at approximately 50 kN. The load was kept constant at every step until the subgrade soil consolidation finished for the applied load, which was registered by observing the process of vertical displacements at the points on the footing corners and on the column stub. During the experiment, the fol-lowing parameters were measured every second: strains in the reinforcement and in the concrete of the footings, vertical displacements of the points on the footing corners and on the column stub, intensity of the applied force during loading, and value of the contact pressures in the subgrade soil. Applied force was measured by dynamometer HBM RTN— C3 (Fig.7), and vertical displacements of the corner and column stub were measured by using linear variable differ-ential transformer (LVDT) gauges (Fig.7). During the test-ing, the contact soil pressure was measured by soil pressure cells Ace Instruments with diameter of 100 mm and capacity of 3.0 MPa (Fig.9).
5. Comparison of the Test Results
with the Eurocode 2
For the purpose of mutual comparison of the results from the performed experimental investigations with the results of the punching analysis given by the up-to-date standards, the Eurocode 2 (2008) was used. In this standard the punching shear resistance should be checked at the column periphery and within the basic control perimeter at a distance of aEC2¼2:0d from the column face, wheredis the effective depth. This document does not prescribe explicitly the control perimeter that should be adopted as governing for the footings (distance aEC2 in the expression (1)), but recom-mends checking of different perimeters at distance smaller
then 2.0d from the column face. The lowest value of the resistance found in this way governs the design (Fig.10).
According to the Eurocode 2 the punching shear resistance of the concrete, vRd at distance aEC2\2:0d from the periphery of the loaded area is calculated as:
vRd¼CRd;ck ð100qlfckÞ1=3 2d aEC2
vmin 2d aEC2
ð1Þ Fig. 8 Sample of a tested footing with dimensions and position of measuring spots for reinforcement and concrete strain gauges.
whereaEC2is the distance from the periphery of the loaded area to the control perimeter considered, determined itera-tively, CRd;c¼0:18=cC the empirical factor with cC being the material resistance factor for concrete (1.5),ffiffiffiffiffiffi k¼1þ
200 d
q
2:0 (d in mm) the size effect factor of effective depth, fck the characteristic cylinder compressive concrete
strength, ql the flexural reinforcement ratio, vmin¼0:035 k3=2f1=2
ck the minimal punching shear capacity, d the effective depth of a slab (footing).
Eurocode 2 allows reduction of the punching force for the part of the reactive pressures under the punching body, so for a concentrated load the net applied shear force that causes the punching of the column through the foundation,VEd;red; is given by the expression valid for uniformly distributed stresses in the subgrade soil:
VEd;red¼VEdA0rn ð2Þ
whereVEdis the column load,rnthe effective soil pressure
(without the influence of the self-weight of the footing) within the control perimeter considered, A0the area within the control perimeter considered.
Based on that, after transformations, column loadVEd is:
VEd¼VEd;red A AA0
¼VEd;red 1A0 A
ð3Þ
whereAis the area within the base of the footing.
Eurocode 2 defines the shape of the control perimeter (Fig.10a). Position of the most unfavourable control perimeter (denoted as a =acr) within the basic control
perimeter has to be always determined by iterative proce-dure. After the perimeterucr(acr) and its surface areaA0are determined, the net applied shear capacity can be calculated as:
VRd¼vRducrdVEd;red ð4Þ
Additionally, in the comments to the Eurocode 2, in the European Concrete Platform—ECP (2008), there are instructions for determination of the position of the critical perimeter and recommendations for using of a special dia-gram obtained using Eq. (1), but without the minimal value vmin, and considering thatCRd,c=0.12. These directions for
the ratio of the footing length to the column lengthl/cand for the ratio of the column length to the effective slab depth
c/d, gives the relationshipacr/d(according to the diagram in
Fig.10b). In most cases value acr=aEC2 is less than 2d, which means that the slope of the punching body of the footings is steeper than the slope of the slabs.
Also, Eurocode 2 limits maximum punching shear resis-tance of the footing vRd;max (at the column periphery with perimeteru0) is limited to:
vRd;max¼0:4mfcd ð5Þ
where v¼0:6 1 250fck is the factor accounting for the strength reduction of concrete compression struts in cracked concrete due to lateral tension stresses,fcd¼accfck=cC the design concrete compressive strength withacc=1.0 being a
coefficient taking account for long-term effects.
The smaller value from (1) and (5) governs the design. According to Hegger et al. (2006), this equation signifi-cantly overestimates the maximum punching shear capacity for higher concrete classes. To overcome this problem, a new equation for the assessment of vRd;max at the column periphery of the loaded area with a length of u0 (instead Eq. (5)) is proposed by Hegger (Halvonik et al.2016):
vRd;max¼16
ffiffiffiffiffiffiffiffiffiffi
d=u0
p
vRd;c ð6Þ
where vRd;c¼CRd;ck ð100qlfckÞ 1=3
. Certainly, the applied shear force can be reduced only by the effective soil pressure within the column perimeteru0.
In order to indicate the significance of the control perimeter when using the expression (1), a comparative calculation of punching of the tested footings was carried out according to the expression (1), for the cases when:
– The basic control perimeter is at the distance aEC2¼ 2:0d from the column edge (column 7, Table3—just as an illustration)
– The critical control perimeter is equalled to critical control perimeter aEC2¼acr which gives minimal punching force (column 9, Table3)
– The critical control perimeter is at the distance obtained using the diagram from Fig. 10b), (column 11, Table 3).
In these calculations, for the purpose of comparison with the test results, all material and strength reduction factors incorporated in the Eurocode 2 equations were taken as unity. Based on that, the obtained results are given in Table3. Besides that, specified calculation was also Fig. 10 Position of the basic and critical control perimeter: a according to EN 1992-1-1 (2004); b according to Eurocode
performed for the remained footings rested on real ground, and tested until punching (from Table2).
Using the expression (4), for the control perimeters that are distant from the column face (i.e., where aEC22:0d), one gets high values for area within the control perimeterA0, and consequently high values for the punching capacity of the footing,VEd, according Eq. (3), (Bonic et al., column 7,
footing F1 and Hegger et al., column 7, footings DF8 and DF10). Also, if one would adopt for the control perimeter the distance of 2.0dfrom the column edge, then the basis of the punching body could be greater than the footing base, in case of footings with smaller dimensions in layout and rel-atively high values ford, Considering that the column force is subtracted by the part of the reaction encompassed by control perimeter, the governing force for the control of punching would be very low. Moreover, there may be cases in which the control perimeter is obtained out of the footing layout, which would lead to a situation that the governing punching force is negative (Hegger et al., column 7, footings DF4–DF7). Because of that, the assessment of the column footing punching in the basic perimeter at distanceaEC2 2:0d regarding the column face (Table3, columns 7 and 8), is given just as an illustration, and it should not be applied in practical use.
Recommendations based on the ECP (2008), (Fig.10b, columns 11 and 12 in Table3) give almost the same results as the calculation in the columns 9 and 10, (which was quite as expected, because the diagram used to determine the position of the control section for the calculation of columns 11 and 12 was based on Eq. (1)). For the purpose of finding the minimal punching force using of these diagrams instead of punching control in several perimeters can be recommended.
One may conclude from columns 4 and 9 that for shear slenderness ratios, e.g.,a=d 2:5 one gets control perime-ters at the distance acrd from the column edge, which corresponds to the slope of the punching body of 45°. For the values of the ratioa/dB2.5 from the column 4, one gets ratiosacr/d B1 from the column 9, while for higher values
of the ratioa/done gets ratiosacr/d[1. This corresponds to
the conclusions in the other experimental investigations of footings (done with surface type supports and in laboratory conditions) (Hegger et al. 2006, 2007, 2009; Siburg and Hegger2014; Simo˜es et al. 2016) where it was concluded that the slope angle of the punching body towards the hor-izontal plane decreases with increased slenderness of the footing, which corresponds to the results of the experiment, and may be seen in Fig.11. From Fig.11one may clearly notice that this angle changes with the increase of the effective depth of the footings, so for the footing F3 this
angle amounts to around 35°, and for the footings with the greater effective depth, F2 and F1, the angle is approxi-mately 45°.
Results in Table 3 confirm the assumption given in Hal-vonik et al. (2016) that position o the critical control perimeter, that is, the ratioacr/ddoes not depend of the other
parameters, which affect the punching shear resistance of column footings, like the compressive strength of concrete and flexural reinforcement ratio, but only from the shear slenderness of the footing—a/d. Because of that, the fol-lowing theoretical analysis of the dependence of the ratio acr/d on the shear slenderness of the footing (a/d) is
con-ducted (Fig.12).
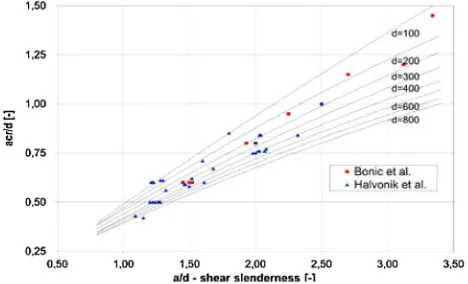
For the various control perimeters, that is, for different values ofa and ratio a/d the following theoretical analysis was done, according to Halvonik et al. (2016): the reduced punching shear force VEd,red(a) of various control perimeters was calculated, and as a governing value was adopted the minimum value of VEd,red(a). In assessment of the VEd, red (a) the upward force within assumed control perimeter at distance ‘‘a’’ due to the reactive soil pressure was subtracted. A uniformly distributed soil pressure under the footings was assumed. Thus was obtained the dependence of the ratioacr/ d on the ratio a/d, which is presented in the diagram in Fig.13. The calculation is conducted for common depths of pad foundations and foundation slabs, that is, for d=100–800 mm.
On the diagram in Fig.13are drawn the ratiosacr/danda/ d for 50 experimentally investigated footings, according to Halvonik et al. (2016), which were not rested on real soil. The same ratios are entered for the footings which were rested on real soil in experiments, too.
From the diagram one may conclude that the theoretically calculated values show good agreement with the
Fig. 11 Saw-cut of the failed footings.
Fig. 12 Relation between acr/d and shear slenderness a/
experimental results, which confirms the correctness of the calculation of the position of the critical control perimeter in the standard EC2.
In further analyses the punching force of the footing F1 was not taken into account, because in this footing stub failure occurred at force value of 1001 kN. After making a new column, the footing was punched at force value of 906 kN.
6. Comparison of the Test Results with the
fib
MC 2010
International Organization fibhas introduced a new doc-ument (Model Code 2010) with new model for the assess-ment of punching shear resistance of flat slabs and foundations. This physical model is based on the Critical shear crack theory (CSCT) and it has been calibrated by large number of experiments on isolated flat slab elements, but also can be used for column footings and foundation slabs. The first model based on Critical shear crack theory has been developed and later refined by Muttoni and co-workers (Muttoni and Schwartz1991; Muttoni 2008; Mut-toni and Ferna´ndez2008,2012), and later it was subject of numerous studies and analyses (Belletti et al. 2015a; Hal-vonik et al. 2016; Siburg et al.2014; Simo˜es et al. 2016). This model determines the design punching shear force,VEd,
and design punching shear resistance,VRd,cwithout
punch-ing shear reinforcement by expression:
VEdVRd;c¼kw
ffiffiffiffiffiffi
fck p
cC b0d ð7Þ
wherefckis the characteristic cylinder compressive concrete
strength, d the effective depth of footing, cC the material
safety factor for concrete (1.5), b0 the critical perimeter length is determined as b0=keb1,red where factor ke
considers a non-rotationally symmetric shear force distribution, set to ke=0.9 for inner columns andb1,redis perimeter length at distance 0.5d from the column face. As well as the Eurocode 2, the fib MC 2010 also allows for reduction of the punching force for the part of the effective reactive pressures inside the critical perimeter b0, e.g.
DVEd=A0.5drgd. kw is the parameter which depends on
the rotations of the slab around the support region outside the critical shear crackw(in radians), and calculated as
kw¼
1
1:5þ0:9wdkdg
10:6 ð8Þ
with factorkdg (effect of the maximum aggregate grain size dg) defined askdg=32/(16?dg)C0.75.
The angle of rotation of the slab w can be obtained experimentally or using some of the proposed theoretical expressions according to MC 2010. Application of a specific theoretical expression depends on the complexity of the concrete design case, so one may tell four levels of approximation: LoA I–LoA IV, with increasing of the exactness of determination of the rotation w. As LoA increases, so the calculated slab rotations generally decrease, leading to higher punching shear capacities.
6.1 LoA I
Level of Approximation I is suitable for predesign or initial sizing of structural elements, where a conservative calculation method is acceptable (Fe´de´ration Internationale du Be´ton (fib)2010). According to Siburg et al. (2014) LoA I approach can achieve a reliable estimate of the punching shear resistance by assuming complete utilisation of the flexural reinforcement over the column (mSd=mRd). Large crack widths and large slab rotations are presumed. For LoA I rotation of the slab is defined as:
w¼1:5rs fyd dEs
ð9Þ
whereEs is the Young’s modulus of the flexural
reinforce-ment, fyd the design value of tension yield stress of
rein-forcement, rs the distance between the column axis and
position where the radial bending moment is equal to zero and can be estimated as 0.22L (L=max. span of slab). For footings, the position where the radial bending moment becomes zero can be assumed to be at the edge of the footing if the flexural stiffness of the footing can be regarded as sufficiently large (Siburg et al.2014).
6.2 LoA II
In slabs where significant bending moment redistributions are considered for design of the bending reinforcement, the slab rotation can be calculated as:
w¼1:5rs fyd dEs
mSd mRd
1:5
ð10Þ
wheremsdis the average bending moment per unit length in
the support strip of the column, mRd the design average
flexural strength per unit length in the support strip. Bending moment inside the column strip can be estimated withmsd=VEd/8. The value forrscan be adopted as the one
for level I of approximation.
The rotation of a flat slab has to be calculated along two principal directions of the slab. The maximum rotation is governing for punching shear capacity. This equation also applies for slabs where the flexural reinforcement is increased in columns in order to increase their punching shear capacity.
6.3 LoA III
For LoA III slab rotation can be calculated from:
w¼1:2rs fyd dEs
mSd mRd
1:5
ð11Þ
rs is calculated for the flat slab using a linear elastic
(un-cracked) model.
msdis calculated from a linear elastic (uncracked) model,
as the average value of bending moment in the support strip.
6.4 LoA IV
The rotation w can be calculated on the basis of a non-linear analysis of the structure and with full account of cracking, tension-stiffening effects, yielding of the rein-forcement and any other non-linear actions relevant to pro-vide an accurate assessment of the structure. This method is very complex and limited to special cases.
In Table5is given calculation of shear capacity according tofibMC 2010 model for the same footings that were cal-culated according to Eurocode 2 in Table3, that is, for the footing rested on real ground, and tested until punching (from Table1).
Calculation is conducted for the first two levels of approximation, that is, for LoA I and LoA II (columns 9 and 11 respectively). Like in Table3, in these calculations, all material and strength reduction factors incorporated in thefib MC 2010 equations were taken as unity for the purpose of comparison with the test results (column 1).
Comparison of results obtained according to LoA I and LoA II and obtained by testing is given in the columns 10 and 12 respectively. Data from these columns indicate that approximation LoA II gives results which are much closer to the test results than approximation LoA I. This was expected because approximation LoA I is intended for predesign or initial sizing of structural elements.
From the columns 12 (Tables3, 4) one may notice that, generally speaking, results obtained byfibMC 2010 model
are better compared with the Eurocode 2, because almost all values of the ratio Vtest/VR-Lo2for fibMC 2010 model are more conservative, i.e., greater than 1.0.
One may also conclude that, according to the quality of prediction of the punching shear resistance, obtained results can be divided into two groups. Into the first group fall the footings with effective depths d lower than 150 mm (foot-ings from the series Bonic et al. and Rivkin) for whichfib MC 2010 model gives notably more conservative results regarding the Eurocode 2, because it significantly underes-timates the punching shear resistance of the tested footings. Into the second group fall the footings with effective depths dhigher than 150 mm (footings from the series Hegger et al. and Kumer, Shill, and Hoque) for whichfibMC 2010 gives better results compared to the Eurocode 2, i.e., values of the ratio Vtest/VR-Lo2 are greater than 1.0 or very close to 1.0. Considering that the effective depths of the practical column footings and foundation slabs are greater than 150 mm, one may conclude that fib MC 2010 model gives results more applicable in practice. This also indicates that Eurocode 2 gives more space for the improvement of the calculation procedure, so further work will be primarily related to the Eurocode 2.
7. Influence of the Footing Characteristics
on Its Punching Capacity
For the analysis of the influence of individual character-istics of the footing on its punching capacity, deflection of the footing as a function of applied load was considered. Thereat, the deflection of the footing represents difference between recorded settlement of the column stub and settling of the footing corner.
7.1 Influence of the Concrete Compressive Strength and Reinforcement Ratio
Influence of the concrete compressive strength and rein-forcement ratio is elaborated on two series of the tested footings. Thereat every series consisted of footings with same remained characteristics, besides the analysed one. The first series consisted of three footings with different concrete compressive strength (F2-fcm=30.37 MPa, F6-fcm=7.92 MPa, and F8-fcm=15.83 MPa), while the rest characteristics remained the same. The second series con-sisted of three footings with different reinforcement ratio (F7-ql=0.27%, F8-ql=0.48%, and F9-ql=0.91%),
while other characteristics remained the same. Qualitative influence of the considered characteristics of the footings on their behaviour under load is given in Fig.13.
compressive strength manifest significantly more ductile behaviour. Higher bending values were registered in the starting phases of loading At the footing F8 than at the footing F6, which may be result of different compactness of the soil of these footings.
From Fig.13b can be observed that influence of the reinforcement ratio on the registered punching capacity of the footing is not high (registered punching forces of the footings were F7—527 kN, F8—645 kN, and F9—720 kN) which is in concordance with previous investigations (Hallgren et al.1998; Menetrey 2002). Regarding the duc-tility, tested footings show relatively similar behaviour.
In order to determine quantitative influence of the concrete compressive strength and reinforcement ratio on the punching capacity of the footings, the influence of different dimensions of the footings is eliminated and the normalised punching shear resistance vn in the control perimeter is
calculated:
vn¼
Vtest1AA0
ud ð12Þ
For all footings rested on real soil, according to Table1, value vn is calculated, whereat the notation is kept from
previous expressions, and values forA0anduare taken from the calculation in the column 9, Table3. Dependences obtained vn(fck) and vn(ql) are presented as diagrams in
Fig.14a, b.
Regression analysis from Fig.14a shows that punching capacity is proportional to the concrete compressive strength
by exponent of 0.50. This corresponds to the conclusions of Hallgren (Hallgren et al. 1998), who states that punching capacity at slabs with lower shear slenderness, like, for example, footings, is proportional to the concrete compres-sive strength by the exponent of 0.76, while in the tests with thinner slabs, Braestrup and Gardner, according to Hallgren et al. (1998), showed that this influence is lower and that it amounts from 1/3 to 1/2. This corresponds to some other standards, for example SIA 262, which take into account this influence by exponent of 1/2. Regression analysis from Fig.14b shows that punching capacity is proportional to the reinforcement ratio by exponent of 0.23, which also corre-spond to the earlier investigations of Hallgren et al. (1998). Based on this, one may state that Eurocode 2, which in the expression (1) takes the influence of both parameter with exponent 1/3, underestimates the influence of the concrete compressive strength, while at the same time it overestimates the influence of the reinforcement ratio.
Finally, in Fig.15is presented the influence of these two parameters on the ratioVtest=VEC2for the footings rested on real soil. From the figures one may conclude that Eurocode 2 reflects the influence of these parameters for their usual practical values, in a satisfactorily way, regarding conser-vativeness of the relationVtest=VEC2:
7.2 Influence of the of the Effective Depth and Shear Slenderness of the Footing
Influence of the shear slenderness of the footing is con-sidered on a series of three footings with different shear slenderness (F3—a/d=3.34, F4—a/d=2.25, F5—a/
Fig. 14 Dependence of the punching resistancevnof the:aconcrete compressive strength (fck);breinforcement ratio (ql).
d=2.7—according to the column 4 in Table3), while the other characteristics were almost the same. Qualitative influence of this parameter on behaviour of the cited footings under load is presented in Fig.16.
From Fig.16one may see that shear slenderness does not affect significantly on punching capacity, but it affects very much on ductile behaviour of the footing. So the footing F3 shows prominently ductile, and the footing F4 prominently stiff behaviour.
Having in mind that Eurocode 2 model limits the size effect factork(k¼1þ ffiffiffiffiffiffi200
d
q
2:0), it can be concluded that this standard relates before all to slabs and footings whose effective depth is d200 mm: However, the data given through the diagram in Fig.17 reveal different results. Namely, from Fig.17a and b one may conclude that Euro-code 2 model does not reflect in a satisfactorily way the influence of the footing depthdand shear slendernessa/din the range of compact footings (higher section depth, i.e., Fig. 16 Dependence of the punching capacity on the shear slenderness.
Fig. 17 Comparison of the results of the punching tests and punching capacity according to Eurocode 2 regarding:aeffective depth (d);bshear slenderness of the footing (a/d).
lower shear slenderness), regarding conservativeness of the relationVtest=VEC2:
7.3 Settlement of the Footings and the Mechanism of Their Punching
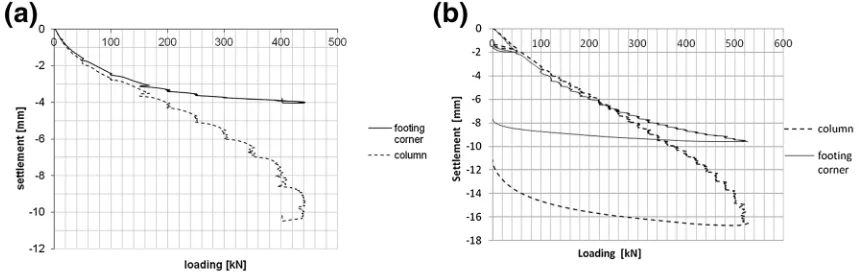
During the experimental examination, settlements of the column and footing corner were measured, completely according to Figs.6and 7. As expected, the settlements of the points on the footing corners and on the column stub were approximately uniform at the initial phase of loading, and then the settlements under the column stub grew faster (Davidovic´ et al. 2010). Typical measured settlements for these two points are given in Fig.18, for the footings F6 and F9.
For the footing F6 maximal settlement was recorded at the punching force of 440 kN, on the column stub, and it amounted 10.0 mm, and settlement of the footing corner was 4.0 mm. In the footing F9 maximal settlement of the footing was recorded at the punching force of 720 kN, on the col-umn stub, and amounted 24.0 mm, and settlement of the footing corner was 5.0 mm. According to Fig.18, settlement of the footing can be divided into four phases. In the first phase, settlements of the column and of the footing corner grow approximately equally. In this phase the footing acts as a stiff one, there are almost no cracks and no deflection of the footing. Further on, in the second phase (from approxi-mately 150 kN for footings F6 and F9), one may notice stagnation of the settlement of the footing corner, while the settlement of the column stub continues to grow faster with the increase of the applied force, which leads to the deflec-tion of the footing. The footing deflecdeflec-tion and crack devel-opment (Vacev et al. 2015) continues until the load value reaches 300 kN in footing F6, and approximately 600 kN in footing F9. In the third phase the settlement of the footing corner rests, while the settlement of the column progresses more intensely as the load level increases. This phase con-tinues until the load value reaches 400 kN in footing F6 and 700 kN in footing F9. At those load levels the fourth phase starts, and also the last stage of punching, when the settle-ment of the column grows very fast, the cracks and crush-ings are spread through the whole footing volume, and the final punching occurs (Vacev et al.2015).
7.4 Strains in Concrete and in Reinforcement Steel
During the testing of footings the strains in concrete and in reinforcing steel were measured, completely according to Figs.6 and7. Strain distribution in concrete and reinforce-ment of footings was according to expectations: maximum compressive strains occur on the top side of the footings in the zone next to the column, and maximum tensile strains occur on the bottom side of the footings in the zone beneath the column. Typical measured strains in concrete and rein-forcement steel is given for the footings F6 and F9 in Figs.19and20.
From Fig.19 one may notice that expectedly maximal deformations in reinforcement are reached immediately near the column, or in the column axis. Reinforcement defor-mations reached the yield point, or values near the yield point (reinforcement yield point for the footing F6 is e%2.7%-2700 microstrains, and for the footing F9 is e%2.25%-2250 microstrains). One may observe that reaching of the high values in the reinforcement practically means punching of the footing.
Maximal contractions in the concrete are expectedly recorded in the strain gages immediately near the column. From Fig.20 one may notice that in the concrete of both footings first appear compressive deformations which later decrease and turn into tension.
Both the reinforcement and concrete deformations devel-opment can be divided into four phases, as is the case for the footing settlement. In the first phase deformations grow in both materials. After that, the second phase starts (from approximately 150 to 200 kN in footings F6 and F9) in which reinforcement deformations start to grow faster with load increase, and along with that compressive concrete deformations begin to stagnate, and after that to turn into tension. In the third phase (from approximately 250 kN in footing F6 and 600 kN in footing F9) reinforcement defor-mations grow even faster and approach the yield point, while concrete deformations decrease and turn to compression. In the fourth phase (from 400 kN in footing F6 and 700 kN in footing F9) footing punching occurs. Reinforcement defor-mations are high and may be far above the yield point, while concrete deformations decrease and may turn again into
pressure (see Fig.20). Footings F6 and F9 have the same height but they differ considerably regarding their concrete compressive strength and reinforcement (Table2), which causes more ductile behaviour of the footing F6, which may be noticed from Fig.19.
7.5 Mechanism of Footing Punching
From Figs.18, 19, and 20 one may notice that the mechanism of footing punching is developing in four phases like the settlement of the footing and developing of the deformations in reinforcement and concrete and that those phases are practically coincident on the mentioned figures.
In the first phase the footing acts as a stiff body, settle-ments of the column stub and footing corner grow approx-imately equally and there is no significant bending of the footing. In the second phase of loading, due to the consid-erable reinforcement deformations achieved, much faster settlements occur under the column compared with the soil under the footing corner (footing bending) and along with that decrease of the compressive deformations on the upper part of the footing near the column. In the third phase high reinforcement deformations occur, and they are near or at he yield point causing further decrease of the compressive deformations, and then emerging of tensile concrete
deformations. Then the column begins to ‘‘dive’’ into the footing, producing a crack at the joint of the column and the footing. Fourth and the last stage of punching is character-ized by even faster increase of the reinforcement tension strains—practically its yielding, and with decrease of the strains in the footing concrete next to the column. At the end of this stage the reinforcement strains and the settlement of the column rise very fast in the column zone, and punching cracks reach the column, thus encompassing completely the punching body, and finally it leads to its separation from the body of the footing.
7.6 Influence of the Distribution of the Soil Pressures
The punching capacity of the footing is, among other things, conditioned by of distribution of the soil pressures under the footing. Number of previous investigations reg-ister occurrence of the concentration of contact pressures under the centre of gravity of the loaded surface (in case of soil without cohesion). Thus, by citations of Olson and Lai (1989/2003), Cummings (1936) summarizes previous experimental research of vertical normal stresses in sand, which was earlier published by Steiner-Kick (1879), Strohschneider (1909), Goldbeck (1917), Enger (1920, Fig. 20 Registered strains in the concrete of the footing F9 (1, 2, 3-measuring spots—Fig.8).
1929), Ko¨gler and Schedig (1927, 1929), and Faber (1933). All mentioned researchers registered concentration of con-tact pressures on the sand ground under applied concentrated force.
For the expected convex distribution of the soil pressures, the soil reaction within the control perimeter is greater than for the uniform distribution, which gives as a consequence footings with higher capacity. Those were the reasons why, during the experiment for different stiffnesses of the footing-ground system, the redistribution of the contact pressures was tracked depending of the increase of the load level. In Fig.21are given recorded contact pressures for the footings F6 and F9, as they are typical footings.
In the case of the footing F9 can be observed that the pressures in the beginning grow approximately uniformly as the load rises, and after that pressure concentration under the column occurs (soil pressure cell 1), and then the pressure concentration gradually spreads to the soil pressure cell 2. So, at the moment of punching of the footing the pressures under the column (soil pressure cell 1) were 1200 kN/m2, while in the soil pressure cell 2 were under 800 kN/m2. The reason for such behaviour one should look in the fact that with the load increase a gradual decrease of the footing stiffness occurs, before all because of the cracking of the concrete cover, and then because of the shear crack propa-gation towards the footing column and increase of the plastic deformations in the reinforcement and in the concrete. It means that with gradual separation of the punching body from the footing, the load is more and more transferred onto the soil through the base of this body. This is even more observable in the case of the footing F6, where due to the very low compressive concrete strength (fck=7.92 MPa),
the cracking of the concrete and forming of the punching body occurs earlier. During the loading process and after the punching failure the ground pressure under the punching cone body was almost uniform.
As quoted earlier, for the assessment of the punching capacity, Eurocode 2 suggests reduction of the punching force for the amount of the reactive pressure of the soil within the control perimeter, whereat a uniform distribution of the contact pressures is assumed. However, as one may see from Fig.21, distribution of the contact pressure for footings subjected to loading under axis-symmetric condi-tions in most cases is not uniform and depends on the stiffness of the footing and on the load intensity.
One may say that the basic reason for considerably higher values of the punching forces during experimental exami-nation regarding the Eurocode 2 lies just in the fact that at all the footings concentrations of the contact pressures were recorded in the area under the column, that is, under the punching body. This is one of the basic differences com-pared to the previous investigations of Hegger (Hegger et al. 2006, 2007, 2009). Concentration of the contact pressures under the footings examined here is significantly higher, and that is primarily due to the smaller footing depth, and con-sequently to their lower stiffness. Different stiffness of tested footings, compared to the previously tested footings can be seen from Table5. Thus with the increase of the force in the
column, a redistribution of the contact pressure and its concentration under the footing centre occurs, so at the failure load of the footing maximal contact pressure is far higher than the average pressure under the footing.
Significant concentration of the contact pressures under the punching body that occurred with the increase of the applied load was the reason for higher punching forces achieved in our investigations regarding the previous experiments. Consequently we obtained greater ratios of Vtest/VEC2. Reason for the ratios Vtest/VEC2[1 at slender footings, according to Belletti et al. (2015b), also could be the compressive membrane action effect.
7.7 Influence of the Stiffness of the Footing-Soil System
Distribution of the contact pressures under the footing may be also observed as a function of stiffness of the system consisted of the footing and the soil under it, which is expressed through the coefficient of stiffnessks:
ks¼
EcIfooting EsL3B
ð13Þ
whereEcis the modulus of elasticity of the concrete of the
footing (according to fib MC 2010), Es the modulus of
elasticity of the soil under the footing,Ifootingthe moment of
inertia of the cross section of the footing, L,B the length, width of the footing.
For the footings from Table1, which were rested on the soil, and with parameters necessary for the calculation ofks
cited in the literature, the following values of the stiffness footing-soil system were calculated. The obtained values are presented in Table5.
For the calculated values ks from Table5, and values of
the ratio Vtest/VRd,c from the column 12 of Table3, a dia-gram of dependence of those values was made for the quoted footings, and it is presented in Fig.22.
Although the sample of the examined footings was small, one may see from Fig.22 that for values of ks lower
than&0.5, the footings behave as flexible structural ele-ments under which a concentration of contact pressures occurs, and because of that, an increase of the punching capacity regarding the predictions that gives Eurocode 2 is Fig. 22 Comparison of results of the punching tests and
Table 5 Values ofksfor the examined footings.
Author Footing ks
Bonic et al. F2 0.22
F3 0.17
F4 0.57
F5 0.30
F6 0.30
F7 0.23
F8 0.21
F9 0.24
Hegger et al.a DF1 0.56
DF2 0.32
DF4 0.70
DF5 0.83
a
For the remained footings examined by Heggerkswas not calculated because there were no data about the modulus of elasticity of the soil
under the footingEs.
Table 6 Punching forces according to Eurocode 2 model and according to the proposed solution.
Label Vtest(kN)
(Belletti et al.
2015b)
d (cm) (Belletti et al.
2015a)
VRd,c-ECP (kN)
(Bonic´ et al.2010)
Vtest/VRd,c
(Bonic´2011)
VRd,c-prop. (kN)
(Bowles2001)
Vtest/VRd,c-prop.
(Brooms2005)
Bonic et al.
F2 1050 12.5 400 2.63 482 2.18
F3 430 10 210 2.05 257 1.67
F4 656 15 476 1.83 475 1.38
F5 451 12.5 318 1.42 342 1.32
F6 440 12.5 256 1.72 247 1.78
F7 527 12.5 270 1.95 316 1.67
F8 645 12.5 328 1.97 364 1.77
F9 720 12.5 405 1.78 427 1.69
Hegger et al.
DF1 551 15 647 0.85 571 0.96
DF2 530 15 666 0.80 596 0.89
DF4 1251 25 1410 0.89 1181 1.06
DF5 1130 25 1475 0.77 1153 0.98
DF6 2836 39.5 3282 0.86 2255 1.26
DF7 2569 39.5 3090 0.83 2157 1.19
DF8 1203 25 1549 0.78 1242 0.98
DF10 1638 25 1867 0.88 1629 1.0
Rivkin
21F 180 9.5 158 1.14 206 0.87
Kumer Shill and Hoque
present. These conclusions primarily relate to foundation slabs and footings of higher shear slenderness.
8. Proposed Method of Calculation
Bearing in mind the quoted differences in results given by the expression (1) comparing to the experimentally obtained results, a modification of the punching capacity expression is proposed:
vRd;c¼CRd;ck ðfckÞ1=2 ð100qtÞ 1=4 2d
aEC2
ð14Þ
where k¼ ffiffiffiffiffiffi200 d
q
;CRd;c¼0:18=cc and the rest of notation and method of calculation is the same as in expression (1). Thereat for the governing control perimeter (aEC2 in expression (14)), one should take the section according to the diagram given by ECP (2008), that is, by Fig.10b). According to the expression (14), the calculation procedure for the footings from Table3was repeated, and the obtained results, as well as the results given by the current Eurocode 2 model are presented in Table6. Thus, columns 11 and 12 from Table3 are now columns 3 and 4 in Table6. Com-paring the results from the current Eurocode 2 model and the proposed method (columns 4 and 6 from Table5) one may see that the proposed solution gives results which are closer to the experimental ones.
Based on the results from Table5, the diagrams Vtest/VRd, as a dependence of the effective depth d and of the shear slenderness a/d were obtained, see Fig.23. One may observe that the diagrams obtained by expression (14) better reflect the influence of the footing depth and shear slender-ness compared to the current Eurocode 2, whose results are presented in Fig.17a, b.
The proposed calculation procedure is aimed to the har-monization of the quantification of the influence of the applied concrete compressive strength and reinforcement ratio in the expression for the punching capacity given in Eurocode 2 with the results of experimental investigations of footings conducted in this research, as well as with the results of previous investigations.
Like the Eurocode 2, the proposed procedure assumes uniformly distributed stresses in the subgrade soil.
Considering the registered unevenness of the contact pres-sures under the footing (Fig.21) it is necessary to investigate the possibility of including of this phenomenon into the calculation procedure for footing punching.
Also, for the complete acceptation of the proposed cal-culation procedure is certainly necessary to conduct addi-tional experimental investigations so that it could be confirmed on greater number of samples. Besides that, more experimental data would provide more reliable data for the realized statistical analyses and conclusions drawn. Also, it is necessary that the examined footings have higher effective depth in order to better reflect the footings in daily engi-neering practice.
9. Conclusions
Experimental investigations conducted on footings rested on real ground, performed numerical calculations, as well as results of other researchers, set the ground for the following conclusions:
– Recommendations based on ECP (Dieterle and Rosta´sy 1987) give almost the same results as the calculation that determines the minimal punching force within the area bounded by basic control perimeter, so using of those diagrams may be recommended instead of control in several perimeters in calculations of column footings punching resistance.
– Results of the calculations of punching on tested footings indicate that fib MC2010 model gives results that are very close to the experimental ones. This code gives more conservative results regarding the Eurocode 2, which above all relates to the footings with higher effective depths.
– The performed regressive analysis for the footings rested on real soil shows that punching capacity of the footings is more influenced by the compressive concrete strength than by the reinforcement ratio, although Eurocode 2 takes them into account equally.
– There was recorded a significant concentration of the contact pressures under the punching body of the footing with the increase of the applied load. This was the reason for higher punching forces achieved regarding the Fig. 23 Comparison of results of punching tests according to the proposed method of assessment regarding:afooting depthd;
previous experiments and greater ratios Vtest=VEC2: Concentration of contact pressure is primarily the consequence of the stiffnesses coefficientks. It primarily
relates to foundation slabs and to footings of higher shear slenderness.
– For the final acceptation of the proposed calculation procedure is certainly necessary to conduct additional experimental investigations so that it could be confirmed on greater number of samples. Besides that, more experimental data would provide more reliable data for the realized statistical analyses and conclusions drawn. – Future testing of footings with higher effective depth
would certainly supplement the results of this research and contribute to its application in daily engineering practice.
Acknowledgements
This study was funded by Ministry of Science and Technological Research of Republic of Serbia (Grant No. TR 36028 and TR 36016). The authors thank to Prof. Hegger and his team from RWTH AACHEN UNIVERSITY on the database of tested footings.
Compliance with ethical standards
Conflict of interest
The authors declare that they have no conflict of interest.
Open Access
This article is distributed under the terms of the Creative Commons Attribution 4.0 International License (http:// creativecommons.org/licenses/by/4.0/), which permits unre stricted use, distribution, and reproduction in any medium, provided you give appropriate credit to the original author(s) and the source, provide a link to the Creative Commons license, and indicate if changes were made.
References
Belletti, B., Pimentel, M., Scolari, M., & Walraven, J. C. (2015a). Safety assessment of punching shear failure according to level of approximation approach. Structural Concrete, 16(3), 366–380.
Belletti, B., Walraven, J. C., & Trapani, F. (2015b). Evaluation of compressive membrane action effects on punching shear resistance of reinforced concrete slabs. Engineering Struc-tures, 95(7), 25–39.
Bonic´, Z. (2011).A contribution to the failure calculation the-ory by punching shear of column footings resting on deformable subgrade soil. Ph.D. Thesis, Faculty of Civil
Engineering and Architecture, Nisˇ, Serbia, 182 (in Serbian)
Bonic´, Z., Vacev, T., Prolovic´, V., Mijalkovic´, M., & Dancˇevic´, P. (2010). Mathematical modeling of materially nonlinear problems in structural analyses (part II—application in contemporary software). Facta Universitatis, Series: Architecture and Civil Engineering, University of Nisˇ, 8(2), 201–210.
Bowles, E. J. (2001). Foundation analysis and design. New York: McGraw-Hill Companies.
Brooms, C. E. (2005).Concrete flat slabs and footings-design method for punching and detailing for ductility. Doctoral Thesis, Royal Institute of Technology, Stockholm, Sweden. Davidovic´, N., Bonic´, Z., Prolovic´, V., Mladenovic´, B., & Stojic´, D. (2010). A comparative theoretical-experimental analysis of settlements of shallow foundations on granular soil. Facta Universitatis, Series: Architecture and Civil Engineering, University of Nisˇ, 8(2), 135–143.
Dieterle, H., & Rosta´sy, F. (1987).Tragverhalten quadratischer Einzelfundamente aus Stahlbeton (V. 387). Berlin: Deut-scher Ausschuss fu¨r Stahlbeton.
Dieterle, H., & Steinle, A. (1981).Blockfundamente fu¨r Stahl-betonfertigteilstu¨tzen, Deutscher Ausschuß fu¨r Stahlbeton, Hefte 326. Berlin: Beuth Verlag.
Eurocode 2—Commentary. (2008). European Concrete Plat-form ASBL, Brussels.
EN 1992-1-1. (2004). Eurocode 2: Design of concrete struc-tures, Part 1.1: General rules and rules for buildings. Brussels: European Committee for Standardization. Fe´de´ration Internationale du Be´ton (fib). (2010). Shear and
punching shear in RC and FRC elements. fib Bulletin 57. Hallgren, M., & Bjerke, M. (2002). Non-linear finite element
analyses of punching shear failure of column footings. Cement & Concrete Composites, 24,491–496.
Hallgren, M., Kinnunen, S., & Nylander, B. (1998). Punching shear tests on column footings.Nordic Concrete Research, 21(1), 1–24.
Halvonik, J., Hanzel, J., & Majtanova, L. (2016). Punching resistance of spread footings. International Journal of Interdisciplinarity in Theory and Practice (ITPB), 11, 64–70.
Hegger, J., Ricker, M., & Sherif, A. G. (2009). Punching strength of reinforced concrete footings. ACI Structural Journal, 106(5), 706–716.
Hegger, J., Ricker, M., Ulke, B., & Ziegler, M. (2007). Inves-tigations on the punching behavior of reinforced concrete footings.Engineering Structures, 29,2233–2241.
Hegger, J., Sherif, A. G., & Ricker, M. (2006). Experimental investigations on punching behavior of reinforced concrete footings.ACI Structural Journal, 103(4), 604–613. Husain, M., Eisa, A. S., & Roshdy, R. (2017). Alternatives to
enhance flat slab ductility. International Journal of Con-crete Structures and Materials, 11(1), 169.
Kee, S. H., & Nam, B. (2015). Automated surface wave mea-surements for evaluating the depth of surface-breaking cracks in concrete. International Journal of Concrete Structures and Materials, 9(3), 307–321.
Kumer, S. K., & Hoque, M. (2015). Punching shear behavior of RC column footing on stabilized ground. International Journal of Engineering Technology, Management and Applied Sciences, 3,246–253.
Menetrey, P. (2002). Synthesis of punching failure in reinforced concrete.Cement & Concrete Composites, 24,497–507. Muttoni, A. (2008). Punching shear strength of reinforced
concrete slabs without transverse reinforcement. ACI Structural Journal, 105(4), 440–450.
Muttoni, A., & Ferna´ndez, Ruiz M. (2008). Shear strength of members without transverse reinforcement as function of critical shear crack width. ACI Structural Journal, 105(2), 163–172.
Muttoni, A., & Ferna´ndez, Ruiz M. (2012). The levels of approximation approach in MC 2010: Applications to punching shear provisions. Structural Concrete, Ernst & Sohn, Germany, 13(1), 32–41.
Muttoni, A., & Schwartz, J. (1991). Behaviour of beams and punching in slabs without shear reinforcement (Vol. 62, pp. 703–708). Zurich: IABSE Colloquium.
Olson, R. E. (1989/2003). Stress distribution. InAdvanced soil mechanics. Taichung: Chaoyang University of Technology. Pbdrby, C. A. (1967). Pacxen ayylaveynod. Rbed: Bpl
a-nekmcndo<ylidekmybr.
Siburg, C., & Hegger, J. (2014). Experimental investigations on punching behaviour of reinforced concrete footings with
structural dimensions. Structural Concrete, 15(3), 331–339.
Siburg, C., Ricker, M., & Hegger, J. (2014). Punching shear design of footings: Critical review of different code pro-visions.Structural Concrete, 15(4), 497–508.
Simo˜es, J. T., Bujnak, J., Ferna´ndez Ruiz, M., & Muttoni, A. (2016). Punching shear tests on compact footings with uniform soil pressure. Structural Concrete, 4(Suisse), 603–617.
Simo˜es, J. T., Ferna´ndez Ruiz, M., & Muttoni, A. (2016). Punching shear strength and behaviour of compact rein-forced concrete footings. In 11th fib international PhD symposium in civil engineering (pp. 649–656), Tokyo, Japan.
Talbot, A. N. (1913). Reinforced concrete wall footings and columns under concentrated loads. Research and Devel-opment Bulletin D47, Illinois.
Timm, M. (2003).Durchstanzen von Bodenplatten unter rota-tionssymmetrischer Belastung. Ph.D. Thesis, Institut fu¨r Baustoffe, Massivbau und Brandschutz, Technical Univer-sity of Brunswick, Brunswick, Germany.
Urban, T., Goldyn, M., Krakowski, J., & Krawczyk, L. (2013). Experimental investigation on punching behavior of thick reinforced concrete slabs. Archives of Civil Engineering, 59(2), 157–174.