RESEARCH ARTICLE
Enhanced frequency analysis on a vibrated
tumor with a compression cylinder
Satoshi Miura
1*, Hidekazu Ishiuchi
1, Yuta Shintaku
1, Victor Parque
1, Ayako Torisaka
2and Tomoyuki Miyashita
1Abstract
Breast cancer diagnosis has been mostly accomplished through imaging. These methods have great advantages in being able to detect the presence and location of breast cancer. However, it is difficult to distinguish between a benign and malignant tumor located in a deep position because both tumor types look similar. In this paper, tissue including the tumor from skin was vibrated using a compression cylinder, to analyze the frequency difference for dis‑ tinguishing tissue type. Before distinguishing between a benign and malignant tumor, it is necessary to validate that the difference between normal tissue and tumor can be distinguished. The objective of the study is to validate the feasibility to emphasize the frequency differences in a 10.0 mm or greater deep tumors during vibration by pushing a cylinder towards the deep tumor. A phantom model and finite element analysis model were constructed to simulate the breast. In the experiment, air was injected into the phantom and the displacement was measured. The frequency response for distinction of tissue types was analyzed and it was found that the displacement difference rate was over 50% at a frequency of 130 Hz when the cylinder was pushed into the sample as opposed to when not pushed in. Changes in displacement were measured according to the distance between the tumor and vibration point using finite element analysis. When the measurement and vibration points were on the center of the tumor, the difference in the resonance point was at its largest (5.5 Hz). Results show that the position of a tumor could be easily and rapidly detected by vibrations from a cylinder pushed into the diagnostic site.
Keywords: Vibration analysis, Breast cancer diagnosis, Resonance frequency analysis
© The Author(s) 2019. This article is distributed under the terms of the Creative Commons Attribution 4.0 International License (http://creat iveco mmons .org/licen ses/by/4.0/), which permits unrestricted use, distribution, and reproduction in any medium, provided you give appropriate credit to the original author(s) and the source, provide a link to the Creative Commons license, and indicate if changes were made.
Background
The occurrence of cancer is increasing every year and it continues to be a leading cause of death [1]. More than 1,300,000 women are diagnosed with breast cancer worldwide each year. There are many tumor types [2] such as Ductal carcinoma in situ [3], Invasive micropap-illary carcinoma [4], Invasive lobular carcinoma [5] and mucinous Carcinoma [6], apart from the degree of pro-gression. The simplest tumor discrimination are two type as following [5]. One is a benign tumor that does not transfer to other organs, so it is typically not necessary to operate. The other is a malignant tumor that transfers to and destroys other organs. A malignant organ attacks other normal organs by infiltrating it, so early operation
is necessary. Therefore, the early diagnosis of cancer remains vitally important for a good prognosis and posi-tive treatment outcomes. However, tumor classification method is not established because it’s difficult to distin-guish between benign and malignant [7].
Related works
Screening technologies have been developed in a vari-ety of methods. Tumor detection usually involves imag-ing diagnosis methods such as scatter X-ray imagimag-ing [8], mammography [9], ultrasound [10], and magnetic reso-nance imaging (MRI) [11]. In an experimental approach, acoustic signals have also been used to localize the posi-tion of tumors [12]. Other studies have investigated the viscoelastic characterization of normal and tumor tis-sue [13]. These technologies have great advantages of being able to detect the presence and location of cancers. However, it is difficult to distinguish between a benign and malignant tumor [14–16], as they can look similar.
Open Access
*Correspondence: [email protected]
1 Department of Modern Mechanical Engineering, Waseda University,
3‑4‑1 Okubo, Shinjuku, Tokyo 169‑8555, Japan
Therefore, it is challenging for a surgeon to distinguish cancer types through the use of imaging technologies alone.
Viscoelasticity is the difference between a benign and malignant tumor. When the tissue greatly deforms, a malignant tumor becomes harder than a benign one. Using these differences, Wang et al. [14] studied the difference deformation in tumor deformation when compressing the skin to distinguish tumor types using elastography and mammography [15]. Umut proposed a quantification method for percussion [16], vibrating the livers of animals with an impulse hammer to compare tissue properties according to their frequency responses. Kashif [17] analyzed the vibrated breast images to detect changes in stiffness. They reported that with respect to frequency, elastic moduli (storage elastic modulus, loss modulus) had different mechanical properties between normal and diseased tissues. Yamakawa and Shiina [18] also evaluated tissue viscoelasticity using vibration. The vibration method is similar to the ultrasonography in terms of the principle. Although ultrasonography used around 3 MHz, the vibration is 1.7 Hz. The lower fre-quency vibration is easier to happen the resonance phe-nomena with the breast in the tissues scale, not particle scale. However, there are few studies that distinguish a 10.0 mm or greater deep tumor in tissue from surface because it is too deep for deformation and vibration on the tissue surface to show differences in tumor types. Generally, although most researches discuss about the surface position of the breast cancer [19], the breast can-cer depth is important because the breast cancan-cer often come around the Mammary gland [20, 21]. Since mam-mary grand is deeply located in the breast, it’s impor-tant to distinguish the type of the breast cancer located deeply.
A study on needle insertion revealed a similar prob-lem with the tumor moving in the tissue. To capture the movement of the deep tumor, Kobayashi et al. [22] made it difficult to move tumors by inserting another probe. They inserted the needle from the skin after pushing with another probe to make it difficult for the tumor to move within the tissue. Because the tumor may become harder based on loading, they anchored the tumor to make it easier to insert by push another probe in advance. They called the approach the “Preloading Method” and obtained an accurate insertion. Although this method of pushing another probe has been used in the field of nee-dle insertion, it has not been used to distinguish tumor types.
Objective
This paper presents a novel method to emphasize the fre-quency differences in a 10.0 mm or greater deep tumors
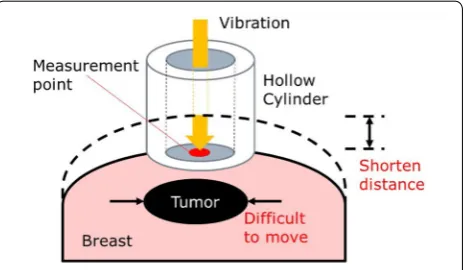
during vibration by pushing a cylinder towards the deep tumor, as shown in Fig. 1. The hollow cylinder has two advantages like as Fig. 1. One is shortening the distance to the tumor from skin. The other is that the tumor moves difficulty since the tissue is harder when pushed. Therefore, the difference in frequency increases enough to show the skin. The proposed technology is expected to use a simple discrimination method between benign or malignant after the tumor size and depth were detected by other method such as ultrasound, X-ray, and MRI. On the assumption that the tumor size and depth were known, we analyze the tumor type using vibration.
Before distinguishing between benign and malignant tumors, it is necessary to validate that we can distinguish between normal tissue and tumors using the proposed method. In this paper, we validate the feasibility of vibra-tion analysis with a compression cylinder method, to dis-tinguish between normal site and tumors by measuring the differences in resonance points. In the experiment, we measure the displacement of two breast phantoms, with and without a simulated tumor vibrating with an air-injector. This can distinguish normal tissue from the simulated tumor using frequency analysis. We compare displacement changes with and without a compression cylinder to analyze the differences in frequencies at peak compliance. Using finite element analysis, we construct a simulated breast model to study displacement changes as a position relationship between the tumor and the load-ing point. Finally, we investigate the idea that the closer the load point is to the tumor, the greater displacement difference will be.
Materials Breast model
For simulating the viscoelastic test of human breast, the phantom is generally used in medical fields [23–26]. Thus, we constructed test pieces made out of phantom material to simulate the viscoelasticity of breast tissue
and cancer. Although there are some standard phantom models including tumor by some phantom manufactur-ers, it’s difficult to analyze the model using finite ele-ment analysis. To validate the feasibility of the vibration response analysis method as a pilot study, the cubic shape phantom was made because the simple shape is easier to analyzed than complex breast shape.
Some reported that the elastic modulus of breast tumor is three times higher than that of normal tissue [27, 28]. The elastic modulus of normal tissue was 7.5–14.3[kPa], that of the tumor was 11.3–46.0 [kPa]. Based on these values, we adjusted the composition ratio of the silicone rubber so that the longitudinal elastic modulus of the tumor was three times that of the normal tissue. We used this experiment to validate the nonlinearity of the phan-tom containing a simulated tumor.
We made the phantom model using silicone rubber (KE-1603A, KE-1603B, ShinEtsu Co., Gunma, Japan) and silicone oil (KF-96-50cs, ShinEtsu). We adjusted the com-position ratio of the silicone rubber according to:
where Mo[g], MA[g], and MB[g] are the masses of
sili-cone oil and silisili-cone rubbers KE-1603A and KE-1603B, respectively. We constructed the test piece using an acrylic mold. The test piece had a cylindrical shape with a thickness of 5 mm and a diameter of 20 mm.
The normal tissue for the phantom was made using sili-cone rubber with a mixing ratio of silicon oil 240%, while the simulated tumor tissue was made with silicone rubber with a mixing ratio of silicon oil 150%. For the shape, we constructed the tumor as a sphere and the normal tissue as a rectangular parallelepiped by an acrylic model. To prepare the phantom with a simulated “tumor,” a portion containing no “tumor” was constructed up to a height of 20 mm. After curing the portion, spheres of the pre-pared simulated tumor tissues and the remaining normal tissue were added to the mold. Phantoms with and with-out simulated tumors are shown in Fig. 2. The distance
(1)
Mixing ratio of silicone oil[% ]= M0[g]
MA[g]+MB[g]
from the surface to tumor is 11 mm. A simulated tumor was colored with the colorant KE-COLOR-BR, with the proportion of colorant set at 1% so as not to affect the physical properties of the material. The tumor diameter was 14.0 mm because the tumor size less than 20.0 mm is early breast cancer [19].
Finite element analysis
We constructed a simulated breast model to analyze the frequency response for distinction of the simulated tis-sue types such as normal tistis-sue or tumor. We performed analyses on two issues; the first was the validation of the difference in mechanical compliance by pushing the cylinder into the phantom. The other was to investigate changes in displacement and compliance according to the distance between the tumor and vibration point.
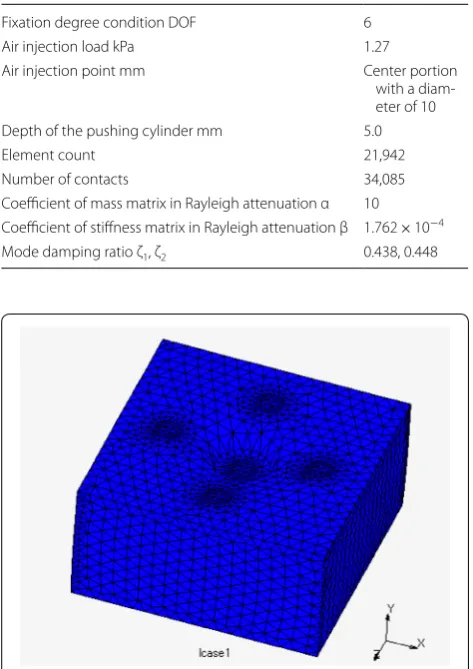
The model used for the analysis was the same size as the phantom. The analysis conditions are shown in Table 1. We fixed the model with 6 degrees of freedom at the bottom. Figure 3 shows the finite element model.
Fig. 2 Dimensions of the phantoms without (left) and with a tumor
Table 1 Analysis conditions of the phantom
Fixation degree condition DOF 6
Air injection load kPa 1.27
Air injection point mm Center portion
with a diam‑ eter of 10
Depth of the pushing cylinder mm 5.0
Element count 21,942
Number of contacts 34,085
Coefficient of mass matrix in Rayleigh attenuation α 10 Coefficient of stiffness matrix in Rayleigh attenuation β 1.762 × 10⁻⁴
Mode damping ratio ζ1, ζ2 0.438, 0.448
When performing the harmonic response analysis while pushing the cylinder, we defined the preload in static analysis before the dynamic analysis. We developed the mesh in Patran software (MSC Software Co., Tokyo, Japan). A phantom containing a tumor was created as a contact body by sharing nodes. We calculated the coeffi-cient of the Rayleigh attenuation and the mode-damping ratio from the experimental results.
Methods
Air‑compressor experiment
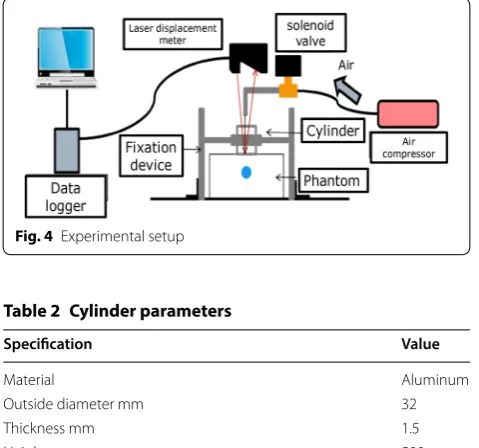
Figure 4 shows the experimental setup. In the experi-ment, we used air injection to vibrate the phantom, because the air injection is safer than hammering for vibrating the human body. We measured the displace-ment of the phantom during vibration to test for differ-ences in compliance between an only normal tissue and a including simulated tumor. Air injection via an SR-045 compressor (Fujiwara Inc., Japan) was used to vibrate the phantom. The air compressor was controlled by an microcomputer and a solenoid valve allowing injection of air for just 10 ms. The injection port diameter was 5 mm. The injection position was 95 mm above the phantom. The air injection load was 1.27 kPa. We measured the dis-placement using the sensor head (LK-G405, KEYENCE, Osaka, Japan) and controller unit (LK-G3000, KEYENCE, Osaka, Japan). The range of LK-G405 is 70–100 mm at sampling time 20 μs. The space resolution is 0.01 μm. The cylinder was fixed by the fixation device and used to push the phantom. The cylinder’s specification is shown in Table 2.
We had the solenoid valve inject air for 10 ms while the laser displacement sensor measured the displacement of the phantom surface. The time-displacement data were Fourier-transformed, and we then divided the displace-ment component by the force component to calculate the frequency response. We performed the experiment under the following four conditions:
(1) Not including the simulated tumor, no cylinder. (2) Including the simulated tumor, no cylinder. (3) Not including the simulated tumor, with cylinder. (4) Including the simulated tumor, with cylinder.
We compared the compliance under these conditions, repeating the experiment 3 times for each condition. We calculated the averaged value of the results of 3 times trials in each graph. When the cylinder was used, we pushed it 5 mm into the phantom.
Finite element analysis experiment
Using finite element analysis, we carried out two experi-ments. One validated the vibration analysis with the pushing cylinder method using a simulation. We com-pare the resonance frequency with and without a pushed cylinder. The air injection load and the pushing cylinder depth into the model were the same as the real experi-ment. The second experiment analyzes the relationship between the load point and tumor position. We ana-lyzed the displacement changes in respect to the load point changes. We analyzed the frequency peak to study the change of the frequency according to the relative load point position from the tumor shown in Fig. 5 and Table 3.
Results
Air compressor experimental results
Figure 6 shows the response frequency with no cylinder; results are the average of three trials. Figure 7 shows the response frequency when the cylinder was used. From
Fig. 4 Experimental setup
Table 2 Cylinder parameters
Specification Value
Material Aluminum
Outside diameter mm 32
Thickness mm 1.5
Height mm 500
Figs. 6 and 7, we calculated the displacement difference rate according to:
where D is the displacement difference rate, xincluding is the
displacement including the simulated tumor, and xnone is
the displacement without the simulated tumor. Figures 8 and 9 show the displacement difference rates without and with the use of the cylinder, respectively. Figures 8 and 9 shows the enough frequency ranges to see the change. In Fig. 8, the displacement difference rate is less than 30%, while in Fig. 9 the displacement difference rate is over 50% at 130 Hz with the use of the cylinder.
(2) D= xincluding
−xnone
xnone
×100%,
Finite element analysis results
Validation of the vibration analysis with a pushing cylinder method
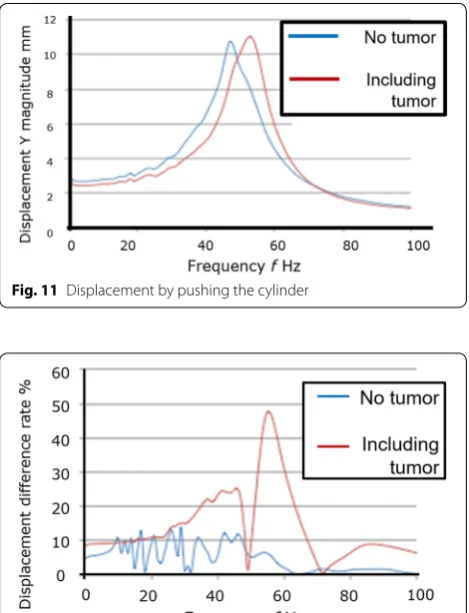
We analyzed the displacement with no cylinder and when the cylinder was pushed into the simulated breast model, as shown in Figs. 10 and 11. From these data, we calculated the displacement difference rates shown in Fig. 12. Without cylinder, the displacement difference rate was < 15%, while with the cylinder the displacement difference rate was > 45% at a frequency of 60 Hz.
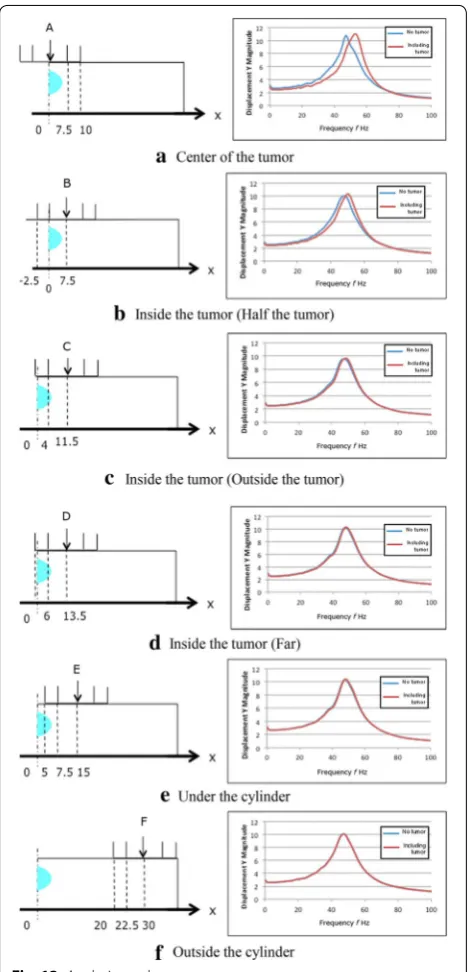
Table 3 Vibration points
Point Distance from the center of the tumor mm
Characteristic
A 0.0 Center of the tumor
B 7.5 Inside the tumor (half the tumor)
C 11.5 Inside the tumor (outside the tumor)
D 13.5 Inside the tumor (far)
E 15.0 Under the cylinder
F 30.0 Outside the cylinder
Fig. 6 Frequency response with no cylinder
Fig. 7 Frequency response using cylinder
0 10 20 30 40 50 60
35 45 55
Di
splace
me
nt
di
ff
er
ence
ra
te
D
%
Frequency f Hz
Fig. 8 Displacement difference with no cylinder
0 10 20 30 40 50 60
110 130 150
di
sp
lacement
di
fference
rate
D
䠂
Frequency䡂Hz
Fig. 9 Displacement difference using cylinder
Position relationship between load point and tumor
The results of the analysis are shown in Table 4 and Fig. 13. The peak frequency changed according to the distance between the load point and measurement point. Without the tumor, peak frequency was always approximately 47–48 Hz, with an average of 47.5 Hz. At the center of the tumor, the differences in the peak fre-quencies with and without the tumor were 5.5 Hz. At the inside of the tumor, the difference in the peak frequency was 2.5 Hz, while at the other points the difference was ± 0.5 Hz.
Discussion
In Figs. 6 and 7, we see that the resonance frequency is different. The resonance frequency with a cylinder was larger enough to conform the tissue difference than with-out a cylinder. This indicates that the pushing cylinder causes the difference in resonance frequency. In addition, from Figs. 8 and 9, the D is larger with a pushing cylinder than without cylinder. This suggests that pushing a cyl-inder would amplify the displacement difference rate to more easily distinguish the normal tissue or tumor.
Furthermore, we can also evaluate the effectiveness of the vibration analysis with a pushing cylinder method. From Figs. 10, 11 and 12, the waveform of the displace-ment to frequency varies greatly. In Fig. 12, D differs more than 30% between tumor and no tumor using a pushing cylinder. The results elucidate the effect of push-ing a cylinder on finite element analysis.
Finally, we analyzed the influence of the relative posi-tion between the load point and tumor. Figure 13 shows the displacement at each measurement point. The results indicate that the closer the load point is to the tumor, the greater the displacement difference in the peak fre-quency is between samples with and without a tumor. This suggests that the measurement and load points with the greatest difference in peak frequency are located on the tumor. Additionally, when the measurement and load points were removed from the center of the tumor, the difference in peak frequencies was within 1 Hz. This sug-gests that we could predict tumor size from changes in peak frequency difference.
From these results, we confirmed that a pushing cyl-inder makes a difference in the resonance frequency of vibration analysis to diagnose a 10.0 mm or greater deep tumor presence and position. The hollow cylinder would have two advantages. One would be shortening the distance to the tumor from skin. Resonance fre-quency is larger when the excitation point is closer to the tumor. The other would be that the tumor moves difficulty since the tissue is harder when pushed. Reso-nance frequency is also larger when the tissue is harder because the vibration is easy to transfer. Therefore, the
Fig. 11 Displacement by pushing the cylinder
Fig. 12 Displacement difference rate with a pushing cylinder
Table 4 Frequencies with and without a tumor
Measurement point Peak frequency Hz Difference from average
of no tumor (47.5 Hz) Hz
No tumor Tumor
(A) Center of the tumor 47 53 + 5.5
(B) Inside the tumor (Half the tumor) 48 50 + 2.5
(C) Inside the tumor (Outside the tumor) 47 48 + 0.5
(D) Inside the tumor (Far) 48 48 + 0.5
(E) Under the cylinder 48 48 + 0.5
difference in frequency would make difference between with and without cylinder. In this paper, we validated the feasibility of the pushing cylinder method in an experiment and performed analyses in a breast model.
The vibration analysis method shows the feasibil-ity to distinguish between a normal tissue or tumor, however, we did not validate to distinguish between a benign or malignant tumor. At the next stage, it is neces-sary to validate the feasibility of distinction of the tumor types. Although there is meaning in revealing that the
difference frequency was 5.5 Hz using vibration, com-pared with the previous work [18], 5.5 Hz is too small to detect the tumor type. We will develop the tumor type discrimination algorithm using known tumor size and depth information.
In terms of the tumor depth, it’s necessary to carry out the FEM experiment under the condition that tumor depth is changing. It’s expected that the frequency change would be similar to the experimental results of the paper because we revealed the frequency changes according to the change of the distance between vibra-tion point and tumor.
Tendency of the result with and without cylinder is similar between phantom and FEM experiment. How-ever, peak frequency is different because the load in FEM is different from the impact of the air-compression. We need more accurate impact model on FEM. Or we will propose another load method to model it easier instead of the air-compressor.
Furthermore, not only tumor types, but the tumor size should also be verified to change the frequency. In addition, the phantom shape is just cube. It’s necessary to analyze the optimized shape suited for actual breast shape. Moreover, we should compare with the ultrasonic method and radiography such as mammography, CT scan and PET-CT. These imaging methods are easy to find the tumor presence and position. However, it is diffi-cult to distinguish the tumor types. The vibration analysis method would be inferior to the imaging method in dis-covery of the tumor presence and position, but would be superior in distinction of the tumor types.
Conclusions
We proposed a novel diagnostic method to distinguish the tissue types such as normal tissue or tumor according to the difference in peak frequency during vibration. We pushed a cylinder and vibrated the skin from the center of the cylinder to reduce the distance to the tumor and render the tumor more difficult to move within the tis-sue. Our primary conclusions were:
(1) In our experiments, we vibrated the silicon with and without the simulated tumor, using air injec-tion to investigate changes in measurement compli-ance with and without pushing the cylinder into a phantom breast model. Results showed that the dis-placement difference rate was more than 50% at a frequency of 130 Hz with the cylinder.
(2) Using finite element analysis, we constructed a simulated breast model based on a real phantom model. With the cylinder, there was a displacement difference rate of greater than 30% between tumor and no tumor.
(3) From finite element analysis, displacement changed based on the distance between the tumor and load point. The closer the load point was to the tumor, the greater the displacement difference in the peak frequency between samples with and without a tumor. At the center of the tumor, differences in peak frequencies with and without the tumor were 5.5 Hz.
Overall, we concluded that the vibration analysis with a pushing cylinder method is useful to distinguish the tissue types. This study is the first stage, but we will dis-tinguish between a benign or malignant tumor in future work. Furthermore, we will compare with the imaging device such as MRI, ultrasonic, mammography, CT and PET-CT.
Acknowledgements
The authors would like to thank Waseda University in Japan by offering the funding support for this publication. Furthermore, we thank the Editage Group (https ://www.edita ge.com/) for editing a draft of this manuscript.
Authors’ contributions
SM conceived the study and drafted the manuscript. HI and YS carried out all experiments and analyzed the data. AT, VP and TM participated in the research design and sequence alignment. All authors read and approved the final manuscript.
Funding
This work was supported in part by JSPS KAKENHI Grant Number JP18K18405.
Availability of data and materials
The datasets supporting the conclusions of this article are included within the article.
Competing interests
The authors declare that they have no competing interests.
Author details
1 Department of Modern Mechanical Engineering, Waseda University,
3‑4‑1 Okubo, Shinjuku, Tokyo 169‑8555, Japan. 2 Department of Aeronaut‑
ics and Astronautics, Tokyo Metropolitan University, 6‑6 Asahigaoka Hino, Tokyo 191‑0065, Japan.
Received: 8 September 2018 Accepted: 20 August 2019
References
1. Hipwell JH, Vavourakis V, Han L, Mertzanidou T, Eiben B, Hawkes DJ (2016) A review of biomechanically informed breast image registration. Phys Med Biol 61(2):R1–R31
2. Samani A, Zubovits J, Plewes D (2007) Elastic moduli of normal and pathological human breast tissues: an inversion‑technique‑based investigation of 169 samples. Phys Med Biol 52(6):1565–1576 3. Silverstein M et al (1995) Prognostic classification of breast ductal
carcinoma‑in‑situ. Lancet 345(8958):1154–1157
4. Siriaunkgul S, Tavassoli FA (1993) Invasive micropapillary carcinoma of the breast. Mod Pathol 6(6):660–662
5. Lazebnik M et al (2007) A large‑scale study of the ultrawideband micro‑ wave dielectric properties of normal, benign and malignant breast tis‑ sues obtained from cancer surgeries. Phys Med Biol 52(20):6093–6115 6. Norris H, Taylor H (1965) Prognosis of mucinous (Gelatinous) carcinoma
of the breast. Cancer 18(7):1056–1061
7. Stavros AT, Thickman D, Rapp CL, Dennis MA, Parker SH, Sisney GA (1995) Solid breast nodules: use of sonography to distinguish between benign and malignant lesions. Radiology 196(1):123–134
8. Elshemey WM, Elsharkawy WB (2009) Monte Carlo simulation of X‑ray scattering for quantitative characterization of breast cancer. Phys Med Biol 54(12):3773–3784
9. Heyes GJ, Mill AJ, Charles MW (2009) Mammography‑oncogenecity at low doses. J Radiol Prot 29(2A):A123–A132
10. Karimi H, Fenster A, Samani A (2013) A novel fast full inversion based breast ultrasound elastography technique. Phys Med Biol 58(7):2219–2233
11. Conley RH et al (2015) Realization of a biomechanical model‑assisted image guidance system for breast cancer surgery using supine MRI. Int J Comput Assist Radiol Surg 10(12):1985–1996
12. Tsalach A, Steinberg I, Gannot I (2014) Tumor localization using mag‑ netic nanoparticle‑induced acoustic signals. IEEE Trans Biomed Eng 61(8):2313–2323
13. Palacio‑Torralba J et al (2015) Quantitative diagnostics of soft tissue through viscoelastic characterization using time‑based instrumented palpation. J Mech Behav Biomed Mater 41:149–160
14. Sun LZ, Wang ZG, Liu Y, Wang G (2009) Elastography method for recon‑ struction of nonlinear breast tissue properties. Int J Biomed Imaging 2009:6
15. Wang ZG, Liu Y, Wang G, Sun LZ (2011) Nonlinear elasto‑mammog‑ raphy for characterization of breast tissue properties. Int J Biomed Imaging 2011:5
16. Ozcan MU, Ocal S, Basdogan C, Dogusoy G, Tokat Y (2011) Characteriza‑ tion of frequency‑dependent material properties of human liver and its pathologies using an impact hammer. Med Image Anal 15(1):45–52 17. Kashif AS, Lotz TF, Heeren AMW, Chase JG (2013) Separate modal analy‑
sis for tumor detection with a digital image elasto tomography (DIET) breast cancer screening system. Med Phys 40(11):113503
18. Yamakawa M, Shiina T (2012) Tissue viscoelasticity imaging using vibra‑ tion and ultrasound coupler gel. Jpn J Appl Phys 51(7S):07GF12 19. Russell N et al (2017) Retrospective methods to estimate radia‑
tion dose at the site of breast cancer development after Hodgkin lymphoma radiotherapy. Clin Transl Radiat Oncol 7:20–27. https ://doi. org/10.1016/j.ctro.2017.09.004
20. Misdorp W (2002) Tumors of the mammary gland. Tumors Domest Anim. https ://doi.org/10.1002/97804 70376 928.ch12
21. Wiseman BS, Werb Z (2009) Stromal effects on mammary gland devel‑ opment and breast cancer. Science 296(5570):1046–1049
22. Kobayashi Y et al (2012) Enhanced targeting in breast tissue using a robotic tissue preloading‑based needle insertion system. IEEE Trans Robot 28(3):710–722
23. Godavarty A et al (2004) Diagnostic imaging of breast cancer using fluorescence‑enhanced optical tomography: phantom studies. J Biomed Opt 9(3):488
24. Mou X, Chen X (1998) Physics in medicine & biology X‑ray characteriza‑ tion of breast phantom materials. Phys Med Biol 43:1367–1377 25. Burfeindt MJ et al (2012) MRI‑derived 3‑D‑printed breast phantom for
microwave breast imaging validation. IEEE Antennas Wirel Propag Lett 11:1610–1613
26. Hebden JC et al (2001) Three‑dimensional time‑resolved optical tomography of a conical breast phantom. Appl Opt 40(19):3278 27. Wellman PS, Howe RD, Dalton E, Kern KA (1999) Breast tissue stiffness
in compression is correlated to histological diagnosis. Tech Report Harvard BioRobotics Lab, pp: 1–15
28. Krouskop TA, Wheeler TM, Kallel F, Garra BS, Hall T (1998) Elastic moduli of breast and prostate tissues under compression. Ultrason Imaging 20(4):260–274
Publisher’s Note