R E S E A R C H
Open Access
A QTL for root growth angle on rice chromosome
7 is involved in the genetic pathway of
DEEPER
ROOTING 1
Yusaku Uga
1*, Yuka Kitomi
1, Eiji Yamamoto
1,2, Noriko Kanno
1, Sawako Kawai
1, Tatsumi Mizubayashi
1and Shuichi Fukuoka
1Abstract
Background:Root growth angle (RGA) is an important trait that influences the ability of rice to avoid drought stress.DEEPER ROOTING 1(DRO1), which is a major quantitative trait locus (QTL) for RGA, is responsible for the difference in RGA between the shallow-rooting cultivar IR64 and the deep-rooting cultivar Kinandang Patong. However, the RGA differences between these cultivars cannot be fully explained byDRO1. The objective of this study was to identify new QTLs for RGA explaining the difference in RGA between these cultivars.
Results:By crossing IR64 (which has a non-functional allele ofDRO1) with Kinandang Patong (which has a functional allele ofDRO1), we developed 26 chromosome segment substitution lines (CSSLs) that carried a particular chromosome segment from Kinandang Patong in the IR64 genetic background. Using these CSSLs, we found only one chromosomal region that was related to RGA: on chromosome 9, which includesDRO1. Using an F2population derived from a cross between Kinandang Patong and the Dro1-NIL (near isogenic line), which had a functionalDRO1allele in the IR64 genetic background, we identified a new QTL for RGA (DRO3) on the long arm of chromosome 7.
Conclusions:DRO3may only affect RGA in plants with a functionalDRO1allele, suggesting thatDRO3is involved in
theDRO1genetic pathway.
Keywords:Chromosome segment substitution lines;DRO1; Drought avoidance; Quantitative trait locus; Root growth angle; Root system architecture
Background
Water shortages, including some that may have been caused by recent global climate change, have occurred more frequently in recent years in agricultural land, and have decreased crop production (Pennisi 2008). Under drought conditions, water remains disproportionately in the deep soil layers. The survival of most terrestrial plants under drought depends on the ability of their roots to obtain water, and deeper rooting appears to be an efficient strategy for avoiding drought stress because it enables a plant to absorb more water from these deep soil layers (Yoshida and Hasegawa 1982; Fukai and Cooper 1995; Rich and Watt 2013). Thus, deeper
rooting is thought to be a key trait in the improvement of drought avoidance in crops (Fukai and Cooper 1995; Manschadi et al. 2006; Kirkegaard et al. 2007). To
en-hance a crop’s ability to avoid drought stress, therefore,
the introduction of genes responsible for deep rooting into shallow-rooting cultivars is a promising breeding strategy. Deep rooting in cereal crops is determined by the combination of a large root growth angle (RGA; the angle between the soil surface and the shallowest pri-mary root) and long seminal and nodal roots (Abe and Morita 1994; Araki et al. 2002). In particular, RGA deter-mines whether a plant develops shallow or deep rooting, because RGA predetermines the dominant direction of root elongation.
To use one or more quantitative trait loci (QTLs) for RGA to improve drought avoidance, QTL analyses have been performed in some crop species such as sorghum * Correspondence:yuga@affrc.go.jp
1
National Institute of Agrobiological Sciences, 2-1-2 Kannondai, Tsukuba, Ibaraki 305-8602, Japan
Full list of author information is available at the end of the article
(Mace et al. 2012) and wheat (Hamada et al. 2012;
Christopher et al. 2013). In rice (Oryza sativa L.), two
QTLs for the root gravitropic response, which is an im-portant component of RGA, have been detected on chromosomes 6 and 10 (Norton and Price 2009). Our research group has also reported three major rice QTLs
for RGA, namelyDRO1 (DEEPER ROOTING 1),DRO2,
and qSOR1 (quantitative trait locus for SOIL SURFACE
ROOTING 1), in three different mapping populations
(Uga et al. 2011, 2012, 2013b).DRO1 has been detected
on chromosome 9 in recombinant inbred lines (IK-RILs) derived from a cross between the shallow-rooting culti-var IR64 and the deep-rooting culticulti-var Kinandang
Patong (Uga et al. 2011). DRO2 has been found on
chromosome 4 in three F2 populations derived from
crosses between each of three shallow-rooting cultivars (ARC5955, Pinulupot1, and Tupa729) and Kinandang
Patong (Uga et al. 2013b).qSOR1 has been fine-mapped
to a position on chromosome 7 in advanced mapping lines derived from a cross between the lowland cultivar Gemdjah Beton, with soil-surface roots and Sasanishiki that lacks soil-surface roots (Uga et al. 2012). Further isolation and characterization of these RGA QTLs will be necessary to elucidate the genetic mechanisms associ-ated with RGA and apply this knowledge to molecular breeding to control RGA.
Recently, our research group cloned and characterized
DRO1, which functions downstream of the auxin
signal-ing pathway and controls the gravitropic curvature of rice roots (Uga et al. 2013a). Under upland conditions with drought stress, a near-isogenic line (NIL) with a
functional allele of DRO1 introduced from Kinandang
Patong (Dro1-NIL) had a significantly larger RGA and higher grain yield than the parental variety, IR64, which
had a non-functional allele ofDRO1. This demonstrates
that a larger RGA can stabilize rice production under
drought stress. Although we identified onlyDRO1in the
IK-RILs in our previous study (Uga et al. 2011), DRO1
alone cannot completely explain the differences in RGA between IR64 and Kinandang Patong. This suggests that one or more undetected QTLs for RGA existed in the IK-RILs. If we can discover one or more new QTLs for
RGA, it seems likely that IR64’s ability to avoid drought
could be improved by incorporating these QTLs, along
withDRO1.
In mapping populations such as RILs, segregation of
major QTLs like DRO1 often masks the presence of
minor QTLs. On the other hand, chromosome segment substitution lines (CSSLs) are efficient genetic materials for detection of minor QTLs because they can separate minor QTLs from major QTLs located in other chromo-some regions (Fukuoka et al. 2010). In the present study, therefore, we developed new CSSLs and looked for pre-viously undetected QTLs for RGA in them.
Results
Evaluation of deep rooting in the IK-CSSLs
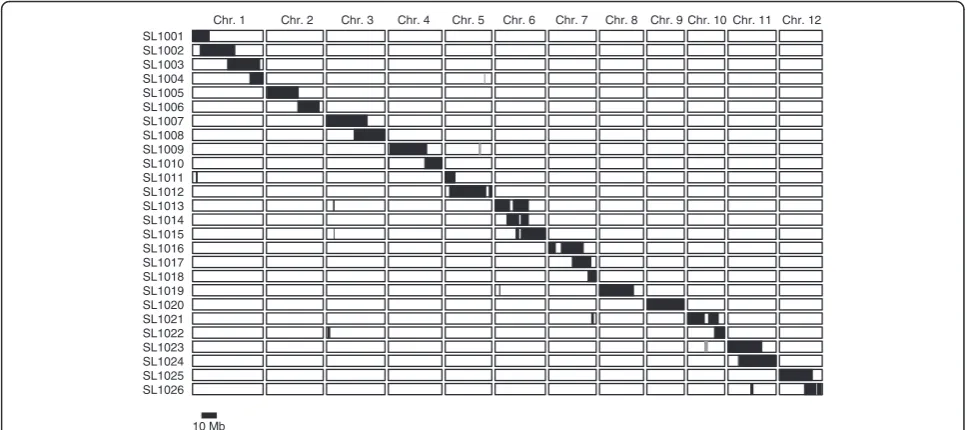
We developed a set of 26 CSSLs derived from a cross between IR64 and Kinandang Patong (hereafter, IK-CSSLs) (Figure 1). Based on physical map positions of the 519 DNA markers used in this study, each chromo-some was covered by one to four lines that carried
Chr. 1 Chr. 2 Chr. 3 Chr. 4 Chr. 5 Chr. 6 Chr. 7 Chr. 8 Chr. 9 Chr. 10 Chr. 11 Chr. 12
SL1002 SL1003 SL1004 SL1005 SL1006 SL1007 SL1008 SL1009 SL1010 SL1011 SL1012 SL1013 SL1014 SL1015 SL1016 SL1017 SL1018 SL1019 SL1020 SL1021 SL1022
SL1025 SL1001
SL1023 SL1024
SL1026
10 Mb
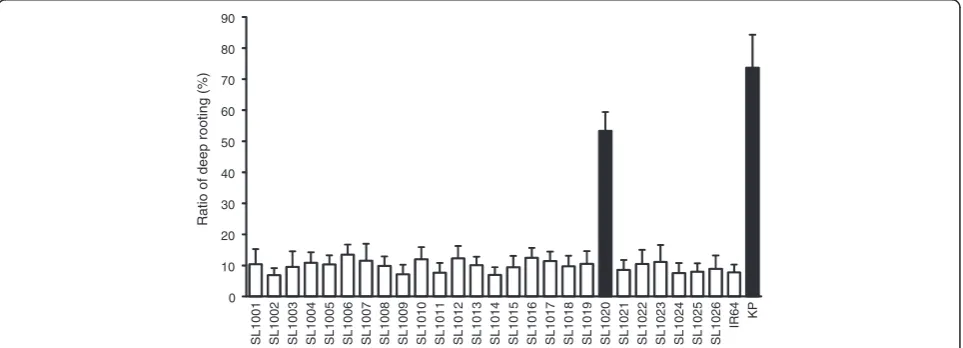
overlapping segments, except for small regions on chro-mosomes 2, 5, 7, 8, and 10 that were not covered. A small segment on the long arm of chromosome 12 in line SL1026 remained heterozygous, because seeds of plants homozygous for Kinandang Patong at this region in the IR64 genetic background could not be obtained. Phenotypic evaluation of several physiological and aboveground morphological traits (heading date, culm length, and the length and number of panicles) in paddy fields revealed significant differences between several lines and IR64, suggesting that many QTLs segregated in this parental combination (Additional file 1: Figure S1). On the other hand, only plants of SL1020, which was homozygous for Kinandang Patong throughout chromosome 9 and which contained functional allele of
DRO1, had a significantly larger mean ratio of deep
root-ing (RDR; 53.4%) than that of IR64 (7.8%), although the RDR in this line was significantly smaller than that in Kinandang Patong (73.7%) (Figure 2). RDR of the other
lines, which included non-functional alleles of DRO1,
did not differ significantly from that of IR64, and ranged from 6.9 to 13.5%.
Detection of QTLs for deep rooting and RGA in the KD-F2 plants
We developed an F2population (KD-F2) derived from a
cross between Kinandang Patong and Dro1-NIL because we did not find RGA QTLs in the IK-CSSLs having
non-functional alleles ofDRO1. When grown in the baskets,
Dro1-NIL (RDR = 44.0%; RGA = 58.3°) had deeper roots than IR64 (RDR = 4.4%; RGA = 35.1°) but shallower roots than Kinandang Patong (RDR = 76.1%; RGA = 67.1°) (Figure 3). The RDRs in the KD-F2 plants showed trans-gressive segregation, with values ranging from 22.2% to 83.3%. The RGAs also showed transgressive segregation, with values ranging from 35.0° to 79.0°. Broad-sense
heritabilities of RDR and RGA in KD-F2 plants were 68.7% and 57.1%, respectively.
Among the 768 SNP markers, 273 (35.5%) were poly-morphic between IR64 and Kinandang Patong. To re-solve the linkage gaps and to saturate the regions around the LOD support intervals for the QTLs de-tected with the DNA markers, we added 33 polymorphic SSR markers in these regions. The linkage map for the KD-F2 plants, composed of 306 DNA markers, covered almost the entire rice genome (Additional file 2: Figure S2). The total map length was 1359.8 cM, and the average dis-tance between markers was 4.63 cM. The linkage map of chromosome 9 was divided into two linkage groups near
the region of DRO1 because Dro1-NIL has the same
chromosome segment as Kinandang Patong in this region (Figure 4, Additional file 2: Figure S2).
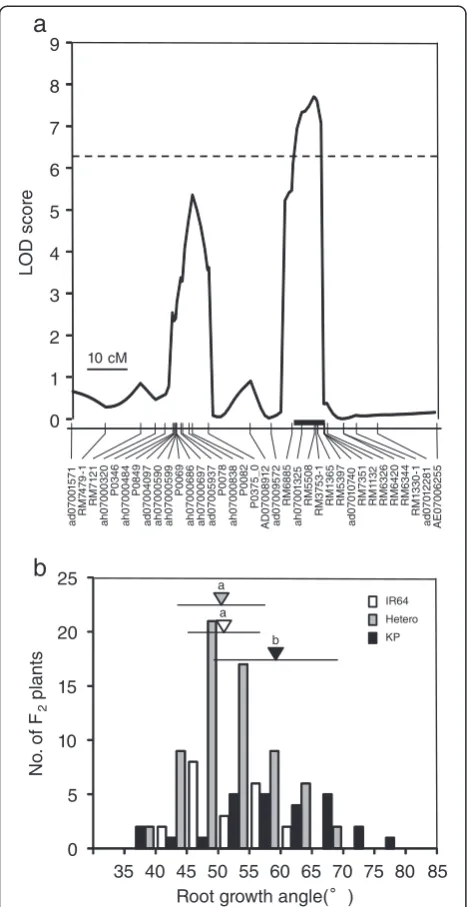
No QTL for RDR was detected at an LOD threshold of 6.2, although two minor QTLs were suggested on chromosomes 6 (LOD = 4.9 at SNP marker ah06000736) and 7 (LOD = 4.1 at SSR marker RM5397) when we de-creased the LOD threshold to 3.0 (Figure 4). On the other hand, we detected one QTL for RGA at SSR marker RM5508 on chromosome 7 based on an LOD threshold of 6.2 (Table 1; Figures 4, 5a and Additional file 2: Figure S2). This QTL showed a relatively large contribution to the phenotypic variance, explaining 21.9% of the total (Table 1). The additive effect of the homozygous Kinandang Patong allele at this QTL on RGA was 10.0° (i.e., = 2 × the AE for a single copy of the allele). The mean RGA of lines homozygous for the Kinandang Patong allele at the RM5508 closest to this QTL was significantly larger than that of lines homozy-gous for the IR64 allele (Figure 5b). When we decreased the LOD threshold to 3.0, we found evidence of two minor QTLs for RGA (Table 1; Figure 4): one on chromosome 6 (LOD = 4.0 at SNP marker ah06000736)
0 10 20 30 40 50 60 70 80 90
SL1002 SL1003 SL1004 SL1005 SL1006 SL1007 SL1008 SL1009 SL1010 SL1011 SL1012 SL1013 SL1014 SL1015 SL1016 SL1017 SL1018 SL1019 SL1020 SL1021 SL1022 SL1025
SL1001 SL1023 SL1024 SL1026
IR64 KP
Ratio
of
deep rooting (%)
and one on chromosome 7 (LOD = 5.4 at SNP marker P0082). A two-dimensional scan produced a heat map that revealed no significant epistatic interaction throughout the genome in this population (Additional file 3: Figure S3).
Discussion
Evaluation of RDRs in the 26 IK-CSSLs showed that only the SL1020 plants had a significantly larger RDR than
IR64. SL1020 has the functional allele of DRO1 derived
from Kinandang Patong, whereas all other lines have the non-functional allele derived from IR64. However, the RDR of SL1020 was significantly smaller than that of Kinandang Patong, suggesting that undetected QTLs for
RDR may explain the difference of RDR between SL1020 and Kinandang Patong and that they exist in other chromosomal regions. It was unclear why we found no other RDR QTL in the IK-CSSLs. Based on the IK-CSSL results, we hypothesized that there are one or more add-itional undetected QTLs that can only function in a
gen-etic background that has the functional allele of DRO1.
These undetected QTLs would affect the genetic
path-way of DRO1, and therefore should not be identified in
IK-CSSLs that have the non-functional allele of DRO1
(i.e., all IK-CSSLs except SL1020). It was also possible that undetected QTLs were located in some small chromosomal segments that were homozygous for IR64.
0 10 20 30 40 50 60
0 10 20 30 40 50 60 70 80 90 100 IR64 Dro1-NIL KP
Ratio of deep rooting(%)
No. of
F
2
plants
0
30 35 40 45 50 55 60 65 70 75 80 85 5
10 15 20 25 30
35 IR64 Dro1-NIL KP
0
Root growth angle( )
No. of
F2
plants
Figure 3Frequency distributions for the ratio of deep rooting and the root growth angle in the KD-F2 plants.Vertical and horizontal lines above the bars indicate the mean and SD in the parental lines.
Figure 4LOD score curves for the QTLs for the ratio of deep rooting and root growth angle in the KD-F2 plants.Rectangles represent linkage maps, with the DNA marker positions shown as vertical lines. Chromosome numbers are indicated under each linkage map (short arms are on the left). 9S and 9 L indicate separate linkage maps for the short and long arms of chromosome 9, respectively, for the region around
We therefore created a KD-F2 population derived from a cross between Kinandang Patong and Dro1-NIL, which
had the functional allele of DRO1 in the IR64 genetic
background.
We detected no significant QTLs for RDR (i.e., QTLs with a value that exceeded the LOD threshold) in the KD-F2 plants. This result might be explained by our quantification of RDR using the basket method. Dro1-NIL had larger RDR values than IR64. We hypothesize that RDR might be not adequate to evaluate RGA differ-ences among the KD-F2 plants, even though the basket method let us successfully detect a significant difference in RGA between IR64 and Kinandang Patong (Uga et al. 2011). Therefore, we directly measured RGA in the KD-F2 plants and performed QTL analysis based on this data. This approach revealed a significant QTL for RGA on chromosome 7 (Table 1). The additive effect of the homozygous allele for Kinandang Patong at this QTL (RGA = 10°) can explain the difference of RGA between Dro1-NIL and Kinandang Patong (RGA = 8.8°). This sug-gests that we can reproduce the deep roots of Kinandang Patong in the IR64 genetic background by introducing this QTL from Kinandang Patong into Dro1-NIL. We then hy-pothesized that one or more key genes responsible for RGA may be located in this chromosome region. We
identified DRO1 and DRO2 in our previous studies
(Uga et al. 2011, 2013b). Thus, we propose designating
this third QTL for deeper rooting asDEEPER ROOTING
3(DRO3).
Detection ofDRO3 in the KD-F2 plants but not in the
IK-CSSLs supports the hypothesis thatDRO3affects the
genetic pathway of DRO1. To test this hypothesis, we
are currently developing two types of NILs for DRO3:
one in IR64 (which has the non-functional allele of
DRO1) and one in Dro1-NIL (which has the functional
allele ofDRO1). We hypothesize thatDRO3was not
de-tected in our previous research in the IK-RILs that
con-tain DRO1 because segregation of major QTLs often
conceals the genetic effects of minor QTLs in primary
mapping populations such as F2 and RIL populations
(Fukuoka et al. 2010). We expected to detect DRO2 in
the KD-F2 plants because DRO2 has a large genetic
ef-fect and was found in three other F2populations derived
from shallow-rooting varieties that had the functional
al-lele ofDRO1, with Kinandang Patong (Uga et al. 2013b).
We hypothesized that the same allele or a small
differ-ence in the genetic effects at DRO2 between IR64 and
Kinandang Patong was not involved in the natural vari-ation of RGA between IR64 and Kinandang Patong. However, the present QTL results and our previous
re-ports (Uga et al. 2013a,b) suggest thatDRO1,DRO2, and
DRO3 are associated with deep rooting of Kinandang
Patong.
DRO3 was detected near qSOR1, but comparison of
the physical map positions between the 1.8-LOD
sup-port intervals for DRO3 (23.00 to 23.95 Mb) and the
candidate region for qSOR1 (24.78 to 25.59 Mb) based
on the Nipponbare genome sequence in the RAP data-base (http://rapdb.dna.affrc.go.jp/) showed that they had different locations on chromosome 7. Since there is no
reported QTL for RGA in the DRO3 region, we
com-pared the positions of DRO3 and the other root QTLs
summarized by Courtois et al. (2009). According to their report, many QTLs for the weight of deep roots, max-imum root length, root thickness, and root dry weight
were located in the DRO3 region. Further study using a
DRO3 NIL will be needed to elucidate whether DRO3
shows pleiotropic effects on other root morphological
traits. We identified no genes homologous to DRO1 in
the DRO3 region. Next, we surveyed known root genes
characterized in mutants in the DRO3 region by using
the Overview of functionally characterized Genes in Rice Online database (OGRO, http://qtaro.abr.affrc.go.jp/ogro;
Yamamoto et al. 2012). We also checked theDRO3region
for the presence of auxin-related genes, because many
auxin-related genes such as CROWN ROOTLESS 1
(CRL1)/ADVENTITIOUS ROOTLESS 1 (Inukai et al.
2005; Liu et al. 2005),OsPID1(Morita and Kyozuka 2007),
CRL4/OsGNOM1 (Kitomi et al. 2008; Liu et al. 2009),
CRL5 (Kitomi et al. 2011), and OsIAA13 (Kitomi et al.
2012) are involved in root gravitropism, which determines RGA. However, we found no candidate root- or
auxin-Table 1 Putative QTLs for root growth angle detected in KD-F2
Chr. Nearest marker Map position (Mb)a Genetic distance (cM)b LOD AE(°)c DE(°)d R2e
6 ah06000736 14.01 0.0 4.0 −3.7 1.3 10.2
7 P0082 17.12 0.0 5.4 −4.7 2.7 13.2
7 RM5508 23.56 0.0 7.7* 5.0 −4.2 21.9
37.2f
a
Physical map position of each marker based on the latest version of the RAP database (IRGSP-1.0;http://rapdb.dna.affrc.go.jp/).
b
Genetic distance from the QTL LOD peak to the nearest marker.
c
Additive effect of the allele from Kinandang Patong compared with that from IR64.
d
Dominance effect of the allele from Kinandang Patong compared with that from IR64.
e
Percentage of the phenotypic variance explained by each QTL.
f
Percentage of the phenotypic variance explained by all three QTLs.
related genes in the DRO3 region, indicating that DRO3 appears to be a novel gene that controls RGA in rice. Therefore, we are currently carrying on map-based
clon-ing ofDRO3in our laboratory to clarify the genetic
mech-anisms of DRO3 and the relationship of the molecular
functions betweenDRO1andDRO3.
We found several CSSLs with agronomic traits that differed significantly from those of IR64 in the paddy field (Additional file 1: Figure S1), although only one of the IK-CSSL lines (SL1020) had a significantly larger RDR than IR64. These results suggest that the IK-CSSLs are useful genetic material for discovering new QTLs for other traits. In our previous research, we found wide genetic variation in aspects of root system architecture other than RGA, such as root length, thickness, and vol-ume, between IR64 and Kinandang Patong under upland field conditions (Uga et al. 2008, 2013a). We expect to detect new QTLs for other root morphological traits in the IK-CSSLs. For this purpose, we are currently trying to evaluate other root traits using the IK-CSSLs. Identifica-tion of undetected QTLs for root traits in the IK-CSSLs will accelerate marker-assisted selection for characteristics of the root system architecture, which will in turn support breeding for improved drought avoidance in rice.
Conclusions
We discovered new QTL for RGA on chromosome 7
(DRO3) explaining the difference in RGA between IR64
and Kinandang Patong other than DRO1. Our genetic
analyses suggest that DRO3 may be a promising QTL
that can be used to improve RGA in IR64. We believe that development of a gene pyramiding line that
con-tains the Kinandang Patong alleles of both DRO1 and
DRO3 in the IR64 genetic background will produce
plants that avoid drought stress better than Dro1-NIL.
Cloning of DRO3 may also accelerate molecular
breed-ing for higher RGA in other shallow-rootbreed-ing varieties.
Methods
Plant materials
To detect new QTLs associated with genetic variation in RGA between IR64 and Kinandang Patong, we devel-oped a set of 26 chromosome segment substitution lines derived from a cross between IR64 and Kinandang Patong. (Additional file 4: Figure S4) summarizes the procedure for development of the IK-CSSLs. Kinandang
Patong was crossed with IR64 to produce F1plants. The
F1plants were then backcrossed four times with IR64 to
obtain BC4F1 plants. In each backcrossed generation,
plants heterozygous for the target regions were selected by using DNA markers to guide further backcrossing or
self-pollination. BC4F1 plants were consecutively
self-pollinated three times to substitute target regions homo-zygous for the donor cultivar Kinandang Patong allele
and those homozygous for the recurrent parent cultivar IR64 at other regions.
Based on our analysis of the results obtained with the
IK-CSSLs, we also developed an F2population (KD-F2)
consisting of 121 lines derived from a cross between Kinandang Patong and Dro1-NIL, which is a NIL
homo-zygous for the Kinandang Patong allele of DRO1 in the
genetic background of IR64 (Uga et al. 2013a).
We surveyed the genotypes of the IK-CSSLs and KD-F2
by using the markers described in the section “DNA
marker analysis”.
Measurements of shoot physiological and morphological traits in the IK-CSSLs
Heading date, culm length, and the length and number of panicles in the IK-CSSLs and IR64 were evaluated in paddy field located at the National Institute of
Agrobio-logical Sciences (36°1’N, 140°6’E) in Tsukuba, Japan, in
the summer of 2012. Seeds were sown in the seedling nursery on April 16 and 60 plants in each CSSL per plot were transplanted on May 16. Three plots per line were arranged in a randomized block design. We determined the number of days from sowing to heading of the first panicle as heading date. After maturating, we measured the culm length, and the length and number of panicles in each plant. Twenty-seven samples (9 plants × 3 plots) were used to calculate means in each line.
Measurements of the ratio of deep rooting (RDR) and RGA
RDR was evaluated quantitatively in the IK-CSSLs and KD-F2 based on a basket method that uses open stainless-steel-mesh baskets filled with soil in a green-house (average air temperature, 30°C; average relative humidity, 50%; natural lighting), as described previously (Uga et al. 2011). We defined the RDR as the number of roots that penetrated the lower part of the mesh
(i.e.,≥50° from the horizontal, centered on the stem)
di-vided by the total number of roots that penetrated the whole mesh. Ten samples were used to calculate mean RDR in each line of IK-CSSLs. After measurement of RDR in the KD-F2 plants, the roots in each basket were washed carefully, and the RGA of each plant was deter-mined by measuring the angle between the soil surface (horizontal line) and the shallowest primary roots with a protractor, as described previously (Uga et al. 2013a).
DNA marker analysis
We determined the genotypes of the IK-CSSLs by using 394 single-nucleotide polymorphism (SNP) markers se-lected from genome-wide SNP marker data (Yonemaru et al. 2014), and 125 simple sequence repeat (SSR) markers selected on the basis of the data from the Inter-national Rice Genome Sequencing Project (2005). We
also determined the genotypes of the KD-F2 by using 273 SNP and 33 SSR markers. Total DNA was extracted from leaves by using the CTAB method (Murray and Thompson 1980). The polymorphic SNP markers were detected from a set of 768 custom SNP panels by using a GoldenGate Genotyping Universal-32 768-plex Assay Kit and the BeadStation 500G system (both from Illumina,
San Diego, CA, USA) according to the manufacturer’s
in-structions. PCR amplification for SSR analysis was
per-formed in 5-μL reaction mixtures containing 0.5 μL
(20 ng) DNA, 1.0 μL 5× PCR buffer, 0.1 μL 10 mM
dNTPs, 0.025 μL (5 units) of KAPA2G Fast DNA
Poly-merase (Kapa Biosystems, Boston, MA, USA), 0.125μL of
a mixture of forward and reverse primers (20 pM each),
and 3.25μL H2O. The PCR program consisted of an initial
denaturation for 1 min at 95°C; followed by 35 cycles of 10 s at 95°C, 10 s at 55°C, and 1 s at 72°C; and with a final extension for 30 s at 72°C. PCR products were separated by electrophoresis in 3% agarose gels (Agarose LE; Promega Corporation, Madison, WI, USA) at 200 V for 80 min.
Statistical and QTL analyses
To compare the mean RDRs of the 26 IK-CSSLs and
IR64, we used Dunnett’s test in version 7.0 of the JMP
software (SAS Institute, Cary, NC, USA). All lines were compared with IR64 as the reference.
The broad-sense heritability (h2B) of RGA in KD-F2
population,h2B[F2], was estimated from the variances of
the parental plants and the variance among the F2lines,
and was calculated as follows:
h2
B½ ¼F2 Vp½ F2– Vp½ þP1 Vp½ P2
=2=Vp½ F2
where Vp[F2] is the phenotypic variance among the F2 lines, and Vp[P1] and Vp[P2] are the phenotypic vari-ances of parental plants 1 and 2.
Construction of a linkage map and QTL analysis for the KD-F2 plants were performed using the R/qtl soft-ware (http://www.rqtl.org/; Broman et al. 2003). Genetic
distances were estimated using the software’s Kosambi
map function (Kosambi 1944). Putative QTLs were de-tected using the composite interval mapping (CIM) function. The CIM threshold was based on the results of 1000 permutations at a 5% significance level (Churchill and Doerge 1994). The confidence intervals around each significant QTL peak were determined using 1.8-LOD support intervals (Broman et al. 2003). The additive and dominant effects and the percentage of phenotypic
vari-ance explained by each QTL (R2) at the maximum LOD
thresholds based on the results of 1000 permutations at a 5% significance level (Broman et al. 2003).
To compare the mean RGAs in three genotypes for the DNA marker (RM5508) closest to the RGA QTL in
the KD-F2, the Tukey’s multiple-comparison test
pro-vided by JMP version 7.0 was used.
Additional files
Below is the link to the electronic supplementary material.
Additional file 1:Shoot physiological and morphological traits of the 26 IK-CSSLs and of IR64.
Additional file 2:Position of the markers nearest to the QTL for root growth angle detected in the KD-F2 plants.
Additional file 3:Heat map for the two-dimensional genome scan with a two-QTL model in the KD-F2 plants.
Additional file 4:Illustration of the scheme used to develop chromosome segment substitution lines (IK-CSSLs) carrying Kinandang Patong chromosome segments in the IR64 genetic background.
Competing interests
The authors declare that they have no competing interests.
Authors’contributions
YU designed the experiments and wrote the manuscript. YU, YK, NK, and SK evaluated the root phenotypes. NK performed SSR analysis. TM and SF performed SNP analysis. YU and EY analyzed the QTL. All authors read and approved the final manuscript.
Acknowledgments
We thank the staff of the technical support section of the National Institute of Agrobiological Sciences for their field management. This work was supported by grants from the Ministry of Agriculture, Forestry and Fisheries of Japan (Genomics for Agricultural Innovation QTL-4003; Genomics-based Technology for Agricultural Improvement RBS2009).
Author details
1National Institute of Agrobiological Sciences, 2-1-2 Kannondai, Tsukuba,
Ibaraki 305-8602, Japan.2(Present address) NARO Institute of Vegetable and
Tea Science, 360 Kusawa, Ano, Tsu, Mie 514-2392, Japan.
Received: 5 September 2014 Accepted: 20 January 2015
References
Abe J, Morita S (1994) Growth direction of nodal roots in rice: its variation and contribution to root system formation. Plant Soil 165:333–337
Araki H, Morita S, Tatsumi J, Iijima M (2002) Physio-morphological analysis on axile root growth in upland rice. Plant Prod Sci 5:286–293
Broman KW, Wu H, Sen S (2003) R/qtl: QTL mapping in experimental crosses. Bioinformatics 19:889–890
Christopher J, Christopher M, Jennings R, Jones S, Fletcher S, Borrell A et al (2013) QTL for root angle and number in a population developed from bread wheats (Triticum aestivum) with contrasting adaptation to water-limited environments. Theor Appl Genet 126:1563–1574
Churchill GA, Doerge RW (1994) Empirical threshold values for quantitative trait mapping. Genetics 138:963–971
Courtois B, Ahmadi N, Khowaja F, Price AH, Rami JF, Frouin J et al (2009) Rice root genetic architecture: meta-analysis from a drought QTL database. Rice 2:115–128
Fukai S, Cooper M (1995) Development of drought-resistant cultivars using physio-morphological traits in rice. Field Crops Res 40:67–86
Fukuoka S, Nonoue Y, Yano M (2010) Germplasm enhancement by developing advanced plant materials from diverse rice accessions. Breed Sci 60:509–517
Hamada A, Nitta M, Nasuda S, Kato K, Fujita M, Matsunaka H et al (2012) Novel QTLs for growth angle of seminal roots in wheat (Triticum aestivumL.). Plant Soil 354:395–405
International Rice Genome Sequencing Project (2005) The map based sequence of the rice genome. Nature 436:793–800
Inukai Y, Sakamoto T, Ueguchi-Tanaka M, Shibata Y, Gomi K, Umemura I et al (2005)Crown Rootless1, which is essential for crown root formation in rice, is a target of an AUXIN RESPONSE FACTOR in auxin signaling. Plant Cell 17:1387–1396
Kirkegaard JA, Lilley JM, Howe GN, Graham JM (2007) Impact of subsoil water use on wheat yield. Aust J Agric Res 58:303–315
Kitomi Y, Inahashi H, Takehisa H, Sato Y, Inukaia Y (2012) OsIAA13-mediated auxin signaling is involved in lateral root initiation in rice. Plant Sci 190:116–122 Kitomi Y, Ito H, Hobo T, Aya K, Kitano H, Inukai Y et al (2011) The auxin
responsive AP2/ERF transcription factorCROWN ROOTLESS5is involved in crown root initiation in rice through the induction ofOsRR1, a type-A response regulator of cytokinin signaling. Plant J 67:472–484 Kitomi Y, Ogawa A, Kitano H, Inukai Y (2008)CRL4regulates crown root
formation through auxin transport in rice. Plant Root 2:19–28
Kosambi DD (1944) The estimation of map distance from recombination values. Ann Eugen 12:172–175
Liu H, Wang S, Yu X, Yu J, He X, Zhang S et al (2005) ARL1, a LOB domain protein required for adventitious root formation in rice. Plant J 43:47–56
Liu S, Wang J, Wang L, Wang X, Xue Y, Wu P et al (2009) Adventitious root formation in rice requires OsGNOM1 and is mediated by the OsPINs family. Cell Res 19:1110–1119
Mace ES, Singh V, van Oosterom EJ, Hammer GL, Hunt CH, Jordan DR et al (2012) QTL for nodal root angle in sorghum (Sorghum bicolourL. Moench) co-locate with QTL for traits
associated with drought adaptation. Theor Appl Genet 124:97–109 Manschadi AM, Christopher JT, de Voil P, Hammer GL (2006) The role of root
architectural traits in adaptation of wheat to water-limited environments. Funct Plant Biol 33:823–837
Morita Y, Kyozuka J (2007) Characterization ofOsPID, the rice ortholog ofPINOID, and its possible involvement in the control of polar auxin transport. Plant Cell Physiol 48:540–549
Murray MG, Thompson WF (1980) Rapid isolation of high molecular weight plant DNA. Nucl Acids Res 8:4321–4325
Norton GJ, Price AH (2009) Mapping of quantitative trait loci for seminal root morphology and gravitropic response in rice. Euphytica 166:229–237 Pennisi E (2008) The Blue Revolution, drop by drop, gene by gene. Science
320:171–173
Rich SM, Watt M (2013) Soil conditions and cereal root system architecture: review and considerations for linking Darwin and Weaver. J Exp Bot 64:1193–1208 Uga Y, Hanzawa E, Nagai S, Sasaki K, Yano M, Sato T et al (2012) Identification of
qSOR1, a major rice QTL involved in soil-surface rooting in paddy fields. Theor Appl Genet 124:75–86
Uga Y, Okuno K, Yano M (2008) QTL underlying natural variation in stele and xylem structures of rice root. Breed Sci 58:7–14
Uga Y, Okuno K, Yano M (2011)Dro1, a major QTL involved in deep rooting of rice under upland field conditions. J Exp Bot 62:2485–2494
Uga Y, Sugimoto K, Ogawa S, Rane J, Ishitani M, Hara N et al (2013a) Control of root system architecture byDEEPER ROOTING 1increases rice yield under drought conditions. Nat Genet 45:1097–1102
Uga Y, Yamamoto E, Kanno N, Kawai S, Mizubayashi T, Fukuoka S et al (2013b) A major QTL controlling deep rooting on rice chromosome 4. Sci Rep 3:3040 Yamamoto E, Yonemaru J, Yamamoto T, Yano M (2012) OGRO: The Overview of
functionally characterized Genes in Rice online database. Rice 5:26 Yonemaru J, Ebana K, Yano M (2014) HapRice, a SNP haplotype database and a
web tool for rice. Plant Cell Physiol 55:e9, 1–12