Vol. 4, Issue 11, November 2015
An Optimal Approach to Edge Detection
Using Fuzzy Rule and Sobel Method
Dr. Yusuf Perwej
Assistant Professor, Dept. of Co mputer Sc ience & Engineering, A l Baha Un iversity, Al Baha, Kingdom of Saudi
Arabia (KSA)
ABS TRACT:Edge detection is one of the most fundamental operations in image processing and computer vision. It is defined as the process of locating the boundaries of objects or textures delineate in an image. It is because of the fact that, detection of edges simp lifies the analysis of images by notably reducing the amount of data to be processed by filtering undesirable information, meantime preserving the vital structural information of an image. Sobel Edge Detection is commonly used in edge detection. In the edge function, the Sobel method uses the derivative approximation to discovery edges. But when the image has lots of white Gaussian noises, it is very unintelligib le to get the peak value of the first derivative; the reason is so far as that the noise points and the useful signals mix up. The Sobel operator is simp le, but its accuracy suffers in noisy conditions. This research paper endows the fuzzy filter based Sobel Edge Detection technique. This technique depends on fuzzy ru le based system using 2X 2 wind ow mask wh ich comprises many fu zzy rules wh ich are used to ameliorate the me mbership va lue of the image in three fu zzy sets, black, white or edge and this filtered image is given as input to Sobel Edge Detection technique. This perspective gives improved results than traditional Sobel Edge Detection technique based on smoothing effect of the unsystematic noisy images. An optimal edge-detection algorithm is necessary to provide an errorless solution that is adaptable to the diffe rent noise levels of these images to help in identifying the valid image contents produced by noise.
KEYWORDS: Fuzzy Ru les, Edge Detection, Sobel Method, Fuzzy Log ic, Gaussian Noises, Fuzzy Me mbership Functions.
I. INTRODUCTION
An edge corresponds to local intensity discontinuities of an image. In the real world, the d iscontinuities reflect an intense intensity change, such as the boundary between different regions, shadow boundaries, and abrupt changes in surface orientation and materia l properties. For e xa mp le, the edges represent the outline of a shape, the difference between the colors and pattern or texture. Eventually, edges can be used for boundary estimation and segmentation in scene understanding. They can also be used to find corresponding points in mult iple images of the same scene. Edge detection is an advantageous task to extract clear edges of digital images in computer vision. Edge detection is required for an object recognition, feature detection, and image segmenta tion. The problem is that in general edge detectors behave very peaky [1]. As long as their behavior may fall within permissiveness in specific situations, norma lly edge detectors have obstacle adapting to different situations. The quality of edge detection is highly dependent on lighting conditions, the existence of objects of simila r intensities, density of edges in the scene, and noise [2]. The c rucial problem with edge detection is when noise is existent in images. It is not sufficient to simply reduce the noise, because the image will be either distorted or blurred. So far as different edge detectors work preferable under different conditions, it would be ideal to have an algorithm that ma kes use of multip le edge detectors, applying each one when the scene conditions are most best possible for its method of detection. An edge in an image occurs when the gradient is greatest. The operator works by recognizing these large gradients to find the edges. There is a huge amount of operators designed to detect certain types of edges. The operators can be configured to search for vertical, horizontal, or diagonal edges.
characterized by me mbership function which assigns me mbership value between 0 and 1to each object. The approach of three level thresholding by using [4] fu zzy partitions to find the best edge of an image. They derived the conditions to ma ximize the entropy function due to which we get c lear edges
[5]. At the identical time the corners get sharper and can be defined effortlessly are various developed fuzzy edge detection techniques. Fuzzy logic is a form of knowledge representation suitable for notions that cannot be defined precisely, [6] on their conte xts. Fuzzy logic helps to highlight edges of an image. In this paper 2*2 p ixe l window is a scanned and fuzzy infe rence based system is developed for detecting edges. The rule base of 16 rules has been applied to mark the pixe l as wh ite, blac k or edge. The logic o f fu zzy filter is used in the Sobel edge detection [2].
II. THE LITERATUR E REVIEW
The edge detection is one of the most vital tasks in pattern recognition and image processing. It plays an important role in the multimed ia and computer vision, Image discerns, Image enhancement and image compression, [7] etc. It is norma lly the first operation that is performed before tasks such as boundary detection, segmentation , classification, registration, understanding and recognition in image processing circumfe rence [8]. The new edge detection method that gives better edge detection accuracy than 4-connected, 8- connected and Sobel techniques. It is based upon simp le arith metic and logic operations, consisting of three procedures: image binarization image contraction and image subtraction [9]. The a lgorith m works fo r automat ic visual inspection. It ma kes use of no threshold. It can be used for both binary and grayscale images. According to this method, the grayscale images are first converted into binary images. This procedure can be eliminated for a binary image. Then, the image is contracted to get the contents of the inspected region. The contents are subtracted from the inspected region to produce the boundary [10].
The Wafa barkhoda, proposed a new fuzzy based edge detection algorithm wh ich used two different methods, gradient and standard deviation of pixel values, wh ich form two set of edges which are considered as inputs for fuzzy system and then based on fuzzy logic, the final decision is made by the fuzzy system about whether each pixel is edge or non edge according to 5 fuzzy rules and fuzzy me mbe rship functions [11]. This method showed the highest performance and quality of the extracted edges when compared to the other edge detection methods like Sobel, Robert, and Prewitt. The S Abid et a l. proposed a unusual neural network approach for edge detection. This algorith m used Multilayer Perceptron (M LP) to detect edges in noisy & low [12] contrast grayscale images. Simu lated results on synthetic and real images showed promising results in terms of prec ision & localizat ion. The Fesharaki and He llestrand apply, a student –t test to compare the distribution functions of the intensities in the neighborhood of a given pixe l and the pixel can be accurately classified as edge pixel or reg ion pixe l. Using a 5x5 window, the method works well for both synthetic and natural images [13].
The next system which co mbines Sobel edge detection operator and soft -threshold wavelet de-noising for edge detection. This system used on images which include White Gaussian noises. The widely usedoperators such as Sobel, Prewitt, Roberts and Lap lacain a re sensitive to noise and their anti-noise performances are substandard [14]. This paper proposes an edge detection method which combines soft -threshold wavelet denoising and Sobel operator, its anti-noise performance is very strong. Firstly soft-threshold wavelet used to remove noise, then Sobel edge detection used for edge detection on the image. The effect by using this method to do edge detection is very benign and can remove the noise effect. Again Jesal Vasavada et.al proposed an edge detection method for grayscale images based on BP Feed -forwa rd Neura l Network to detect edges in grayscale images. The network is tra ined by back-propagation learning algorith m for Standard deviation and gradient values [15].
pixe ls that can be used to form a line through the middle pixel [18]. The Ha medMehrara proposed a novel edge detection using Back Propagation Neural Network (BPNN). In this technique, the neural network is trained by using 16 possible quad pixe ls, binary images and then imp le mented on Input Gray scale images after single -level binarization [19]. Finally, the rital presents a two stage paradigm of edge detection. The Image is represented in Image Adaptive Neighborhood Hypergraph model. Local information of the given image is e xplo ited. The hyper-edges of the image a re classified as noise, edge or region based on combinatoria l definit ions. The researchers think about that local homogeneity characterizes edges, global homogeneity charac terizes regions and under no circumstances homogeneity characterizes noise [20].
III. THE CRITERIA AND DIFFICULTY OF EDGE DET ECTION
The quality of edge detection can be measured from various criteria impartia lly. The certain criteria are proposed in terms of mathemat ical measurement, certain of them a re based on application and imp le mentation require ments.The criteria of edge detection will he lp to evaluate the carrying out of edge detector techniques [21].
1. Surpassing detection: There should be a min imu m number of fa lse edges or ma ximu m Signal Noise Ratio (SNR). Ordinarily, edges are detected after a threshold operation. The high threshold will lead to less false edges, but it also reduces the number of true edges detected.
2. No ise sensitivity: The robust algorithm can detect edges in certain acceptable noise environments. In fact edge detector detects the edges and also amplifies the noise simultaneously. Strategic filtering , consistency checking and post processing can be used to reduce noise sensitivity [21].
3. Surpassing localization: The edge location must be reported as close as possible to the correct position, i.e. edge localization accuracy.
4. Orientation sensitivity: The operator not only detects the edge magnitude, however, it a lso de tects edge orientation correctly. The orientation can be used in post processing to connect edge segments, reject noise and suppress non -ma ximu m edge -magnitude.
5. Speed and competency: The algorithm should be fast enough to be used in an image processing system. An algorith m that allows recursive imple mentation or separable processing can greatly improve competency [21].
The edge detection is a difficult contention. The application images contain object boundaries and object shadows and noise. The second cause of problems is degradation in image acquisition. Infrequently it may be difficult to distinguish the exact edge fro m noise or trivia l geo metric features. The fingerprint found at a crime scene might be smeared, so that the tracks of the fingerprint may be connected or broken. Two level edge detection processes are often used since the difficulty of edge estimat ion cannot be effortlessly prevail over from detection operators alone. The first level process, called low-leve l process, extracts pieces of raw edge segments and geometric features, called primitives [22]. They may be incomplete and erroneous. The second level process typically is called high -level process. It will interpret and combine ra w edges based on the edge models or deduction rules fro m a broader image conte xt and a knowledge database. Besides pattern matching and statistical analysis will occur at this level. The second level process tries to stripping the uncertainty or ma ke correct decisions using low level inputs and context. T he more appropriate the low-level input is, the more accurate the high-low-level process result will be achieved. To measure the quality of low -low-level process, various criteria a re proposed to help to improve the precision of edge detection.
IV. THE SOB EL EDGE DETECTION METHOD
The Sobel operators, for a 3*3 neighborhood, each simple central gradient rough calculation is the vector sum of a pair of orthogonal vectors. Every orthogonal vector is a directional derivative rough calculation multip lied by a un it vector specifying the derivative’s direction. The vector sum of these simple grad ients [24] estimates amounts to a vector sum of the 8 directional derivative vectors. Thus, for a point on Cartesian grid and its eight neighbors having density values as shown:
The directional derivative rough calculation vector G was defined such as density diffe rence distance to neighbor. This vector is determined such that the direction of G will be given by the unit vector to the estimated neighbor . The pay attention the neighbors group into antipodal pairs: (a,i), (b,h), (c ,g), (f,d). The vector sum of this gradient estimate is
Where, R = √2 , Th is vector is procured as
Here, this vector is mu ltip lied by 2 because of replacing the divide by 2.
The following we ighting functions for x and y components were acquired by using the above vector.
Now, we e xpla in that the dimension of the matrices is extended by using [24]. The definit ion of the gradient can be used for 5×5 neighborhood. In this case, twelve directional gradient must be determined instead of four gradients. The following figure 5×5 neighborhood.
The horizontal and vert ical masks are obtained by using the coefficients in this equation such as
Every direction of Sobel masks is applied to an image, then two new images are created. One image shows the vertical response and the other shows the horizontal response. Two images combined into a single image. The final cause is to determine the e xistence and location of edges in a picture [25]. This two image co mbination is e xpla ined that the square of creating masks pixe l estimate coincidence, each other as coordinate are summed. Thus a new image on which edge pixe ls are located procured the value which is the squared of the above summation. The va lue of threshold in this above process is used to detect edge pixels.
Pseudo Codes For Sobel Edge Detecti on
Input: Any Samp le Image. Output: Detected Edges.
Step 1: Concede the input image.
Step 2: Apply mask Gx,Gy to the input image.
Step 3: Apply Sobel edge detection algorith m and the gradient. Step 4: Masks man ipulation of Gx,Gy aside on the input image.
Step 5: Outco me co mbined to find the accomplished magnitude of the gradient. Step 6: The acco mplished magnitude is the output edges.
V. THE FUZZY S ETS AND FUZZY MEMB ERS HIP FUNCTION
The fuzzy logic was init iated in 1965 [26] by Lotfi A. Zadeh, professor of computer science at the University of Ca lifornia in Be rke ley. Basica lly, Fu zzy Logic is a mu ltivalued logic, that allo ws intermediate va lues [27] to be defined between conventional evaluations like true/false, yes/no, high/low, etc. [28]. No tions like rather tall or very intense can be formu lated mathe matica lly and processed by computers, consecutively to apply a more human -like way of thinking in the progra mming of co mputers. Fuzzy systems are a substitute to traditional notions of set me mbe rship and logic that has its origins in ancient Greek philosophy. The precision of mathematics owes its achievement in large part to the efforts of Aristotle and the philosophers who preceded him. In their effo rts to devise a concise theory of logic, and later mathe matics, the so-called ”La ws of Thought” were posited [29]. The ”La w of the Exc luded Middle,” states that every proposition must either be true or false. Fu zzy Logic has come out as an advantageous tool for the controlling and steering of systems and comple x industrial processes, as well as for household and entertainment electronics, as well as for other e xpert systems and classificat ion applications [30]. A fuzzy logic
Figure 1. The Type-1 Fuzzy Logic Syste m
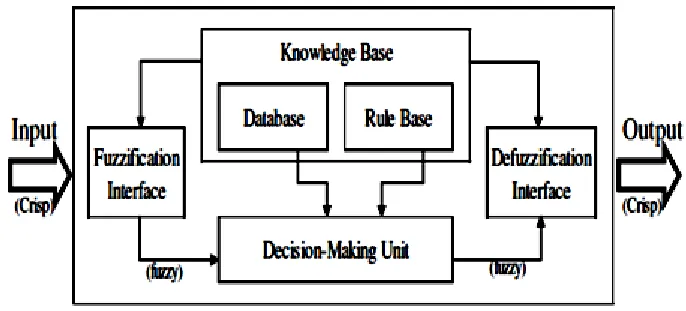
The me mbership functions are used in the fuzzification and defuzzification steps of a fuzzy logic system, to map th e non-fuzzy input values to fuzzy linguistic terms and vice versa. A membership function is used to quantify a linguistic term. Fuzzy infe rence is the process of formulat ing the mapping fro m a given input to an output using Fuzzy Logic. The mapping, then provides a basis from which decisions can be made, or patterns distinguished. The Fuzzy inference is the kernel in a fuzzy logic system. It has the capability of simu lating hu man fa isla [32] making based on fuzzy concepts. The process of fuzzy infe rence inv olves all of the pieces that are referred in the sections: me mbership functions, Fuzzy Logic operators, and If / Then rules. In a type-1 fuzzy logic system, the inference engine amalga mates rules and gives a mapping from input type-1 Fuzzy Sets to output type-1 Fuzzy Sets. Fuzzy inference systems are also known as fuzzy-ru le-based systems, fu zzy models or fu zzy controllers. A fu zzy in ference system is composed of five functional blocks [33] shown in figure 2.
1. A rule base includes a number of fu zzy If / Then ru les.
2. A database which defines the me mbe rship functions of the Fuzzy Sets used in the fuzzy ru les. 3. A dec ision-making unit wh ich carries out the inference operation of the rules.
4. A fuzzification interface which transforms the crisp inputs in to degrees of match with linguistic values. 5. A defu zzification interface wh ich transforms the fu zzy outcome of the inference into a crisp output.
In a type-1 Fuzzy Logic system an output processor as a single entity having the sole intend on producing c risp numbers using the defuzzifier, and is known as defuzzification [31]. A crisp output is obtained from a type -1 set. The Defu zzifie r performs the following functions.
Figure 2. The Fuzzy Infere nce Syste m
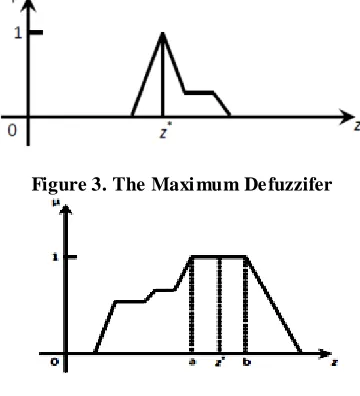
In addition to that the figure 3 Ma ximu m de fuzzifier Exa mines the Fuzzy Set B and select as its output the value of which is a ma ximu m. The ne xt figure 4 Mean of ma xima defuzzifier - Exa mines the Fuzzy Set B and first determines the values of µ for which it is a ma ximu m. It then computes the mean of these values as its output.
Figure 3. The Maxi mum De fuzzifer
Figure 4. The Mean of Maxi ma Defuzzifier
Eventually, figure 5 centroid defuzzifie r determines the center of gravity of the final fuzzy control space, and uses this value as the output. A Defuzzifie r produces a crisp output for our Fuzzy Logic system fro m the [31] output of the inference bloc k. The centroid defu zzifier is the most generally used methods.
Figure 5. The Centr ol d Defuzzifier
VI. THE FUZZY INFERENCE RUL ES
Three fu zzy sets are made up to characterize each variable intensities these sets are symbolized to the linguistic variables “lo w”, “med iu m” and “high”. By the defined fu zzy ru les, the output of this fuzzy system is classified into one of three classes. The output me mbership functions [34] a re shown in figure 6.
The fuzzy infe rence rules are applied to assign the three fuzzy sets characterized by me mbe rship functions µHigh,
µ
Medium, and µLow to the output set.The fuzzy inference ru les are defined in such a manner, and the rules are shown below.
1. IF (M is low) and ( hDV is low) and (HP is lo w) THEN (“ Edge” is low). 2. IF (M is low) and ( hDV is low) and (HP is mediu m) THEN (“Edge” is low). 3. IF (M is low) and ( hDV is low) and (HP is high) THEN (“Edge” is low). 4. IF (M is low) and ( hDV is med iu m) and (HP is low) THEN (“ Edge” is low). 5. IF (M is low) and ( hDV is med iu m) and (HP is mediu m) THEN (“Edge” is low). 6. IF (M is low) and ( hDV is med iu m) and (HP is high) THEN (“Edge” is med iu m). 7. IF (M is low) and ( hDV is high) and (HP is low) THEN (“Edge” is low).
8. IF (M is low) and ( hDV is high) and (HP is mediu m) THEN (“Edge” is high). 9. IF (M is low) and ( hDV is high) and (HP is high) THEN (“Edge” is high). 10. IF (M is med iu m) and ( hDV is low) and (HP is low) THEN (“Edge” is low). 11. IF (M is med iu m) and ( hDV is low) and (HP is med iu m) THEN (“ Edge” is lo w). 12. IF (M is med iu m) and ( hDV is low) and (HP is high) THEN (“Edge” is mediu m). 13. IF (M is med iu m) and ( hDV is mediu m) and (HP is lo w) THEN (“Edge” is mediu m). 14. IF (M is med iu m) and ( hDV is mediu m) and (HP is mediu m) THEN (“ Edge” is mediu m). 15. IF (M is med iu m) and ( hDV is mediu m) and (HP is high) THEN (“Edge” is high). 16. IF (M is med iu m) and ( hDV is high) and (HP is lo w) THEN (“Edge” is mediu m). 17. IF (M is med iu m) and ( hDV is high) and (HP is mediu m) THEN (“ Edge” is high). 18. IF (M is med iu m) and ( hDV is high) and (HP is high) THEN (“Edge” is high). 19. IF (M is high) and ( hDV is low) and (HP is low) THEN (“Edge” is low).
20. IF (M is high) and ( hDV is low) and (HP is med iu m) TH EN (“ Edge” is mediu m). 21. IF (M is high) and ( hDV is low) and (HP is high) THEN (“Edge” is mediu m). 22. IF (M is high) and ( hDV is mediu m) and (HP is lo w) THEN (“Edge” is mediu m). 23. IF (M is high) and ( hDV is mediu m) and (HP is mediu m) THEN (“Edge” is mediu m). 24. IF (M is high) and ( hDV is mediu m) and (HP is high) THEN (“Edge” is high). 25. IF (M is high) and ( hDV is high) and (HP is lo w) THEN (“Edge” is mediu m). 26. IF (M is high) and ( hDV is high) and (HP is mediu m) THEN (“Edge” is high). 27. IF (M is high) and ( hDV is high) and (HP is high) THEN (“Edge” is high).
VIII. THE PROPOS ED OPTIMAL VIEWPOINT
Table 1. The Range of Fuzzy Output Pi xel Set
Pseudo Codes For Fuzzy Rule Base d Syste m
Step 1: Transform the origina l image into a grayscale image Step 2: The gray- scaled image is scanned by 2 X 2 window mask.
Step 3: The 4-scanned pixe ls are taken as a crisp input for the Fuzzy inference system, to be transformed into linguistic variable, i.e. b lack and white, by using the triangular me mbe rship function.
Step 4: Fu zzy ru les are then enforced on fuzzy input to get fuzzy output someone as black, wh ite or edge. Step 5: Fu zzy output is defuzzyfied using the centroid method to get the intermediate output.
The Fuzzy Ru le Based System algorithm fo r circu mstance first is shown in a colored image is given as an input image and gives resultant image. The results of first circu mstance are shown in figure 7.
(a) (b)
Figure 7. (a) An Input Image (b) The Resultant Image After First Circumstance
The Fuzzy output bring back fro m the Fuzzy Inference System is considered as an input to Sobel method edge detection technique. Later enforce the steps pseudo codes for Sobel System, the fuzzy- Sobel output is generated and the result of the fuzzy- Sobel logic is as shown in figure 8.
Pseudo Codes For Sobel Syste m
Input: Intermediate Image fro m first circu mstances.
Output: Resultant fuzzy Sobel output image with edge detection.
Step 1: The gradient and direct ion of the intermediate output image are ca lculated.
Step 2: By applying non-ma ximu m suppression, emaciated edges are suppressed to get thin line. Step 3: Subsequently, using double thresholding fina l output image is acquire d.
(a) (b)
IX. RES ULTS PROCUR ED
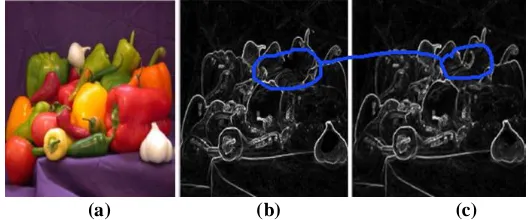
The proposed optimal standpoint is imple mented in Matlab and giv es imp roved results than the surpassing Sobel method. The figure9 to figure 10 show the outcome acquired by proposed an optima l point of vie w. In these figures, (a) is colored input image, (b) gives .
(a) (b) (c )
Figure 9. (a) Input image (b) Results By Sobel Me thod (c) Results by Opti mal Standpoint
Detected edges of input images using surpassing Sobel edge detection method and in the end, (c) show the resultant image after applicat ion of the optimal point of view. In figure (b) and figure (c ), the Blue colored bubble is shown, the same signalize the diffe rences between the results acquired by surpassing Sobel method and the proposed optimal point of view. Fro m v isual perceptions, figure (c) gives accurate and be more rectify results than the figure (b). The original image and the image acquired by using different thresholds. To min imize the point the t hreshold value is kept until 100. In case of threshold, single or double, we may acquire better outcome.
(a) (b) (c)
Figure 10. (a) Input i mage (b) Results By Sobel Method (c) Results by Opti mal Standpoint
X. CONCLUS ION
REFERENCES
[1] N. Ehsan, S. Sara and H. Hamid, "Edge Detection Techniques: Evaluations and Comparisons", Applied Mathematical Sciences, vol. 2, no. 31, pp. 1507 – 1520, 2008.
[2] G. Wenshuo, Y. Lei, Z. Xiaoguangand L. Huizhong, "An Improved Sobel Edge Detection", IEEE, 2010.
[3] G. M. and H.E., “Heuristic edge detection using fuzzy rule-based classifier,” Journal of Intelligent and Fuzzy Systems, Vol. 17, No. 5, pp. 457- 469, 2006.
[4] M. Zhao, A. M. N. Fu, and H. Yan, “A T echnique of Three-Level Thresholding Based on Probability Partition a Fuzzy 3-Partition”.IEEE T rans. on Fuzzy Systems, vol.9, no.3, pp. 469- 479, June 2001
[5] Abdallah A. Alshennawy, and Ayman A. Aly, “Edge Detection in Digital ImagesUsing Fuzzy Logic Technique”. World Academy of Science, Engineering and Technology 51, 2009.
[6] H. Farahanirad, J. Shanbehzadeh, M. M. Pedram, A.Sarrafzadeh, “A Hybrid Edge Detection Algorithm for Saltand-Pepper Noise”, Proceeding of the International MultiConference of Engineers and Computer Scientists 2011 Vol. I, IMECS 2011, Hong Kong, March 16-18, 2011
[7] Zhong-Ren wang Yang-Miung , a novel approach for edge detection based on the theory of electrostatic fild. Proceedings of International Symposium on Intelligent Signal Processing and Communication Systems Nov.28-Dec.1, Xiamen, China,2007.
[8] Lei Zhang, Mei Xiao, Jian Ma, Hongxun Song. Edge Detection by Adaptive Neuro-on Intelligent Information Technology Application. 978‐0‐7695‐3497‐ 8/08.00 © 2008 IEEE DOI 10.1109/IITA.2008.
[9] Hou, T. H. and Kuo, W.L.,. “ A New Edge Detection method for Automatic Visual Inspection”, International Journal of Advanc ed Manufacturing Technology, 13:407412 © Springer-Verlag London Limited, 1997.
[10] Gonzalez and Woods, Digital Image Processing, Third Edition, Pearson Education, 2008
[11] Wafa barkhoda, Fardin Akhlaqian Tab, Om-Kolsoom Shahryari, “ Fuzzy Edge Detection Based on Pixel’s Gradient and Standard Deviation Values”, Proceedings of the International Multiconference on Computer Science and Information T echnology, pp. 7 – 10, ISSN 1896-7094. [12] Abid, Sabeur, FarhatFnaiech, and Ezzeddine Ben Braiek. "A novel neural network approach for image edge detection," IEEE International Conference onElectrical Engineering and Software Applications (ICEESA), pp 1-6,2013.
[13] Fesharaki N. Mehdi, Hellestrand Graham R., “A New Edge Detection Algorithm based on Statistical Approach”, International Symposium on Speech, Image Processing and Neural Network, 13-16 April, Hong Kong, 1994.
[14] Wenshuo Gao, Lei Yang, Xiaoguang Zhang, Huizhong Liu, “An Improved Sobel Edge Detection”, IEEE, 978 -1-4244-5540-vol-9,2010. [15] JesalVasavada, ShamikT iwari, “An Edge Detection Method for Gray scale Images based on BP Feed forward Neural Network,” I nternational Journal of Computer Applications (0975 – 8887) Volume 67– No.2, 2013.
[16] Jing T ian, Weiyu Yu, and Shengli Xie, “An Ant Colony Optimization Algorithm for Image Edge Detection”, IEEE, 978 -1-4244-1823-vol-7, 2008.
[17] Qixiang, Ye, Wen, G., Weiqquiang, W. 2003. “A New T exture Insensitive Edge Detection Method”,Institute of Computing Technology, Chinese Academy of Sciences ,China, ICICS-PCM, Singapore, 15-18 Dec 2003.
[18] Caragea S. Fondater, Administrator and Chief Editor, IntelliProject, “Difference Edge Detect ion“, Licensed under IntelliProject open License, Romania, http://www.intelliproject.net , 2008.
[19] HamedMehrara , Mohammad Zahedinejad, “Quad-pixel edge detection using neural network,” Journal of Advances in Computer Research, pp.47-54,2011.
[20] Rital, S., Bretto A., Cherifi, H., Aboutajdine, D. 2002. “ A combinatorial edge detection Algorithm on Noisy images”, VIPromCom-, 4th EURASIP- IEEE Region 8 International Symposium on Video/image Processing and Multimedia Communications, Zadar, Croatia, 16-19 June 2002. [21] J.Canny,"A Computational Approach to Edge Detection", IEEE PAMI, VOL.8,NO.6, Novermber 1986.
[22]W.H.H.J.Lunscher and M.P.Beddoes, “ Optimal Edge Detector I: Parameter Selection and Noise Effects”, IEEE T rans. PAMI, VOL. 8, NO. 2, pp 164- 177, March 1986.
[23]Nadernejad E., Sharifzadeh S. and Hassanpour H., “Edge Detection Techniques: Evaluations and Comparisons”, Applied Mathematical Sciences, Vol. 2, No. 31, pp.1507-1520, 2008.
[24] SOBEL, I., An Isotropic 3×3 Gradient Operator, Machine Vision for Three – Dimensional Scenes, Freeman, H., Academic Pres, NY, 376 -379, 1990.
[25] Chunxi Ma, et.al.; “An improved Sobel algorithm based on median filter”, Institute of Electrical and Electronics Engineers, 2ndInternational IEEE conference, China, Volume: 1, pp. 88-93, Aug 1, 2010.
[26] L.A. Zadeh, Fuzzy Sets, Information and Control, 1965
[27] L.A. Zadeh, Outline of A New Approach to the Analysis of of Complex Systems and Decision Processes, 1973 [28] L.A. Zadeh, ”Fuzzy algorithms,” Info. & Ctl., Vol. 12, pp. 94-102, 1968.
[29] L.A. Zadeh, ”Making computers think like people,” IEEE. Spectrum, pp. 26-328/1984.
[30] S. Korner, ”Laws of thought,” Encyclopedia of Philosophy, Vol. 4, MacMillan, NY:, pp. 414-417, 1967. [31] J. Mendel. Fuzzy logic systems for engineering: a tutorial. Proceedings of the IEEE, 83(3):345 -377, Mar 1995.
[32] Begg, R & Marimuthu, P ., Computational Intelligence for Movement Sciences, Idea Group Publishing, Hershy, PA, 2006 [33] Karnik, N. & Mendel, J., Type-2 Fuzzy Logic Systems, IEEE Transactions on Fuzzy Systems. Vol7, No. 6, 1999.
[34] Wafa B., Fardin A. T., Om-Kolsoom S., Fuzzy Edge Detection Based on Pixel's Gradient and Standard Deviation Values. PROCEEDINGS OF THE IMCSIT. Volume 4, pp. 7-10, 2009.
BIOGRAPHY
![The European Council [Lisbon Summit 1992], Lisbon, 26-27 June 1992](data:image/gif;base64,R0lGODlhAQABAIAAAP///wAAACH5BAEAAAAALAAAAAABAAEAAAICRAEAOw==)