An Efficient Index for Ranking in Spatial
Database
S.Krishnaveni1, K.Sangeetha2
Assistant Professor, Dept. Of CSE, Apollo Engineering College, Chennai, Tamilnadu, India 1
Assistant Professor, Dept. Of CSE, Apollo Engineering College, Chennai, Tamilnadu, India 2
ABSTRACT: In reality spatial objects (e.g., Dams) not only have spatial locations but also have quality attributes (e.g., height, reservoir capacity).Given a spatial location S, Quality vector ψ and a set of spatial objects D, a spatial query which retrieves and ranks the objects that intersect the region S and satisfies the quality vector. Based on the inverted index and the linear quad tree, we propose a novel index structure, called inverted linear quad tree (IL-Quad tree), which is carefully designed to exploit both spatial and keyword based pruning techniques to effectively reduce the search space which performs 1) spatial filtering ,2) textual filtering and 3) object ranking in a fully integrated manner. The inverted quad tree is compared with the R tree, SKR tree.
KEYWORDS: IL- quadtree,R-tree, SKR-tree ,Query Processing, Spatial database.
. I. INTRODUCTION
Spatial database systems manage large collections of geographic entities, which apart from spatial attributes contain non spatial information. Spatial objects in reality are associated with multiple quality attributes in addition to their spatial locations. Traditional spatial queries and joins focus on manipulating only spatial locations and distances, but they ignore the importance of quality attributes. The dominance comparison is suitable for comparing two objects with respect to multiple quality attributes. For the sake of simplicity, we assume that the domain of each quality attribute is fully ordered (e.g., integer domain). An object A is said to dominate another object B, if A is no worse than B for all quality attributes and A is better than B for at least one quality attribute. In this system, we study an interesting type of spatial queries, which select the best spatial location with respect to the quality of facilities in its spatial neighbourhood. Given a set D of interesting objects (e.g., candidate locations) and quality vector, a top-k s p a t i a l preference queries retrieves the k objects in D with the highest scores. The score of an object is defined by the quality of features (e.g., facilities or services) in its spatial neighbourhood. As a motivating example, consider a database containing all information of dams. Here “feature” refers to specific facilities or services. A customer may want to rank the contents of this database with respect to the quality of their locations, quantified by aggregating non spatial characteristics of other features (e.g., height of dam, reservoir capacity etc.,) .
In Fig.1a, a simple score instance, called the range score, binds the neighborhood region to a circular region at p with radius (shown as a circle), and the aggregate function to SUM. For example, the maximum quality of p1(dam1) are 0.9 and 0.6. Hence the τ(p1) is 0.9+0.6=1.5.Similarly for the dam p2, τ(p2) is 1.0+0.1=1.1.Hence the dam p1 is returned as top result. Fig.1b shows a dam p5 and three features s1, s2, s3 (with their quality values). The circles have their radii as multiples of τ Now, the score of si is computed by multiplying its quality with the weight 2^-j, where j is the order of the smallest circle containing si.[1]
Traditionally, there are two basic ways for ranking objects: 1) spatial ranking, which orders the objects according to their distance from a reference point, and 2) non spatial ranking, which orders the objects by an aggregate function on their non spatial values. The top-k spatial preference query integrates these two types of ranking in an intuitive way.
II. PROBLEM STATEMENT
Let c be the number of (numeric) quality attributes.Each object p in the object dataset D is composed of a set of quality attributes c, and is associated with a location Lp. A quality vector is a point ψ in the c -dimensional space where each dimension refers to a quality attribute. As a shorthand notation, we use ψ[i] to represent the ith (quality) attribute value of ψ. The notion of dominance is used to compare quality vectors. A quality vector ψ is said to dominate another one ψ’ (denoted as ψ<ψ’), if
∃1≤ ≤ ,ψ[i] is better than ψ’[i] and ∀1≤ ≤ ,is not worse than ψ’[i].
A location is a pair (x, y) in the Euclidean space, where x and y are the coordinates values. A spatial object p=<loc,ψ> consists of both a location o.loc and a quality vector o.ψ. The notation dist (p, p’) denotes the Euclidean distance between the locations of the spatial objects p and p’. Given two spatial objects p and p’ is said to be a dominator of p’ when p.ψ<p’.ψ. Given a query q that specifies a set of query keywords Wq a query spatial scope Sq, textual relevance and spatial relevance of object p to q are formalized in definitions 1 and 2, respectively.
.
Definition 1 (Textual relevance). An object p is said to be textually relevant to a query if o contains queried keywords i.e., Wp∩Wq≠0. To quantify the relevance of pto q, a weighting function denoted by τq(o) is adopted. Thus for a given q, τq(p1) > τq(p2) means object p1 is more textually relevant to q than object p2.
Definition 2( Spatial relevance). An object o is said to spatially relevant to a query q if the location of object o overlays with the query spatial scope of q, i.e., Lp∩Sq≠0. Let τq(o) be a scoring function to quantify the spatial relevance of o to q. Thus for a given q, τq(p1) > τq(p2) means object p1 is more spatially relevant to q than object p2.
Accordingly, k objects are retrieved from D objects that are both textually and spatially relevant to a given query and ranks objects based on the quality features of their objects.
The spatial relevance of an object p, denoted as τ(p) depends on the types of the spatial relationships defined between an object location Lq. and a spatial scope S. Commonly adopted relationships include
1. Enclosed. τ(p) is set to 1 if the corresponding location is fully enclosed by the query scope, i.e.,
( ) = 1, ⊆ 0, ℎ
2. Overlapping. τ(p) is set to the fraction of the object location that is covered by the spatial scope,.
( ) = ( ⊆ )
( )
( ) = ( , ), ⊆
0, ℎ
Fig.2. Example of Farthest dominated location
Loc NN ND
S1 h3 h3
S2 h4 h3
S3 h4 h5
S4 h6 h5
(a)
(b)
Fig.3..Lists of dams and candidate locations, (a) Qualities of dams, (b) Candidate location at ψ(200,4)
Definition 3 ( Nearest dominator, Nearest Dominator Distance). Given a location S .its quality vector ψ, and a set of spatial objects D, the nearest dominator of S in D is defined as
ND(S,ψ,D)= argmin dist(S,p) pεD,p.τ<ψ
i.e., the nearest neighbor of S in D among those that dominate ψ. The nearest dominator distance ndd(S,ψ,D)=dist(S,ND(S,ψ,D)). Refer to the example in Fig 2 and 3, the ND of S is the dam hj that minimizes the dist(Sj,hj) value, among those dams dominating the design competence ψ.In Fig 2.b. lists the NN and ND of each location Sj. It is important to note that NN is not necessarily the same as ND. For example, the NN of S2 is h4 which, however, does not dominate S2 with respect to its design competence. Whereas its next nearest neighbour h3 does, which exactly is S2’s ND. By considering the distance of each location Sj from its ND, we pick the largest one(i.e., dist(S3,h5)), and take its location(i.e., S3) as the result location for building the new dam.
Definition 4 (Farthest Dominated Location Query)
Given a set of (competitors’) spatial objects D, a set of (candidate)locations L, and a quality vector ψ as the design competence, the farthest dominated location query returns from L a location S such that the distance ndd(S,ψ,D) is maximized, i.e.,
∀ ′∈ , ( , , )≥ ( ′, , )
Dams Height m Reservoir capacity
h 1 180 4
h 2 150 3
h 3 190 4
h 4 250 3
h 5 190 4
III SPATIAL QUERY EVALUATION ON R TREE
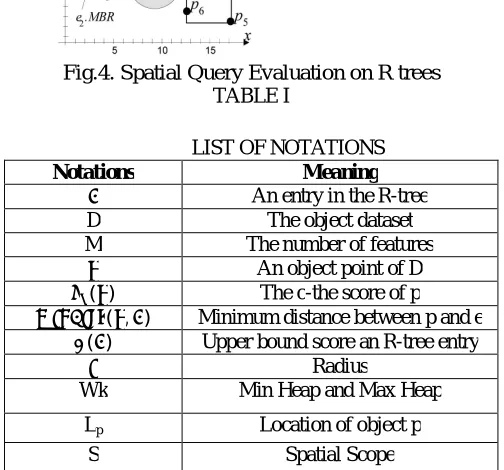
The most popular spatial access method is the R-tree [3], which indexes minimum bounding rectangles(MBRs) of objects. Fig.4 shows a set D{p1,p2..p8} of spatial objects (e.g., points) and an R-tree that indexes them. R-trees can efficiently process main spatial query types, including spatial range queries, nearest neighbour queries, and spatial joins. Given a spatial region S, a spatial range query retrieves from D the objects that t intersect,
Fig.4. Spatial Query Evaluation on R trees TABLE I
LIST OF NOTATIONS Notations Meaning
An entry in the R-tree
D The object dataset
M The number of features
An object point of D
( ) The c-the score of p
( , ) Minimum distance between p and e
( ) Upper bound score an R-tree entry Radius
Wk Min Heap and Max Heap
Lp Location of object p
S Spatial Scope
For instance, consider a range query that asks for all objects within the shaded area in Fig.4 Starting from the root of the tree, the query is processed by recursively following entries, having MBRs that intersect the query region.For instance, e1 does not intersect the query region, thus the sub tree pointed by e1 cannot contain any query result. In contrast, e2 is followed by the algorithm and the points in the corresponding node are examined recursively to find the query result p7.
The upper bound score of an object is calculated using the formula
( ) = ( ) , ( ) , 1, ℎ .
IV SPATIAL QUERY EVALUATION ON SKR TREE
hand, {p7, p8, p9, and p10} although being textually relevant to the query, are not within “Boston.” The top-3 dams in the candidate set that are most relevant are returned.
Entire Geographical space
p8
p3 p4
p2 p5
p6 p1
p9 p7 p10
No pollution control and irrigation only irrigation
Pollution control and irrigation only pollution control
For this we proposed an efficient indexing scheme called SKR tree which indexes both the textual and spatial contents of objects to support data retrievals based on their combined textual and spatial relevance’s, which, in turn, can be adjusted with different relative weights. Fig.6. Shows the structure of SKR tree where each node has both spatial and non spatial information of the data object. No is the Root node which has two child nodes N1 and N2. The child node has the keyword AN1, and spatial data DN1 .This indexing scheme performs textual filtering and spatial filtering and hence it is efficient when compared with the R tree indexing scheme.
Fig.6. Structure of SKR tree
V SPATIAL QUERY EVALUATION ON IL-QUAD TREE
IL-Quadtree. In the paper, for each keyword ti ∈ V we build a linear quadtree, denoted by LQi, for the objects which contain the keyword ti. Besides the black leaf nodes, we also explicitly keep the quadtree structure, which serves as the signature of the objects in LQi, which can be easily fit into the main memory. More specifically, a bit is kept for each node of the quadtree, which is set to 1 for black leaf nodes and non-leaf nodes and 0 otherwise.
Obviously, a node in LQi is empty (i.e., it does not contain any object with keyword ti) if the bit is set to 0 Fig. 7 illustrates the linear quadtrees LQ1 and LQ2 constructed for keywords t1 and t2 respectively.
reach the maximal depth w which is the pre-determined maximal partition level. As to the deletion, an object o will be removed from its corresponding linear quadtrees. Meanwhile, some of the cells may be merged due to the deletion. For the effectiveness of the signatures, we enforce that all objects are pushed to the black leaf node below the level w_ (minimal partition level) because a black leaf node at high level may impair the pruning capability.
Fig.7. Structure of IL-Quad tree
VI. ALGORITHMS FOR SPATIAL PREFERENCE QUERY
A. Range Score Algorithm
Given a set of objects, the range score algorithm calculates the Nearest neighbour distance and ranks the objects.[4].
Input: A set of data D, query location , Root of R tree and the radius ε .
Output: Top k data with shortest distance Procedure:
1: Group_Range(Node N ) 2: for each entry e N do 3: If N is nonleaf then
4: read the child node N I pointed by e; 5: Group_Range(N I );
6: else
7: for each p V such that dist
( , )
≤
then 8: update Wk by e;B. Branch and Bound Algorithm
Branch and bound algorithm which calculates the score and ranks the objects based on the non spatial quality features of the objects.
Input: A set of data D and Query location and root of R tree Output: Top k data with the highest score.
Procedure:
1: Cal_Score(Node N ) 2: for each entry e N do 3: If N is nonleaf then
4: read the child node N I pointed by e; 5: Cal_Score(N I );
6:else
8: for c:= 1 to m do
9: compute
( )
for all∈
concurrently; 10:update Wk by eC. SKR Tree Construction Algorithm Input: Set of Objects D
Output: Root of SKR tree Procedure:
1: Ne←0
2: For each p D do
3: geocode p and represent Lp with MBB mp
4: if for some e€Ne, me=mp then
5: add p to e’s dataset De;
6: else
7: create a new entry e; 8: set me←mp and De←{p};
9: Ne←NeU{e};
10: End if 11: End for
12: For each e€Ne do
13: While 1Ne1> nmax do
14: Cluster the data according to min/max into nodes 15: Ne←Ne’
16: End while
17: Create the root node to cover Ne and their data summary
D. SPATIAL KEYWORD RANKING algorithm
Input : aLQ : the aggregate IL-Quadtree,
k : number of objects returned, q : the query
Output : R : k objects with highest scores
1 R := ∅; H = ∅;
2 Push root node of the virtual quadtree Q into H ;
3 while H _= ∅ do
4 e ← the tuple popped from H ;
5 if e is an object then
6 R := R ∪ e ;
7 Terminate the Loop if |R| = k ;
8 else
9 if e is not a leaf node then
10 for each child entry edo
11. Compute f(e, q);
12 Push e into H ;
13 else
14 C := ∅ ;
15 for each quadtree aLQi where i ∈ I(q.T ) do
16 e← the black
17 leaf node in aLQi with seq(e_) ⊆ seq(e) ;
C := C∪ objects in e;
18 for each object o ∈ C do
19 Compute f(o, q) and push it to H ;
VI. RESULT AND DISCUSSION
In this section, we conduct experiments on real object and feature data sets in order to demonstrate the application of top-k spatial preference queries. We obtained real spatial data from http://www.fao.org/nr/water/aquastat/gis/index2.stm location in these data sets correspond to (longitude and latitude) coordinates in Africa and Middle East countries.
This Spatial dataset containing information about dams in South Africa and middle east countries which has several features like irrigation, water supply, flood control, Hydro electricity, navigation , recreation, pollution control, livestock rearing and others. We used SQL server 2008 for spatial database design. Spatial query visualiser to visualize the spatial query and spatial up loader to upload the shape files of Africa and Middle East countries. The proposed indexing scheme is evaluated with the R tree and SKR tree
.
.(a)Time Vs k (b)I/O Vs k
Fig:8
VI.CONCLUSION
In this paper, we studied top-k spatial preference queries, which provide a novel type of ranking for spatial objects based on qualities of features in their neighbourhood. Given a spatial location S, Quality vector ψ and a set of spatial objects D, a spatial query which retrieves and ranks the objects that intersect the region S and satisfies the quality vector. We proposed an efficient index called IL-Quad tree and algorithms which performs 1) spatial filtering, 2) textual filtering and 3) object ranking in a fully integrated manner.
In the future, we will study the top-k spatial preference query on a road network, in which the distance between two points is defined by their shortest path distance rather than their euclidean distance. The challenge is to develop alternative methods for computing the upper bound scores for a group of points on a road network.
REFERENCES
[1]. M.L.Yiu, X.Dai, N. Mamoulis, and M. Vaitis, “Top k Spatial Preference Queries,” Proc. IEEE Int’l Conf. Data Eng. (ICDE),2007. [2]. Man Lung Yiu, Hua Lu, Nikos Mamoulis, and Michail Vaitis “Ranking spatial data by quality preferences” IEEE Trans.on Data Eng. March
2011.
[3]. A.Guttman, “R-Trees: A Dynamic Index Structure for Spatial Searching,” Proc. ACM SIGMOD, 1984.
[4]. Y. Chen and J.M. Patel, “Efficient Evaluation of All-Nearest-Neighbor Queries,” Proc. IEEE Int’l Conf. Data Eng. (ICDE), 2007.
[5]. N. Mamoulis, M.L. Yiu, K.H. Cheng, and D.W. Cheung, “Efficient Top-k Aggregation of Ranked Inputs,” ACM Trans. Database Systems, vol. 32, no. 3, p. 19, 2007.
[6]. David Noack, “Spatial variation in search engine Results”,Int’l conf on system sciences-2010.
[7]. Zhicheng Li, Hu Xu, Yansheng Lu, Ailing Qian“Aggregate Nearest Keyword Search in Spatial Databases “Int’l Asia specific web conf. 2010. [8]. Ramond T.Ng,Jiawei han,”Effective and efficient clustering in spatial datamining”,proceedings of 20th VLDB conf,santiago,chile.
0 5 10 15 20
10 20 30 40 50
R tree
SKR tree
IL-Quad tree
0 2 4 6
10 20 30 40
R tree