Optimal Location and Capacity of Distributed
Generation for Multi-objective Function using
Bat Algorithm
Ram Prakash1, B.C. Sujatha2
PG Student [PES], Dept. of EE, University Visvesvaraya College of Engineering, Bengaluru, Karnataka, India1
Associate Professor, Dept. of EE, University Visvesvaraya College of Engineering, Bengaluru, Karnataka, India2
ABSTRACT:In recent days, Distribution Generation (DG) technology is one of the leading areas of research in the
world. For rapid growing demand of power and clean source of energy DGs can be a potential solution. Many factor affecting DG allocations are availability of natural resources, types of DG technologies, types of distribution system, size and number of DG units. Distribution Generations can be beneficial in many ways when integrated into a distribution network, depending upon their location and size. This paper presents Bat Algorithm (BA) to exploit the benefits of DG by selecting optimal location and size of DGs in the distribution network. The multi-objective function (MOF) considered in this work is to minimize the total real power (Ploss) losses and maximize voltage stability index
(VSI), within the range of voltage constraint. The Bat Algorithm with varying loudness and pulse rate is coded in matlab to find the optimal location and capacity of DGs. Two case studies are performed on IEEE 69 bus distribution system considering the capability of DG to generate real power and reactive power. The proposed algorithm is tested with single as well as multiple DGs. The effectiveness of proposed method is validated by comparing the results with that obtained from standard particle swarm optimization (PSO). The simulation result shows that Bat Algorithm gives better results in terms of quality and variance.
KEYWORDS: Distribution Generation (DG), Power losses, voltage stability index (VSI), Particle Swarm
Optimization (PSO), Bat Algorithm (BA).
I.INTRODUCTION
Distributed Generation is also known as dispersed generation or embedded generation or decentralized generation. Overall, we can define DG [1] as the power generation from renewable source or low carbon emission source directly into the distribution system. DGs are generally classified on the basis of fuel used, renewable and non-renewable energy sources, capacity of generation, electric output etc. There are three types [2] of DG based on electrical power output and classified as, asynchronous generators, synchronous generators and induction generators based DG technologies. On the basis of capacity of generation, it is micro (1 Watt to 5 kW), small (5 kW to 5MW) medium (5 MW to 50 MW) and large (50 MW to 300MW).
There are several benefits of implementing Distributed Generation which leads to increasing interest [3] in it. These are listed below:
Growing technology and innovation in power electronic devices that has reduced the size and cost of DGs. Transmission losses are zero and a significant reduction in distribution losses.
These are based on renewable energy or low carbon sources which are environmental friendly. Site requirement is small. Duration of installation and market risks are also low.
Reduction in peak demand and thereby reduction in cost of infrastructure development of transmission and distribution systems.
Voltage support and improved power quality results in reliable supply of power.
The concept of DG is older one. With the invention of diesel generators and batteries, some customers were using it as backup power sources. Recent development in technology has made DG very popular. Three decades ago the main focus of the research was only limited to power loss reduction [4]. But the increasing use of devices like drives, power electronics, computers, and other energy efficient devices focus are shifting on power quality issues. In radial distribution system the voltage fluctuation is very common and at peak load it may results in voltage collapsed.
Considering the growing power quality issues more researches are focus on multi-objective function [5] i.e. simultaneously considering several power quality issues, power loss, voltage profile of critical buses, cost reduction, improving the reliability [6] of the system etc. Thus, a number of algorithm were developed to solve these multi-objective function to find optimal position and capacity of DGs like Genetic Algorithm [7], Particle Swarm Optimization (PSO) [8], ant colony [9], analytical methods [10], simulated annealing [11] etc. which shows improving results but has some limitations. To overcome these limitations several algorithms are modified to arrive at improved results. The nature inspired algorithm is seen very promising in solving these complex problems. Hence, a number of such algorithms ware developed like PSO [8], Artificial Bee Colony [12], Cuckoo Search algorithm [13], Bat Inspired Algorithm etc. In this paper Bat Algorithm is proposed and result is compared with standard PSO algorithm. An IEEE 69 bus test system is taken to implement the multi-objective problem.
II.PROBLEM FORMULATION BASED ON MULTIOBJECTIVE
For the performance analysis of distribution network to have optimal DG placement and size a multi-objective function is proposed in this paper. The multi-objection function (MOF) considered is the total active power loss minimization and VSI maximization. The MOF is proposed by giving a weight to each index. Weight method is used to give importance to one function with respect to other. This multi-objective function is mathematically expressed as:
min f = a1f1 + a2f2 (1)
( ) = 1 and 0 < < 1 (2)
Where f1 is the total real power losses and f2 is voltage stability index. Weighting factors are represented by a1 and a2
and assigned a value as given by eq. (2). The weight functions normalize the functions and transform their impact in term of single unit. In this analysis higher weight is given to total real power losses (0.6) compare to VSI (0.4).
A. POWER LOSSES
Total real power loss minimization is included by index f1, where f1 is the ratio of Ploss with DG and Ploss without DG.
PLDG is total real power losses after the DG connection and PL is the total real power losses before DG connection, and
Im is the magnitude of current, obtained from load flow analysis and Rm represents the resistance.
f1 = PL(DG) /PL (3)
PL(DG) = ∑Nm=1I2mRm (4)
B. VOLTAGE STABLITY INDEX
In radial distribution system bus voltage decreases gradually as we move away from the substation. The buses which are near the end of radial distribution network experience the maximum voltage drop and subject to higher critical conditions. Thus, to identify the critical buses, an index called VSI is proposed by Charkravorty and Das [14].
= −
( )− ( ) = ∗ (6)
( ) = | | −4[ ( ) + ( ) ]| |
−4[ (ri) − (ri) ] (7)
= 1
min(VSI(ri)) = 2,3, … . , (8)
This VSI is modified for improving value and included in MOF using eq. (8). Stable range operation of distribution system is given by, VSI(ri) > 0 for i = 2, 3,…., r. Hence, a feasible solution is existed. VSI value approaching to 1, show a stable system and the bus with lower VSI value corresponds to voltage instability and considered as weak buses.
C. CONSTRAINTS
DG integration into the distributed grid cause reverse flow of power. This regular power delivered by DG source cause voltage rise. Capacity of DGs depends upon many factors. Hence, a limit on system voltage is assigned by eq. (9), Where |Vi|, denote the voltage magnitude at ith node and the limits for Vmini is taken as 0.95 pu and Vmaxi is 1.05 pu. In
this simulation DG has assigned discrete values with an increment of 100 kW. Active and reactive power limits of DG are considered in eq. (10) and eq. (11) respectively.
| | ≤| |≤| | (9)
≤ ≤ ; 0≤ ≤5MW (10)
≤ ≤ ; 0≤ ≤1Mvar (11)
III.CASE STUDY
Generally, there are three types of DGs based on electrical output as; synchronous, asynchronous and induction generator [15]. In this simulation two types of DG technologies are considered for the analysis. First types of DGs are asynchronous based DG technologies. They are capable of delivering only active power. Power electronic interface is required for grid connection of these DGs. Second types of DGs are synchronous based generator. They are capable of delivering both real and reactive power. Hence, based on above two types of DG, there are two cases
Case 1: Optimal sitting and sizing of asynchronous based DGs. Examples are photovoltaic cells, micro-turbines and fuel cells.
Case 2: Optimal sitting and sizing of synchronous based DGs such as combustion turbines, cogeneration and small hydro-turbines.
Case 2 DGs are assigned 0.98 (lagging) power factors for analysis and reactive power is calculated by eq. (12). Both the cases are simulated with one DG as well as two DG unit for optimal sitting and size.
= ∗ (12)
IV.BAT-INSPIRED ALGORITHM
algorithm is a recent algorithm, inspired by nature. It was proposed in 2010 by Xin-She Yang [15]. This algorithm exploits the echolocation behavior of the bats. Micro-bat is one species of bat which uses the echolocation frequently. Bats use sonar or ultrasonic echoes to detect prey, find object and avoid obstacles. The emitted ultrasonic wave when hit an object, gives back an echo. This time delay of emitted and echo signal is sensed by bats to locate the prey and their size. As soon as bat finds its prey it reduces its loudness and increases the pulse rate emission. Idealized rules which are to be followed during the use of bat algorithm are as follows:
Echolocation is used by all bats to sense obstacles and differentiate between food and barriers.
All bats have random velocity (Vi) at position Xi and having fixed frequency at fmin, with changing loudness (A0)
and wavelength (λ). They automatically adjust their wavelength and pulse rate (r) emission depending upon the nearness to prey.
There are different ways of varying loudness. Here we assume that itvaries from a very high value A0 to a fixed
minimum constant value Amin.
Based on the above idealization Bat Algorithm [16] can be explained and formulated as:
Step1. Population
Initial population of Bats is chosen randomly in search space to find optimum position and size of DG. Bats population in the range 10 to 40 is considered as good. Objective function defines the fitness of the bats and is updated based on changing movement, pulse rate and loudness.
Step2. Movement of bats
New solution is generated by changing position, frequency and velocity of bats in search spaces as given by eq. (13) to eq. (15). Where xit, and vit, define the recent position and velocity of ith bat where as x* is the recent global best (gbest) position.
fi = fmin + (fmax – fmin) * rand (13)
vit = vit – 1 + (xit – x*) (14)
xit = xit – 1 + vit (15)
Step3. Local search by random walk
Randomly select a solution among the best solutions. As soon as a solution is selected, a random walk is used to generate a new solution locally for all bats using eq. (16). Where ε a random number between [-1, 1] and At is the average of loudness of all the bats at current iteration.
xnew = xold+ ε At (16)
Step4. The pulse emission and loudness
As the bat found its prey it updates its loudness and pulse rate emission. Generally, loudness decrease and pulse emission rate increases. The loudness and rate of pulse emission is updated using eq. (17) and eq. (18). In this simulation the constant α andγ values considered as α = γ = 0.9.
Ait+1= α Ait (17)
rit+1 = ri0 [1 – exp(-γt)] (18)
Step5.Optimal solution
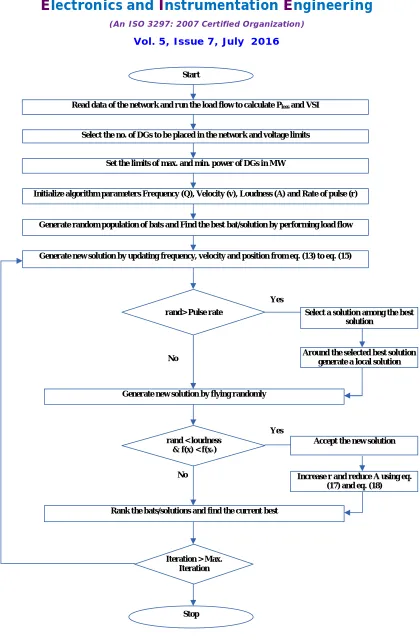
Fig. 1. Flow chart for finding the optimal sitting and size of DGs using Bat Algorithm
Read data of the network and run the load flow to calculate Ploss and VSI
Select the no. of DGs to be placed in the network and voltage limits
Set the limits of max. and min. power of DGs in MW
Initialize algorithm parameters Frequency (Q), Velocity (v), Loudness (A) and Rate of pulse (r)
Generate random population of bats and Find the best bat/solution by performing load flow
Generate new solution by updating frequency, velocity and position from eq. (13) to eq. (15)
rand> Pulse rate Select a solution among the best
solution
Around the selected best solution generate a local solution
Generate new solution by flying randomly
rand < loudness & f(x) < f(x*)
Accept the new solution
Increase r and reduce A using eq. (17) and eq. (18)
Rank the bats/solutions and find the current best
Iteration > Max. Iteration
Stop No
Yes
Yes
A. Optimal sitting and size of DGs using Bat Algorithm
In this section the complete procedure of Bat Algorithm to find the optimal location and size of DGs for minimization of multi-objective function is explained. Fig. 1 shows the complete steps of the optimization algorithm.
Load flow analysis is carried out by Newton Raphson method and total real power losses and VSI is calculated. In the simulation number of population is taken as 20, maximum and minimum limits of parameters are; loudness [2, 0], frequency [0, 4] and pulse rate [0, 1]. Initially the random number of bat and size of DG are considered within the range. Load flow is used to evaluate the multi-objective function and all the parameters of algorithm are updated. Select the minimum multi-objective function as current best and adjust the loudness and pulse rate to find new solution. Repeat the updating of equation (13) to equation (15) till the maximum iteration i.e. 100 is reached. Select the best multi-objective function and corresponding sitting and size will be the optimum location and capacity respectively. While iteration is less than maximum iteration, the following steps are performed:
1) Generate new solution by varying frequency, velocity and position. Bat will try to search improved MOF.
2) If pulse rate is less than random number i.e. values between 0 and 1, a solution is selected and a new solution is generated around it. Again bat will search for new sit and size of DG.
3) If loudness is greater than one and current best frequency (f(x*)) is more than existing frequency then accept new
solution and decrease loudness and increase pulse rate using eq. (17) and eq. (18) respectively.
4) When maximum iteration is reach terminate the program. Select the best solution among the given solution and corresponding values will give the optimal sitting and size of DGs.
Finally, the multi-objective function value, loss reduction, VSI and voltage are compared with base case.
V.SIMULATION RESULTS AND ANALYSIS
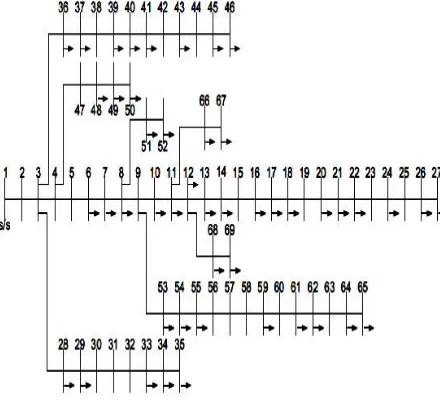
In this analysis IEEE 69 bus radial distribution system without DG is considered as base case as shown in Fig. 2. It is assumed that substation deliver power to all the buses. The proposed Bat Algorithm is simulated in matlab for both the cases discussed above with one and two DG.
A. IEEE 69 BUS RADIAL DISTRIBUTION SYSTEM
IEEE 69 bus radial system has total load of 3.802 MW and 2.694 Mvar. The base value used in simulation is 1 MVA and 12.66kV as illustrated in Fig. 2. DGs can be located anywhere from bus 2 to 69 depending on MOF values. Total real power losses and VSI are found to be 0.225 MW and 0.6880 respectively before installation of DGs.
Fig. 2. IEEE 69 bus distribution test system [17].
TABLE I
COMPARISION OF RESULT FOR CASE 1 BY BOTH ALGORITHM
No. of DG
Algo-rithm
Bus No.
DG Size (MW)
Ploss
(MW)
Ploss
Reduc-tion (%)
Min VSI
1 BA 61 1.9 0.0832 63.02 0.8798
PSO 61 1.9 0.0832 63.02 0.8798
2 BA 61, 16 2, 0.6 0.0737 67.24 0.9036
PSO 61, 17 2, 0.8 0.0757 66.35 0.9002
TABLE II
COMPARISION OF RESULT FOR CASE 2 BY BOTH ALGORITHM
No. of DG
Algo-rithm
Bus No.
DG Size (MW)
Ploss
(MW) Ploss
Reduc-tion (%)
Min VSI
1 BA 61 2.1 0.0525 76.67 0.8896
PSO 61 2.1 0.0525 76.67 0.8896
2 BA 61, 17 2, 0.7 0.0394 82.48 0.9617
B. SIMULATED RESULTS
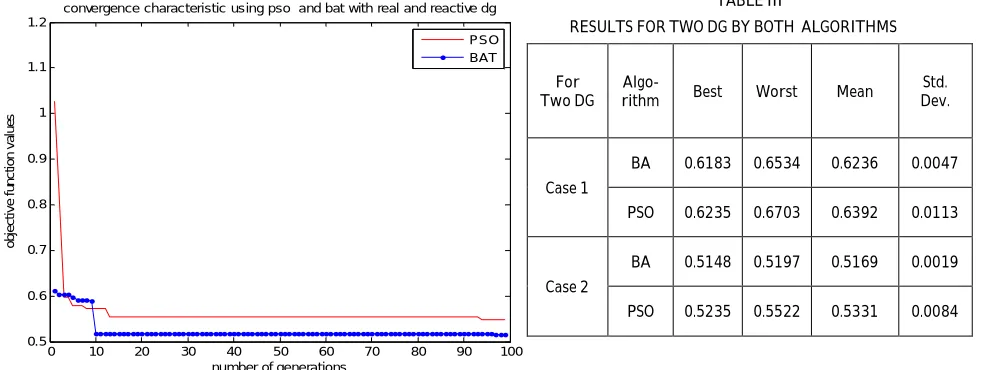
To verify the efficiency of proposed Bat Algorithm it is compared with standard particle swarm optimization algorithm. In this simulation PSO algorithm’s parameters are taken as: inertia weight (w) = 0.9, cognitive factor (c1) = 2.3and social behavior component (c2) = 2.1. The generated output of all the cases with both the optimization algorithms are tabulated in Table I and Table II. Results for optimal sitting and sizing of one DG in both the cases show that, Bat Algorithm and PSO are in close agreement. For two DG in cases the simulation results varies for multiple runs. Thus, the results of two DG cases are corresponding to the best MOF over 20 multiple run of algorithm and min VSI is the minimum value of VSI, among all multiple runs in that case. A simulated result with two DG varies, but clearly shows that Bat Algorithm provides better solution than that of PSO. Fig. 3 and Fig. 4 gives the voltage stability index and voltage profile of IEEE 69 bus radial systems for Case 2 with two DG. It clearly illustrates that after installation of DGs VSI and voltage profile improves significantly using both the algorithms. However, Bat Algorithm gives comparatively better VSI and voltage profile than PSO. Before installation of DGs VSI was poor and voltage at some buses are lower than minimum voltage limits i.e 0.95 pu. Fig. 5 represents the convergence characteristic of both the algorithms for two DG in case 2. From generated outputs it is observed that BA takes less number of iterations converge. Whereas PSO takes more number iterations and may trapped in local minima. Both BA and PSO algorithms are very effective in reducing power losses and improving VSI but, Bat Algorithm outperforms the PSO algorithm.
C. OUTPUT VARIENCE
For two DG in both the Case 1 and Case 2 gives different simulation result for multiple runs. The Table III compares the best, worst, mean and standard deviation values of MOF over 20 multiple runs. In case 2 the standard deviation of PSO is 0.0084 and that of Bat Algorithm is 0.0019 i.e. nearly zero. Table III implies that the standard deviation of BA is better than PSO. This indicates the output uniformity of proposed Bat Algorithm. Above analysis clearly implies that Bat Algorithm provides high quality solutions and it will be preferred over PSO algorithm.
Fig. 3. VSI for Case 2 with two DG Fig. 4. Voltage profile for Case 2 with two DG
0 10 20 30 40 50 60 70
0.65 0.7 0.75 0.8 0.85 0.9 0.95 1 1.05
voltage stability index
bus numbers
v
s
i
BASE CASE PSO BA
0 10 20 30 40 50 60 70
0.9 0.92 0.94 0.96 0.98 1 1.02
voltage profile
bus numbers
v
o
lt
a
g
e
p
ro
fi
le
Fig. 5. Convergence characteristic of algorithms for Case 2 with two DG
VI.CONCLUSION
In this paper multi-objective function is implemented for optimal position and capacity of DGs by Bat and PSO algorithms. An IEEE 69 bus distribution system is taken as test system and it is found that both algorithm gives better result compare to base cases. But, the BA gives better result than PSO in terms of quality and variance. Simulation results of Case I and Case II illustrates that Type2 DG i.e. DGs supplying both real and reactive power gives better solution in terms of real power loss and VSI. Convergence graph shows that PSO may give premature solution while parameter of Bat Algorithm can be adjustable to find better solution, but a robust study is required.
REFERENCES
[1] Thomas Ackermann, Göran Anderson, Lennart Söder, “Distributed generation: a definition, Electric Power Systems Research”, Volume 57,
Issue 3, 20 April 2001, Pages 195-204.
[2] R.P. Payasi, A.K. Singh and D. Singh ”Planning of different types of distributed generation with seasonal mixed load models” IJEST Vol. 4,
No. 1, 2012, pp. 112-124.
[3] G. Celli and F. Pilo, "MV Network Planning under uncertainties on Distributed Generation penetration," Power Engineering Society Summer
Meeting, 2001 vol. 1, pp. 485-490, 2001.
[4] L. Ramesh, S. P. Chowdhury, S. Chowdhury, A. A. Natarajan, and C. T. Gaunt, “Minimization of Power Loss in Distribution Networks by
Different Techniques,” in World Academy of Science, Engineering and Technology, 2009.
[5] T. Sutthibun and P. Bhasaputra, “Multi-objective optimal distributed generation placement using simulated annealing,” in Internacional
Conference on Electrical Engineering (ECTI-CON), 2010, pp. 810–813.
[6] F. A. Ferret and M. G. Simoes. (2006) ” Integration of alternative sources of energy” 2006.
[7] Popovic, D. H., Greatbanksb, J.A., Begovic, M., Pregel, A., “Placement of Distributed Generators and Re-closers for Distribution Network
Security and Reliability,” Electr.Power and Energy Systems, 27, 398–408(2005).
[8] M. P. Lalitha, V. C. V. Reddy, and V. Usha, “Optimal DG Placement for Minimum Real Power Loss in Radial Distribution Systems using PSO,” J. Theor. Appl. Inf. Technol., vol. 13, no. 2, pp. 107 – 116, 2010.
[9] L. Wang and C. Singh, “Reliability-Constrained Optimum Placement of Recloses and Distributed Generators in Distribution Networks Using
an Ant Colony System Algorithm,” IEEE Trans. Syst. Man, Cybern. Part C (Applications Rev., vol. 38, no. 6, pp. 757–764, Nov. 2008.
[10] D. Q. Hung, N. Mithulananthan, and R. C. Bansal, “Analytical Expressions for DG Allocation in Primary Distribution Networks,” IEEE Trans.
Energy Convers., vol. 25, no. 3, pp. 814–820, Sep. 2010.
[11] A. I. Aly, Y. G. Hegazy, and M. A. Alsharkawy, “A simulated annealing algorithm for multi-objective distributed generation planning,” in
IEEE PES General Meeting, 2010, pp. 1–7.
[12] D. Karaboga and B. Akay, "A comparative study of Artificial Bee Colony algorithm "AMC, vol. 214(1), pp. 108-132, 2009.
[13] X.-S. Yang and S. Deb, "Cuckoo Search via Lévy flights," in NaBIC 2009. World Congress on, 2009, pp. 210-214
[14] M. Chakravorty and D. Das, "Voltage stability analysis of radial distribution networks," International Journal of Electrical Power and Energy Systems, vol. 23, pp. 129-135, 2001.
[15] C. J.Mozina, “A tutorial on the impact of distributed generation (DG) on distribution systems,” in Proceedings of the 61st Annual Conference
for Protective Relay Engineers, pp. 591–609, College Station, Tex, China, April 2008.
[16] X.-S. Yang, “A New Metaheuristic Bat-Inspired Algorithm,” in Nature Inspired Cooperative Strategies for Optimization (NICSO 2010) SE - 6,
vol. 284, Springer Berlin Heidelberg, 2010, pp. 65–74.
[17] A. Hamouda and K. Zehar, "Efficient Load Flow Method for Radial Distribution Feeders," JAS vol. 6, pp. 2741-2748, 2006.
0 10 20 30 40 50 60 70 80 90 100 0.5 0.6 0.7 0.8 0.9 1 1.1 1.2
number of generations
o b je c ti v e f u n c ti o n v a lu e s
convergence characteristic using pso and bat with real and reactive dg
PSO BAT
TABLE III
RESULTS FOR TWO DG BY BOTH ALGORITHMS
For Two DG
Algo-rithm Best Worst Mean
Std. Dev.
Case 1
BA 0.6183 0.6534 0.6236 0.0047
PSO 0.6235 0.6703 0.6392 0.0113
Case 2
BA 0.5148 0.5197 0.5169 0.0019