A
N
ovel
F
ull
R
eference-
I
mage
Q
uality
A
ssessment for
G
lobal and
L
ocal
P
arameters
P
erception using SC-QI and SC-DM
Zainab Kareem Shakir1 Anupama Namburu2 PG Scholar1 M.Tech.P.hD, Assistant Professor2
ANU Department of science and engineering technology, Guntur, Andhra Pradesh, India
[email protected] [email protected]
Abstract---
To measure the quality of an imagedifferent mathematical methods are proposed. By
using these methods image quality assessment can
be done easily and we can get the perfect features
which are matched to the human visual system
(HVS) for the visual quality perception. Many
existing IQA methods, computation is difficult to
characterize the visual quality perception for local
image characteristics and different distortions will
occur. In this paper, we propose a method to resolve
the problem, i.e. structural contrast-quality index
(SC-QI), by considering the structural quality index
(SCI), we are also introducing some other
parameters which will reflect the HVS for contrast
sensitivity and chrominance component variation.
The modified SC-Qi is called as structural contrast
distortion metric (SC-DM), in this we can get the
desirable mathematical values and valid distance
metric ability and quasi-convexity. So this
technique is effectively used for distance metric
problems.
Keywords: Image quality assessment, Human visual system, Image features, SC-DM, SC-QI
1.
I
NTRODUCTION
The quality of any image is lost due to the occurrence of noise and these noises occurred during the storing and transmit of information or during sharing time of information between the devices. A wide range of applications depends on this transmitted digital information. Hence quality measuring is needed for assessing and control the quality of those images. Image quality assessment refers to a model which predicts the quality of distorted images. Image quality assessment methods are categorized as: subjective assessment by humans where the evaluation of quality by humans is obtained by mean opinion score (MOS) method and other is an
objective assessment by algorithms which
Image quality measurement is very important for various image processing applications such as recognition, retrieval, classification, compression, restoration and similar fields. The images may contain different types of distortions like blur, noise, contrast change etc. So it is essential to rate the image quality appropriately. Traditionally subjective rating methods are used to evaluate the quality of the image, in which humans rated the image quality based on time requirements. This is a costly process and it needs experts for evaluating image quality.
Nowadays many image quality assessment
algorithms are available for finding the quality of images. These are mainly based on the properties of human visual system.
A. IMAGE QUALITY: THE GRAND PICTURE
The first domain of interest is the field of experimental physics and instrumentation which abundantly uses signal processing tools as developed in Fourier analysis: spectral density function, point spread function, signal-noise ratio, etc. It nourishes abundantly the specific literature dealing with optimizing the sensor and the optical system, where, for instance, people is interested in compromising between f-number and exposure time, or ISO sensitivity and f-number. It purveys the most used tools for comparing camera performances in specialized journals for photographers or scientists or
application. It relies on objective and deterministic physical measurements obtained from experimental benches, with normalized targets and controlled physical parameters. It does not pay attention to the image, nor to the observer. Its results are expected to be valid for any image and deterministically established.
The second domain has been developed mostly for broadcasting (either with still images or with videos) when the community is looking for the best visual quality under practical constraints on bandpass, computation power and storage facilities. It may also take into account viewing conditions and economical balance. These methods pay a great attention to the human visual system and consider the image as a whole. They often balance various types of drawbacks to evaluate a global judgment. Based on shared catalogs of image impairments, they propose heuristic formulas (often inspired from biological or
psychophisical experiences) which adequately
combine pooled local and specific measures. They generally take their value in a statistical sense, when many different experiments are done with various and significant samples of images, and sufficient observer cliques.
the digital photo as the received message and the camera, with its specific set-ups, as a channel possibly impaired with transmission impairments (noise, diffraction, focusing errors, integration on the sensor, etc.). Although rather difficult to instantiate, this approach is prone of fruitful results as shown in the recent literature. It provides bounds on the performances we may expect from a system and allows for a global optimization of the parameters. However it is not yet accepted by the community for well justified reasons.
B. CONTRIBUTION WORKS
(a) Initial contribution step is performing in-depth analysis on the existing FR-IQA methods in order to understand the HVS base parameters and its approach towards to get the quality assessment statistics in a well defined manner. A research on conventional methods gives indications that the introduction of the adaptive technologies to improve the system performance. The introduction of the adaptive global and local features to achieve the overall quality assessment in context to various distortion types along with the consideration of the image texture properties.
(b) The structure of the image object plays avital role in assessing the quality of the digital image in perceptional way using the human visual system as the basic parameter. A new FR-IQA method, which
is abbreviated as Structural Contrast-Quality Index (SC-QI) is proposed in this work which acts based on the adaptive structural contrast index(SCI) and it is introduced as the additional boost to the already existing FR-IQA method for getting quality of image statistics for different image distortion types and to the various image textural characteristics. The SCI framework is further added with Structural Contrast-Quality Index (SC-QI) in order to perceive the image properties by human eyes in proper way. The ability of the SC-QI is quite useful in getting the global and local feature qualities Structural Contrast-Quality
Index (SC-QI). The proposed methodology
outperforms the all exiting methodologies to achieve
the better performance with much lower
computational complexity.
makes uses of an objective fuction for solving the optimization issues.
2.
I
MAGE
Q
UALITY
D
EFINITION
Historically, image quality is described in terms of the visibility of the distortions in an image, such as colour shifts, blurriness, Gaussian noise and blockiness. The most common way of modeling an image quality metric is therefore by quantification of the visibility of these distortions. For example, Just Noticeable Difference (JND) model by Sarnoff [2] predicts subjective rating of an image by examining the visibility of distortions. In [3], Janssen has proposed a new philosophy for image quality. He regards image as carriers of visual information instead of two-dimensional signals, regards visual-cognitive processing as information processing rather than signal processing and regards image quality as image adequacy in the visual interaction process instead of visibility of distortions. Though this concept is interesting and seemapplicable, most of the works are still reported based on the former concept, due to its simplicity and good performance.
3.
I
MAGEQ
UALITYA
SSESMENTImage quality is a characteristic of an image that measures the perceived image degradation imaging systems may introduce some amounts of distortion or artifacts in the signal, so the quality assessment is an
important problem. Basically image quality is measured in two ways subjective and objective method. In Subjective image quality assessment the evaluation of quality by humans is obtained by mean opinion score (MOS) method where in objective evaluation of quality is done by algorithms. It concerned with how image is perceived by a viewer and gives his or her opinion on a particular image and judge quality of the multimedia content. The human eyes extract structural information from the viewing field, so the human visual system is highly adapted for this purpose. Therefore, the measurement of structural distortion should be a good approximation of perceived image distortion .So the accurate and more efficient IQA measures will certainly enhance their applicability in real-world applications.
distortion should be a good approximation of perceived image distortion .So the accurate and more efficient IQA measures will certainly enhance their applicability in real-world applications.
4.
I
MAGEQ
UALITYA
SSESSMENTT
ECHNIQUESThere are two techniques of Image Quality Assessment:
1. Subjective Quality Assessment
We can say that human itself recognize the quality of image very well. In this type of method humans are involved and they have to recognize the quality of
image.The scores evaluated by multiple subjects are
averaged for each test image to obtain mean opinion score and difference mean opinion score. For this technique the answer is different for individual observer. Also the expenses are more as well it is not applicable to real time processing.
2. Objective Quality Assessment
The goal of objective IQA is to design mathematical models that are able to predict the quality of an image accurately and automatically. An ideal objective IQA method should be able to mimic the quality predictions of an average human observer. This is quantitative approach which is used to estimate the number which shows the quality of image. The objective image quality is classified into following
three types as full-reference, no- reference and
reduced-reference. The following types are
depending on the use of the reference image.
A. No-Reference Model
Evaluation of noise content or distortions present in an image is same as assessing the quality of an image. Measurement of such quality index is challenging in the absence of reference image. In this type of model we don‟t have any priori knowledge. This type of model is also called as „Blind Model‟. The main advantage of this type of model is we can use this type model in any application because they don‟t require any reference information. These models are easy for calculation and gives approximate estimation.
B. Full-Reference Model
In this type of algorithm we known the perfect version of image or video and we have to calculate the distortions present. The perfect version we can get by high quality acquisition device before the errors will take place like transmission error and compression artifacts.
C. Reduced-Reference Model
the quality of distorted image by the RR QA algorithms.
5.
P
ROPOSED
M
ETHODOLOGY
A. Human Visual System based Quality
Observation
The digital image quality perception by the human visual system (HVS) and its observations is carried out at different strategic levels for both the image texture properties as well as the image distortion types in a well defined manner. The image distortion types and its relationship with the human visual system is defined as following
These two kinds of distortions differently affect the perceived visual quality of HVS. For AGN distortions, HVS tends to mostly perceive such distortions (or quality degradations) in homogeneous image regions (e.g., green box) while hardly perceiving them in complex texture regions (e.g., yellow box)
B.
Analysis
on
Contrast/Structure
Features
We analyze the characteristics of visual features for
contrast/structure information within FR-IQA
methods with respect to the two different kinds of distortions (i.e., AGN and GB) in three image regions of different characteristics (homogeneous, edge and
complex texture characteristics). To do so, we use the four popular visual features which have widely been used in the existing FR-IQA methods
In this qualitative analysis, we also use SCI to see its effectiveness of adaptive characterization power for visual quality perception with respect to different image texture types for the two kinds of distortion types. It is known that most FR-IQA methods have estimated distortions using a difference (or relative difference) of feature/ signal values obtained from an original image and its distorted image. Likewise, in the paper, we compare the difference of feature values between the original image X and its distorted images Y1 and Y2 to see the estimated distortions by the features for the perceived visual qualities. We apply a simple difference operation to see local distortions estimated by feature values.
C. Proposed Structural Contrast-Quality
Index:
Fig. 1 shows a block diagram ofLocal SC-QI computation between a reference local image signal x
converted into the LMN color space to de-correlate luminance (L) and chrominance (M, N).
[ ] [
] [ ]
Fig.1: A block diagram of local SC-QI computation between a local image signal x and its local distorted image signal y.
A local SC-QI value between x and y is calculated by the multiplication of six similarity measures , k = 1,. . ., 6 as
∏
Where all the similarity measures have the same form as
= (
) (3)
The contrast energy values , and for , and in (3), respectively, are calculated as
∑
∈
The global perceptual visual quality value is
[ ] ∑ ( )
(5)
D.
Proposed
Structural
Contrast
Distortion
Metric
With
Normalized
Distance Metrics
Our SC-QI is extended to SC-DM using a normalized root mean squared error (NRMSE) such that SC-DM obtains a desirable mathematical property of valid
distance metricability with quasi convexity in a feature space. The NRMSE is expressed as
( ) ‖ ‖
√‖ ‖ ‖ ‖
NRMSE for a distortion measure
( ) = | |
√
The sum of squared six distortion measures
‖ ‖
The NRMSE offers two advantages to SC-DM as follows:
(i) The NRMSE in (7) reflects the Weber‟s law in HVS, indicating that the sensitivity of HVS to signal differences depends on the current stimulus; NRMSE is capable of yielding much higher correlations with perceived visual distortions than the L2-norm. (ii) The NRMSE based local SC-DM in (8) is a valid difference metric. Furthermore, it is quasi-convex and differentiable, which can widen the applicability of SC-DM in image quality optimization problems. More detailed proofs and mathematical validations of SC-DM as a valid distance metric with differentiable quasi-convex function are given in Appendix.
Reference signal X
Color space conversion (RGB to LMN)
SCI measurement
Mean chrominance measurement Contrast measurement
SCI measurement
Local importance measurement
SCI similarity measurement
Contrast similarity measurement
Chrominance similarity measurement
Local SC-QI value
Distorted signal y
Color space conversion (RGB to LMN)
4
Mean chrominance measurement
Contrast measurement
4
6.
R
ESULT
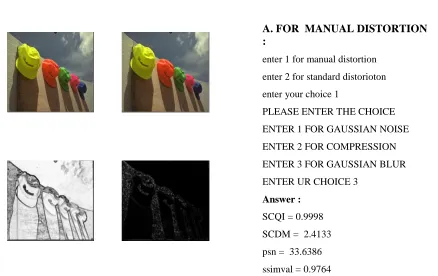
Fig. 2: (a) Original Image (b) Noisy Image (c) Image used to calculate SC-QI (d) Image used to calculate SC-DM
A. FOR MANUAL DISTORTION
:
enter 1 for manual distortion enter 2 for standard distorioton enter your choice 1
PLEASE ENTER THE CHOICE ENTER 1 FOR GAUSSIAN NOISE ENTER 2 FOR COMPRESSION ENTER 3 FOR GAUSSIAN BLUR ENTER UR CHOICE 3
Answer : SCQI = 0.9998 SCDM = 2.4133 psn = 33.6386 ssimval = 0.9764 gs = 0.9985 mssim = 0.9874 qty = 445.7430
B. FOR STANDARD DISTORTION : enter 1 for manual distortion
enter 2 for standard distorioton enter your choice 2
enter 1 for white noise distortion enter 2 for gaussian blur distorioton enter 3 for compression distortion enter your choice 3
Fig. 3: (a) Original Image (b) Noisy Image (c) Image used to calculate SC-QI (d) Image used to calculate SC-DM
7.
C
ONCLUSION
Image quality assessment is one of the challenging field of digital image processing system. Image quality assessment has been of major importance for several domains of the industry of image as for instance restoration or communication and coding. New application fields are opening today with the increase of embedded power in the camera and the emergence of computational photography: automatic tuning, image selection, image fusion, image data-base building, etc. In this paper, we firstly reveal that HVS has different strategies in measuring perceived visual quality depending on different image texture characteristics and distortion types. Based on this, we propose a novel FR-IQA index, called SC-QI, which incorporates a very effective feature, i.e., SCI, to adaptively characterize local visual quality perception with respect to different image texture characteristics with structural-distortion types. We also further extend SC-QI to SC-DM based on a normalized distance metric such that SC-DM obtains desirable
mathematical properties of valid distance
metricability and quasi-convexity. To verify the performance of the proposed SC-QI and SC-DM,
qualitative and quantitive experiments were
extensively performed on large IQA datasets. The experimental results show that SC-QI and SC-DM can very elaborately predict global and local visual quality scores, thus yielding better prediction performance with fast computation compared to the state-of-the-art FR-IQA methods.
R
EFERENCES
[1] Z. Wang and A. C. Bovik, “Mean squared error: Love it or leave it? A new look at signal fidelity measures,” IEEE Signal Process. Mag., vol. 26, no. 1, pp. 98–117, Jan. 2009.
[2] Z. Wang and A. C. Bovik, Modern Image Quality Assessment. San Rafael, CA, USA: Morgan & Claypool, 2006.
[3] L. Zhang, L. Zhang, X. Mou, and D. Zhang, “A comprehensive evaluation of full reference image quality assessment algorithms,” in Proc. 19th IEEE Int. Conf. Image Process., Sep./Oct. 2012, pp. 1477– 1480.
[4] P. C. Teo and D. J. Heeger, “Perceptual image distortion,” Proc. SPIE, vol. 2179, pp. 127–141, May 1994.
[5] N. Damera-Venkata, T. D. Kite, W. S. Geisler, B. L. Evans, and A. C. Bovik, “Image quality assessment based on a degradation model,” IEEE Trans. Image Process., vol. 9, no. 4, pp. 636–650, Apr. 2000.
[6] D. M. Chandler and S. S. Hemami, “VSNR: A wavelet-based visual signal-to-noise ratio for natural images,” IEEE Trans. Image Process., vol. 16, no. 9, pp. 2284–2298, Sep. 2007.
[7] E. C. Larson and D. M. Chandler, “Most apparent distortion: Fullreference image quality assessment and the role of strategy,” J. Electron. Imag., vol. 19, no. 1, pp. 011006:1–011006:21, Jan. 2010.