Intellection to the causes, Entailment and
Ascendancy of Harmonic Distortion in
Electrical Power System
A. Kumar1, Vanita Batra2
Assistant Professor, Dept. of EE, Vaish College of Engineering, Rohtak, Haryana, India1
Assistant Professor, Dept. of ECE, Vaish College of Engineering, Rohtak, Haryana, India2
ABSTRACT: It is quite intemperate for those without copious electrical engineering knowledge & background to know about harmonics distortion in electrical power system. The compendious of this paper is to provide an overview and to understand the harmonics and its considerations for designing industrial and commercial electric power distribution systems. In present day’s electrical power system was serving a combination of electrical loads supplied and controlled by electronic systems. Many of those produce non-sinusoidal current and voltage when energized from AC sinusoidal voltage source. To know about harmonics we explain the meaning of harmonic & backgrounds that create and give rise to the harmonics in power system which degrades the performance of system. Then the outcome and consequences of the harmonics on power system are studied. The quantitative analysis of effect of harmonics on power system with the help of Fourier series & spectrum analysis was done. The recommendations made by IEEE Std. 519-1992 are also considered. There after the work is incorporated with simulation of the system.
KEYWORDS: Harmonics, power system harmonics, Fourier analysis of harmonics, simulation of harmonics.
I. INTRODUCTION
Earlier power system harmonic distortion was observed in 1900s in AC power system. The harmonic distortion was produced due to ferromagnetic loads, arcing loads [1]. The major concerns were the affects of harmonics on synchronous and induction machines, telephone interference and power capacitor failures [2]. Now power system distortion is not a new phenomenon. It is most worthy to provide reliable and good quality of electrical power to the domestic and industrial consumer. In an ideal electrical power supply system energy is supplied at constant frequency and specified voltage level of steady magnitudes and invariant wave shape which are shown in fig: 1 and fig: 2. Beside this, in practice conditions none of those are fulfilled. The power supply utilities often find it is hard to preserve such desirable conditions. The problem of waveform distortion results from the increasing numbers and power rating of the highly non-linear power electronic devices used in the controlling of power apparatus and system in domestic and industries such as steel, paper and textile industries [3]. As the number of harmonic producing loads has increased over the years, it has become increasingly essential to address their impaction when making any additions or changes in power system [4]. At present harmonic distortion constitutes one of the main concerns for engineers in the several stages of electrical energy utilization within the power industry. Harmonics degrade the level of power quality and its efficiency, particularly in a commercial building or industrial facility. In general, the electrical supply in most of the buildings can withstand nonlinear loads of up to 15% of the total electrical system capacity without any concern. If the nonlinear loads exceed to this 15% limit, some non-apparent negative consequences may be occurred.
II. SOURCES OF HARMONIC DISTORTION
Non-linear equipment and components in the power system cause major distortion in the current and to a lesser extent of the voltage [3]. These sources of distortion can be divided in three groups:
1. Loads: The dominating distortion-producing group, globally, are the loads such as variable frequency derives, power converters etc.
2. The power system itself: For example HVDC, SVC, transformers, wind turbines etc.
3. The generation stage: The generation stage can, during some special conditions, contribute to some voltage distortion at high voltage transmission level. The distortion at the point of generation is very small (about 1% to 2%).
CURRENT HARMONICS: In a normal AC power system the current varies sinusoidally at a specified frequency, usually 50 or 60 hertz. A sinusoidal current is drawn when a linear electrical load is connected to the system at the prescribed frequency and voltage as shown in fig: 1 and fig: 2. When a nonlinear electrical load, such as a rectifier, computers and printers, fluorescent lighting, battery chargers and variable-speed drives are excited by AC power than they draw a non sinusoidal current from the source [4]. In such conditions depending on the type of load and other components of the system the current waveform become quite complex as shown in fig: 3. This distortion in the current wave form is described as current harmonics. Irrespective of how complex the current waveform becomes it is possible to decompose it into a series of simple sinusoids, which start at the power system fundamental frequency and occur at integer multiples of the fundamental frequency through Fourier series analysis [6].
VOLTAGE HARMONICS: Voltage harmonics are mostly caused by current harmonics [4]. The voltage provided by the voltage source will be distorted by current harmonics due to source impedance. If the source impedance of the voltage source is small, current harmonics will cause only small voltage harmonics.
III. MATHEMATICAL ANALYSIS USING FOURIER ANALYSIS
The Fourier series analysis describes that all non-sinusoidal periodic functions can be represented as the sum of terms (i.e. a series) made up of:
1. A sinusoidal term at the fundamental frequency,
2. Sinusoidal terms whose frequencies are whole multiples of the fundamental frequency, 3. A DC component, where applicable.
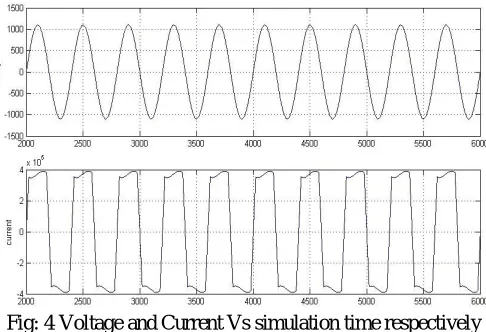
A nonlinear AC input current waveform of the bridge rectifier as shown in Figure 3 with fundamental frequency 50Hz. In addition to a dominant component at the fundamental frequency, the waveforms in fig: 4 contain components of unwanted frequencies that are harmonics of fundamental frequency. There components are calculated by means of Fourier analysis [7].
In general, a non-sinusoidal waveform f (t) repeating with an angular frequency ω can be expressed as:
……(1)
Here
……(2)
……(3)
The rms value of all harmonic components is given as
……(5)
For symmetrical AC waveforms such as shown in fig: 1, the average value of is zero and the values of and can be determined under limits as:
and ……(6)
By using this analysis the symmetrical AC components of voltage and current for steady state condition can be determined as:
, ……(7)
Where and represents the fundamental (line frequency ) components and and are the components at the harmonic frequency as shown in fig: 5.
IV. HARMONIC SPECTRUM AND DISTORTION FACTOR
The amount of distortion in voltage and current waveform is quantified by means of an index i.e total harmonic distortion (THD). It is defined as the ratio of root-mean-square of the harmonic content to the root-mean-square value of the fundamental quantity and expressed as a percent of the fundamental. Total harmonic distortion of voltage is given as:
……(8)
Total harmonic distortion of current is given as
……(9)
Recommended values of voltage and current distortion according to IEEE 519-1992 are given in section 5.1 [9][5].
The total demand distortion (TDD),
……(10)
……(11)
V. EFFECT OF HARMONIC ON EQUIPMENTS
TRANSFORMER: Application of non-sinusoidal excitation voltages to transformers increases the iron losses in the magnetic core of the transformer in much same way as in the motor. A more serious effect of harmonic loads served by transformers is due to an increase in winding eddy current losses. Eddy current concentrations are higher at the ends of the transformer windings due to the crowding effect of the leakage magnetic fields at the coil extremities. The increase in transformer eddy current loss due to harmonics has a significant effect on the operating temperature of the transformer [6].
CABLES: The flow of normal 50-Hz current in a cable produces losses and current distortion introduces additional losses in the conductor. Also, the effective resistance of the cable increases with frequency due to skin effect, where unequal flux linkages across the cross section of the cable causes the AC current to flow on the outer periphery of the conductor. The higher the frequency of the AC current, greater is this tendency [6].
CAPACITOR BANKS: Many industrial and commercial electrical systems have capacitors installed to kickoff the effect of low power factor. Most capacitors are designed to operate at a maximum of 110% of rated voltage and at 135% of their kVAR ratings. In a power system characterized by large voltage or current harmonics, these limitations are frequently exceeded, consequently capacitor bank failures. Moreover during resonant conditions, if the amplitude of the offending frequency is large, considerable damage to capacitor banks would result. And, there is a high probability that other electrical equipment on the system would also be damaged [8].
VI. RESULT AND DISCUSSION
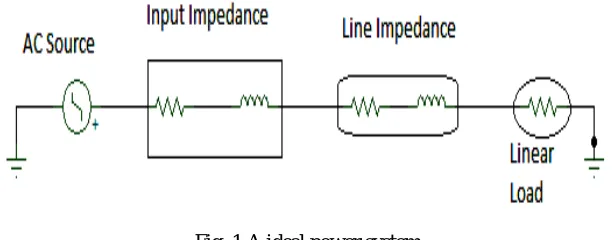
Fig. 1 shows an ideal electrical power system sub structured with a AC source having input impedance connected with line impedance (simulating transmission line) and a linear load. In practical this type of system is possible only in laboratory but not in physical world.
Fig. 1 A ideal power system
Fig. 2 Voltage and Current Vs Simulation time
Fig. 3 A Real power system
Fig. 3 shows a real practical electrical power system having a AC power generator with source impedance, transmission line impedance, a variable frequency power converter and a linear load.
Fig: 4 Voltage and Current Vs simulation time respectively
Fig. 5 Harmonic current Vs Simulation time
Fig. 5 shows 3rd, 5th, 7th, 9th and 11th harmonics in the current respectively. It is clear from the fig. As the count of harmonic increases the current suffers with more distortion but with low amplitude. Beside this 3rd, and 5th harmonics shows higher amplitude distortion which are more harmful than higher order harmonics.
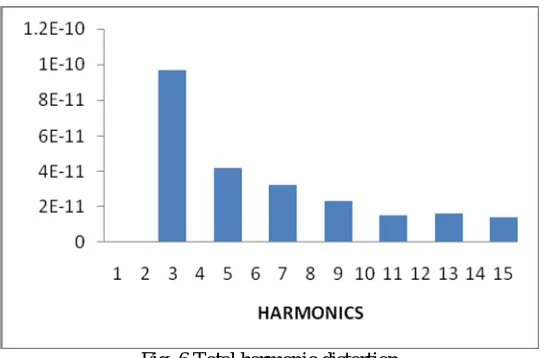
Fig: 6 Total harmonic distortion
In fig. 6 amplitude of 3rd, 5th, 7th, ... 15th harmonics is shown. From fig. It is clear that as the order of harmonics increases amplitude of harmonic decreases. The lower order harmonics possess high amplitude and results in degraded power supply.
VII. CONCLUSION
REFERENCES
[1] L. Johan. “On Harmonic Distortion in Power Systems,” Chalmers University of Technology: Department of Electrical Power Engineering, 2001.
[2] J. Arrillega et.al. “Power System Harmonics,” John Wiley and Sons, 1985.
[3] R.C. Dugan, D.T. Rizy, “Harmonic Considerations for Electrical Distribution Feeders,” National Technical Information Service, Report No. ORNL/Sub/81-95011/4.
[4] J. arrillaga, D.A.Bradley and P.S.Bodger “Power system harmonics,” Wiley, 23-Jul-1985
[5] IEEE Guide for Applying Harmonic Limits on Power Systems – Unpublished Draft, IEEE Std P519.1™/D9a, January, 2004. [6] “Industrial and Commercial Power Systems Analysis” ANSI/IEEE Std. 399-1990
[7] K. A. Stroud “Fourier series and harmonic analysis.”
[8] Murphy and F.G. Turnbull, “Power Electronic Control of AC Motors,” Pergamon Press, Elmsford, New York, 1988.
[9] IEEE Recommended Practices and Requirements for Harmonic Control in Electrical Power Systems, ANSI/IEEE Std. 519-1992. [10] “Electric Power Distribution for Industrial Plants”, ANSI/IEEE Std. 141-1986.