ISSN: 2319-8753
International Journal of Innovative Research in Science,
Engineering and Technology
(An ISO 3297: 2007 Certified Organization)
Vol. 2, Issue 11, November 2013
Workers’ Perceptions about Industrial
Performance -An Empirical Study
Dr.T.B.Pankhania
1, Prof.A.H.Jariya
2, Mr.V.K.Modi
3Associate Professor, Dept. of Mechanical Engineering and Head, Workshop, B.V.M.Engineering College, Sardar Patel
University, Vallabh Vidyanagar, Anand, Gujarat, India.1
Assistant Professor, Dept. of Production Engg. B.V.M. Engineering College, Gujarat Technological University,
Ahmadabad, India.2
Lecturer, Dept. of Mechanical Engineering, B.&B. Institute of Technology, Vallabh Vidyanagar, Gujarat
Technological University, Ahmadabad, Gujarat, India.3
Abstract: The workers are very important for any organization. The workers involvement in decision making, workers empowerment in making decision and motivation along with appropriate incentives help improve industrial performance. The sample considered for the analysis. The workers were given a set of questions to extract the in-house scenario and their feel good about their job satisfaction. This paper uncovers the factors which are predominant in enhancing industrial performance and hence industrial productivity leading higher living standard of the individuals and people in general.
Keywords: Appropriate, decision, empowerment, extract, incentives, living standard, satisfaction.
I. INTRODUCTION
This paper reads about workers’ perceptions of working conditions, appreciation, and motivation in the organisation where they are working full time on roll. As we know that motivated workers work more and improve industrial performance leading to higher productivity and hence improve living standard of the people by enlarge. The study was carried out in the GIDC, Vitthal Udyognagar in Anand district of Gujarat, India, where large numbers of engineering units are working since 1965.This estate has generated more than 15000 jobs among 1000 odd industrial units are running and majority of units are in small scale.
II.OBECTIVES
The primary objective of this research was to take the stock of existing situations and to assess the industrial performance in the context of the changing industrial scenario. Another major focus of the study was to harvest if any means and measures were followed to keep pace with highly competitive situations for survival. To study the possibility of effective means of utilisation of resources available and especially human wants and satisfaction leading to better performance and to study ills of the estate which are due to inadequate productivity levels and to study the possibilities for technological changes, potentialities, healthy industrial performance and scope for future developments.
III.RESEARCHMETHODOLOGY
ISSN: 2319-8753
International Journal of Innovative Research in Science,
Engineering and Technology
(An ISO 3297: 2007 Certified Organization)
Vol. 2, Issue 11, November 2013
Research design is the systematic arrangement of data collection and analysis in a manner that aims to combines relevance to the research purpose. It is a road map of the collection, measurement and analysis of data. For this research study both the primary and secondary sources of data were used.
Primary data obtained directly from each unit in a survey is often known as primary data. The researchers have collected the needed data directly from the respondents for this study. Primary data were collected with the help of questionnaires designed. Primary data is the first hand information and original source of data.
Secondary data obtained from external sources like, published materials or directly from computer media. The researcher has used published articles, reports, journals, library books, magazines, news papers, internets - websites, etc. as a secondary source of data, these references taken in the form of secondary data.
Through structured questionnaires for the lower level staffs of the organisations and most important part of the work organisations are workers’ as respondents to study the industrial productivity scenario and potentiality in the industrial estates was a crucial part of the analysis..
IV.THECASE
The research was carried out at Vitthal Udyognagar in Anand district of Gujarat state. The study was targeted to the lower level employees, mainly workers. It was aimed to know the perceptions of the workers from the representative industries of the sample considered. Total 150 questionnaires were distributed among the respondents. Out of 150, 77 questionnaires were omitted due to incomplete, inconsistent and irrelevant responses. Hence sample of size 65 was considered for the study. These responses include primary data from small, medium and large scale units in operation. These responses were considered from usable questionnaires only and responses were 43.33% which were considered acceptable for this research study and analysis Table I.
The five point Likert scale: Strongly agree (05), Agree (04), Not sure (03), Disagree (02) and strongly disagree (01) was used.
TABLE I
RESPONSE RATE OF THE RESEARCH STUDY
Questionnaire Questionnaire distributed
Questionnaire received Questionnaire usable (Sample size)
Percent
Workers 150 77 65 43.33
Primary data was collected through structured questionnaire having closed-ended as well as a few open-ended questions/statements. In most of the cases five point Likert scale was used.
The quality of statistical results depends on the care exercised in the data-preparation phase. Paying inadequate attention to data preparation can seriously compromise statistical results, leading to biased findings and incorrect interpretation. This includes data-collection process, which begins with checking the questionnaire for completeness.
ISSN: 2319-8753
International Journal of Innovative Research in Science,
Engineering and Technology
(An ISO 3297: 2007 Certified Organization)
Vol. 2, Issue 11, November 2013
V.STATISTICALANALYSIS A. Index of Reliability
TABLE II RELIABILITY STATISTICS
Cronbach's Alpha Cronbach's Alpha Based on Standardized Items N of Items
0.745 0.788 12
TABLE III
THE INDEX OF RELIABILITY
Sr. No. Cronbach’s Alpha Internal Reliability
1 ≥ 0.90 Excellent
2 ≥ 0.80 Good
3 ≥ 0.70 Acceptable
4 ≥ 0.60 Questionable
5 ≥ 0.50 Poor
6 < 0.50 Unacceptable
The questionnaire is reliable with Cronbatch’s alpha (α) = 0.788 and it can be used for statistical analysis.
B. Mean and Standard Deviation
TABLE IV
MEAN AND STANDARD DEVIATION OF THE SCALE
Variable 1 2 3 4 5 6 7 8 9 10 11 12
Mean 4.123 2.739 2.892 2.785 4.000 3.569 3.569 3.046 4.031 3.215 3.215 2.692
S.D. 0.331 1.065 1.147 1.231 0.468 1.060 0.717 0.584 0.718 0.900 0.920 0.760
The maximum mean value is 4.123 (between (05) & (04) Likert scale weightage) and the minimum mean value is2.692 (between (03) & (02) Likert scale weightage) with standard deviation values 0.331 & 0.776 respectively.
TABLE V ANOVA
Sum of Squares DF Mean Square F Sig
Between People 151.679 64 2.370
Within People Between Items 268.672 11 24.425 40.380 0.000
Residual 425.828 704 0.605
Total 694.500 715 0.971
Total 846.179 779 1.086
Grand Mean = 3.2949
Analysis of Variance (ANOVA): One of the most powerful tools of statistical analysis is what is known as analysis of variance. Analysis of variance is used for examining the differences in the mean values of the dependent variable associated with the effect of the controlled independent variables. This is a statistical test for comparing the means of more than two populations or groups. It gives an overall comparison of means and investigates whether the population means are likely to be same or different.
ISSN: 2319-8753
International Journal of Innovative Research in Science,
Engineering and Technology
(An ISO 3297: 2007 Certified Organization)
Vol. 2, Issue 11, November 2013
Table V: ANOVA shows F (40.380) and from the statistical tables we see that for 11 degrees of freedom, the critical value of F = 19.675 for α = 0.05. Because the calculated value of F = 40.380 is greater than the calculated value, we reject null hypothesis. As the associated probability is less than the significance level of 0.05, the null hypothesis for equal means is rejected.
VI. RESPONDENTS LEVEL OF AGREEMENT- QUESTION VIZ ANALYSIS
Q.1: Workers feel proud to be associated with this organisation. (Feel proud)
Question Response Strongly agree(5) Agree(4) Not sure(3) Disagree(2) Strongly disagree(1) Total
Feel Proud % 12.31 87.69 0.00 0.00 0.00 100.00
The respondents have given positive opinion and they feel proud to be associated with the organisation. There is no other negative opinion. Hence, it can be concluded that all workers of the organisation feel proud and feel good to be associated with the organisation.
Q.2: Workers are getting good salary. (Remuneration Satisfaction)
Question Response Strongly agree(5) Agree(4) Not sure(3) Disagree(2) Strongly disagree(1) Total
Satisfaction % 3.08 21.54 36.92 23.08 15.38 100.00
The workers have diverse feeling about remuneration satisfaction. Hence, it is concluded that majority of the respondents are in dilemma about remuneration satisfaction. Percentage of satisfaction of remuneration is less than percentage of dissatisfaction.
Q.3: Workers are satisfied with working hours. (Working hours)
Question Response Strongly agree(5) Agree(4) Not sure(3) Disagree(2) Strongly disagree(1) Total
Working hours % 100.00
The workers have diverse feeling about work hours. Hence, it is concluded that majority of the respondents are in dilemma about working hours. Hence, it is concluded that the percentage of satisfaction with work hours is less than percentage of dissatisfaction work hours of the respondents gives divided opinion.
Q.4: Workers are satisfied with working conditions in their department. (Work environment)
Question Response Strongly agree(5) Agree(4) Not sure(3) Disagree(2) Strongly disagree(1) Total
Work environment % 3.08 41.54 1.54 38.46 15.38 100.00
Total (3.08% & 41.54%) workers are feeling their working condition satisfactory and Total (38.46% & 15.38%) workers are not satisfied with working conditions. Only 1.54% of respondents are not sure about working condition in their department. Hence, it is concluded that the percentage of satisfaction about working conditions is less than percentage of dissatisfaction working condition their department, the respondents gave divided opinion.
Q.5: Employees are aware about housekeeping needs in the department. (Workplace Housekeeping)
Question Response Strongly agree(5) Agree(4) Not sure(3) Disagree(2) Strongly disagree(1) Total
Housekeeping % 9.23 83.08 6.15 1.54 0.00 100.00
The majority of respondents are aware about housekeeping needs in the department. Hence, it is concluded that workers are agree about the needs of housekeeping in the department.
Q.6: Workers think that there are no chances of promotion. (Chances of promotion)
Question Response Strongly agree(5) Agree(4) Not sure(3) Disagree(2) Strongly disagree(1) Total
Promotion % 18.46 38.46 30.77 6.15 6.15 100.00
The majority of workers agreed that there are no chances of promotion. Hence, it is concluded that workers are not satisfied with chances of promotion.
Q.7: Workers think that teamwork is prevailing in their department. Teamwork)
Question Response Strongly agree(5) Agree(4) Not sure(3) Disagree(2) Strongly disagree(1) Total
Team work % 4.62 10.77 72.31 9.23 3.08 100.00
Surprisingly, 72.31% of the respondents are not sure about teamwork in their department. There is a mix feeling of satisfaction as well as dissatisfaction for existence of team work in their department.
Q.8: Workers think that training is necessary. (Training & Development)
ISSN: 2319-8753
International Journal of Innovative Research in Science,
Engineering and Technology
(An ISO 3297: 2007 Certified Organization)
Vol. 2, Issue 11, November 2013
Training % 16.92 70.77 10.77 1.54 0.00 100.00
Majority (16.92% & 70.77%) of respondents agreed that training is necessary for development of the both workers and organisation. 10.77% of respondents cannot judge about the necessity of training. Only 1.54% of respondents have declined the need. Hence, it is concluded that maximum numbers of workers believed that training is very necessary. Q.9: Workers think that job rotation is necessary. (Job rotation)
Question Response Strongly agree(5) Agree(4) Not sure(3) Disagree(2) Strongly disagree(1) Total
Job rotation % 7.69 13.85 72.30 4.62 1.54 100.00
Majority 72.30% of respondents are not sure about the necessity of job rotation. Total 21.54% of respondents are in favour of job rotation and only 6.16 % of respondent in total are not in favour of necessity of job rotation. Hence, it is concluded that maximum numbers of workers are not sure about the necessity of job rotation.
Q.10: Workers are satisfied with management polices and rules. (Management policy)
Question Response Strongly agree(5) Agree(4) Not sure(3) Disagree(2) Strongly disagree(1) Total
Policy % 3.08 10.77 47.69 29.23 9.23 100.00
The maximum47.69% of respondents is not sure about management policy and 38.46% of respondents are not satisfied with management policy. Hence, it can be concluded that the workers are divided on satisfactory management policy.
Q.11: Workers are satisfied with organisational work culture. (Work culture)
Question Response Strongly agree(5) Agree(4) Not sure(3) Disagree(2) Strongly disagree(1) Total
Policy % 3.08 9.23 29.23 47.69 10.77 100.00
The workers are not satisfied with work culture of the organisation. 29.23% of the respondents are not sure about the work culture of the organisation. A very few workers are satisfied with work culture of the organisation where they work. So, workers are not satisfied with the work culture of the organisation.
Q.12: Overall productivity increases due to increases employees’ morale, motivation, earning (Overall
performance)
Question Response Strongly agree(5) Agree(4) Not sure(3) Disagree(2) Strongly disagree(1) Total
Performance % 27.69 43.08 29.23 0.00 0.00 100.00
The majority (27.69% & 43.08%) of workers are agreed that overall performance of the organisation increased due to decrease in waste, unproductive time and increases employees’ morale, motivation, earning etc.29.23% of respondents are not sure about these aspects of improving performance. There is no any negative opinion. So, it is concluded that overall performance and hence productivity increases due to decrease in wastes, unproductive times and increases in employees’ morale, motivation and, earning.
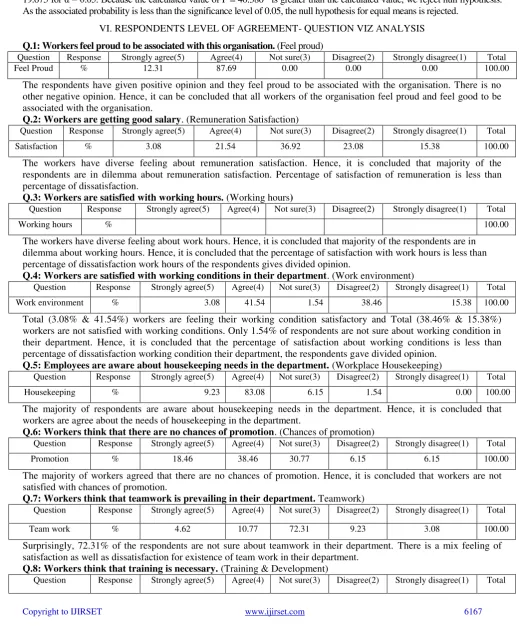
Table VI: To study of employees’ motivation, morale, job satisfaction and productivity of the organisation considering 12 attributes.
TABLE VI OVERALL ANALYSIS
Question Strongly agree(5) Agree(4) Not sure(3) Disagree(2) Strongly disagree(1) Total
Percentage 8.49 38.69 29.85 16.47 6.50 100.00
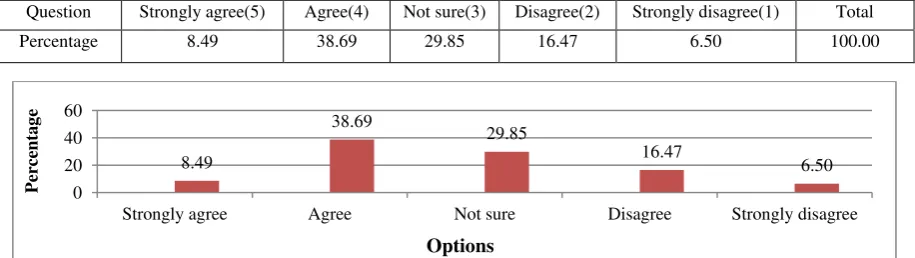
Fig.1. Overall Analysis
8.49
38.69
29.85
16.47
6.50
0 20 40 60
Strongly agree Agree Not sure Disagree Strongly disagree
Per
ce
n
ta
g
e
ISSN: 2319-8753
International Journal of Innovative Research in Science,
Engineering and Technology
(An ISO 3297: 2007 Certified Organization)
Vol. 2, Issue 11, November 2013
Figure 1: The chart depicts that 8.49% of respondents are strongly agree about the various aspects of assessing and improving performance of the organisation from workers’ point view.
The chart depicts that 38.69% of respondents are agree about the various aspects of assessing and improving performance of the organisation from workers’ point view.
The chart depicts that 29.85% of respondents are not sure about the various aspects of assessing and improving performance of the organisation from workers’ point view.
The chart depicts that 16.47% of respondents are disagree about the various aspects of assessing and improving performance of the organisation from workers’ point view.
The chart depicts that 6.50% of respondents are strongly disagree about the various aspects of assessing and improving performance of the organisation from workers’ point view.
VII. LIMITATIONS OF THE STUDY
The problems in data collection were many like: Non-availability of some secondary data.
Responses with reservation caused limited co-operation from some of the respondents.
The investigator was thought to be industry - agent or government authority in spite of avowal was given, so extracting information was difficult initially, too much time was consumed in convincing them for the purpose of the study.
The time factors, poor awareness of some respondents were other limitations.
The supervisors and technicians were scared about the workers’ disclosing problems they are facing at workplace. Lower education, language problem and lack of freedom to disclose the facts were major constraints to the
workers.
VIII. CONCLUSION
The study mainly focused on the perceptions of workers of the organisation considering various attributes on industrial performance and hence industrial productivity. It is well known facts that motivated workers work with more efficiency and effectively. The motivated works play vital role in improving industrial performance. An attempt is made to know the workers satisfaction through perceptions of the employees from the representatives’ industrial units of the estate under study. The structured questionnaires with a set of questions were asked to the respondents and statistical analysis was carried out to know what is what! The various statistical tests were carried to uncover the factors affecting industrial performance. The results of the analysis from the perceptions study found mixed opinion and required to be concentration to get more useful output at the workplace. With little more attempt to motivate and incentives to the accelerating workers will inspire the other employees to bring acceptable outputs.
ACKNOWLEDGEMENTS
In pursuing research work, we have received help and support from all corners. We convey sincere thanks to all of them; it may not be possible to personalize each and every one. However, we express sincere gratitude to all of them: Sardar Patel University, Vallabh Vidyanagar. Industry Commissioner of District Industries Centre, Anand for permitting to use all the records related literatures of industrial scenario of Anand district. Resident District Collector, Anand and staff for providing related literatures of industrial scenario and records of Gujarat state. Executives of Amul Dairy, Anand for their help to furnish details and permit visit of AMUL plants, for the study of their performance enhancement programme. Rupal Books Stall, Vallabh Vidyanagar for timely procurement of source materials, books, and references at ease and speed for my literature survey for research work. Secretariat of V. U. Industries Association and all industrialists, employees, for their all time help for information and permission to use all available data, references.
REFERENCES
[1] Agrawal, K.C., “A Review of Rash Globalization”, Shaping of India of our dreams, Knowledge Books Inc., India, pp.280-309, 2004.
[2] Agrawal, K.C. , “Causes of our industrial Failure”, Shaping of India of our dreams, Knowledge Books Inc., India,pp. 137-158,2004.
ISSN: 2319-8753
International Journal of Innovative Research in Science,
Engineering and Technology
(An ISO 3297: 2007 Certified Organization)
Vol. 2, Issue 11, November 2013
[4] Bandyopadhyay, PabirKumar, “Productivity in 21stCentury”- Issues and Challenges, ICFAI, Books, Hyderabad, Education in South Asia, New Delhi, 2006.
[5] Beatty, James R., ‘the quality journey: Historical and workforce perspective and the assessment of commitment to quality’, International Journal of productivity and management .Vol.1, Nos.1/2, pp.139-167, 2010.
[6] Chug,C.K.and Dixit,R.K. “A study of qualifications and Experience of mechanical engineering Teachers of Madhya Pradesh, India”, Journal of Engineering, Science and ManagementEducation,NITTTR,Bhopal,Vol.1,pp.70-73,2010.
[7] Goel, Bharat, and Dewan, Bhushan, “Factorsaffecting consumer preferences of shopping at organized retail stores in Punjab”, Journal of Engineering, Science and Management Education, NITTTR, Bhopal, Vol.4, pp.44-49, 2011.
[8] Heizer, Jay and Render Barry, “Operations Management”, Prentice-Hall, International Inc., New Jersey, 1999.
[9] Jani, H.J. Ph.D. Thesis,“Quality Management in Indian Companies through ISO 9000”, Sardar Patel University.Vallabh Vidyanagar, 2004. [10] Levin, Richard and, Rubin David, “Statistics for Management” Prentice- Hall of India, New Delhi, 1997.
[11] Malhotra Naresh K., “Marketing Research- an Applied Orientation” fifth edition, Pearson, New Delhi, 2009.
[12] Manishkumar, Himansu Rai and Surya Prakash Pati, an Exploratory Study on Negotiating Styles: Development of a Measure, Vikalpa, The Journal for Decision Makers, Indian Institute of Management, Ahmadabad, India, Volume34, No.1, Jan-March, pp.31-45,2009.
[13] Mishra,Priti Suman and Mohapatra,A K DASBuddhapriya,Sanghamitra, “Relevance of Emotional Intelligence for Effective Job
Performance: An Empirical Study”, Vikalpa,The Journal for Decision Makers, Indian Institute of Management, Ahmadabad, India,Volume35,No.1,January-March,pp.53-61,2010.
[14] Nargundkar Rajendra, “Marketing Research-Text and Cases”, Tata McGraw-Hill Publication, New Delhi, 2005.
[15] Pandya, K.J., “Ph.D.Thesis, Consumer Behaviour in Two Wheeler Industry: A case study of Motorcycle users in the state of Gujarat”,
Sardar Patel University, Vallabh Vidyanagar, 2010.
[16] Reddy, Y.V. AND Niak Subhas S., “Determinant of Goan SME firms going global: Theoretical and Empirical Approach”,Vikalpa. The
Journal for Decision Makers’ Indian Institute of Management, Ahmadabad, India, Volume 36,No.2,April-June,pp.45-58,2011. [17] Robert H. Carver and Jane Gradwohl Nash, “Doing Data Analysis with SPSS Verson18.0”,Cengage LEARNING, India, 2013.
[18] Sangeeta Shah Bharadwaj and Kul Bhushan C Saxena, “Service Providers’ Competences in Business Process Outsourcing for Delivering
Successful Outcome: An exploratory Study”, Vikalpa, The Journal for Decision Makers, Indian Institute of Management, Ahmadabad, India,Volume35,No.3,July-Sept.,pp.37-54,2010.
[19] Seth,Anita,Momaya K,and Gupta, “Managing the Customer Perceived Service Quality for Cellular Mobile Telephony: An Empirical
Investigation”, Vikalpa,The Journal for Decision Makers, Indian Institute of Management, Ahmadabad, India,Volume33,No.1,Jan-March,pp.19-34,2008.
[20] Sharma, K.V.S, “Statistics Made Simple, Do it yourself on PC”. PHI Pvt. Ltd, New Delhi, 2006.
[21] Sharma, Krishna Mohan, Dubey, D.K. and Pandey B.D., “Customer perception of store brands vs. National brand in select area of
Maharashtra”, Journal of Engineering, Science and Management Education, NITTTR, Bhopal, Vol.4, pp.59-65, 2011.
BIOGRAPHY
Dr.T.B.Pankhania is an Associate Professor in Mechanical Engineering and Head, Workshop at B.V.M. Engineering College,
Sardar Patel University, Vallabh Vidyanagar. He obtained his B.E. (Mech), M.E. (Mech), and Ph.D. from Sardar Patel University (SPU); Vallabh Vidhyanagar.His profile includes a stint of over 36 years of experience. He played a pivotal role in developing layouts of infrastructural facilities of workshops of various engineering colleges and an industrial training centre. His current areas of research include “Industrial performance leading to higher productivity. He has published his 16 research papers in national and international journals and presented 6 research papers in International conferences. He authored one book on Engineering Mechanics.
Prof.Akil H.Jariya is an Assistant Professor in Production Engineering at B.V.M. Engineering College, Gujarat
Technological University, Ahmadabad; He obtained his B.E. (Mech.) from Bhavnagar University, Gujarat and M. Tech. (Mech.) from Nirma University, Ahmadabad, Gujarat. His current areas of interest are CAD/CAM, Industrial Engineering and Managing Project.
V.K.Modi is a Lecturer in Mechanical Engineering at B & B Institute of Technology, Vallabh Vidyanagr. He obtained his