LINKAGE I N UPLAND COTTON’
S. G. STEPHENS
Genetics Faczclty, North Carolina State College, Raleigh, N . C.
Received May 23, 1955
LTHOUGH the genetics of Gossypium has been studied intensively for more
A
than thirty years, very few linkages have been reported. I n the amphidiploid species to which the Upland (hirsutum) cottons of cultivation belong only four linkage groups have been identified. These are:(1) Red (&)-cluster
(a)
(2) Green Lint (Lg)-crinkle (cr)(3) Petal Spot (&)-short-branch (cZz) SILOW (1946) (4) Petal Spot (&)-yellow-green (ygz) RHYNE (1955)
HARLAND (1939) HARLAND (1939)
STEPHEXS (1950) found a third locus, corky ( c k ) which was closely linked with crinkle, but its position relative to Green Lint was not determined. Two other possible link- ages have been reported (HUTCHINSON 1946; KNIGHT 1952) but these have not been critically established. A possible linkage between lint color (Lcz) and ygz was indicated by RHYNE (1955) but his data were incomplete.
The small number of linkages identified may be attributable partly to the fact that there are twenty-six pairs of chromosomes in the amphidiploid genome, and partly because no systematic search for linkage has been undertaken. Independent segregations, though often observed, have rarely been reported. Such reports as exist are subordinate to publications of work carried out for a different purpose, and as a result the existing information is widely scattered through the literature. At the present time there is considerable interest in the comparative cytogenetics of the amphidiploid cottons and their diploid relatives. These studies are a t present limited by the small number of suitably marked stocks which are available as testers. Genes which are suitable as markers have been maintained in separate stocks; for systematic cytogenetic analysis it is desirable to have them available in relatively few, “multiple marker” stocks with linked genes incorporated in the most convenient (coupling or repulsion) phases for testing.
For several years the author has been engaged in synthesizing multiple marker stocks, and in the process, families have become available which are segregating simul- taneously for a large number of marker genes. It has been possible to use this material in a systematic search for linkages. As a result, five new linkages have been discovered and a number of independent loci established. Both are important in providing a basis for future mapping of the amphidiploid genome.
MATERIALS AND METHODS
;\lost of the data to be reported were obtained from crosses involving marker genes already available in Upland stocks. A small number of segregations from inter-
TABLE 1
List of loci tested for independence. The mutant form of the locus (i.e. as contrasted with the “normal” jorm found most commonly i n cultivated Upland stocks) is listed i n each case
Name
cluster crinkle crenate
cup leaf
f rego-bract Pilose Narrow Leaf Brown Lint
Brown Lint
Green Lint Naked Seed
Yellow Pollen Red Plant Petal Spot Dwarf Red virescent yellow Yellow Petal yellow-green
Reference or description
H & S t H & S
Sometimes called “round leaf”. Very variable in expression,
LEWIS (unpub.). Phenotypically similar to Asiatic “curly”
GREEN (in press).
SIMPSON (1947); KNIGHT (1952). H & S
H & S; RICHMOND (1943); BRAIN (1950). Includes “Nankeen”, “Algerian” etc. allelic series (WARE unpublished). Includes a t least two distinct brown alleles, “Higginbotham”
and “Brymer” as described by WARE (1932) and BRAIN (1950).
lobes of leaf being irregular, reduced or absent.
(H 82 S)
H & S
The symbol, N , is in common usage and is therefore preferred
H & S H & S H & S JOHNSON (1949) H & S H & S RHYNE (1955)
to Fn in H & S nomenclature.
* Proposed new symbol.
t H & S refers to HUTCHINSON and SILOW (1939).
8 The symbol Fg was proposed by H & S to indicate Green Fuzz. Since Green Fuzz appears to be an allele of Green Lint, Lg, (STEPHENS unpublished), the symbol Fg is no longer applicable to this character.
Superscripts omitted from symbols.
specific hybrids was also studied. The marker loci tested are listed in table 1. Genes previously reported in the literature are given the symbols assigned to them by HUTCHINSON and SILOW (1939) except that superscripts have been omitted. Their system of nomenclature is rather impractical but no suitable revision has yet been a t tempted.
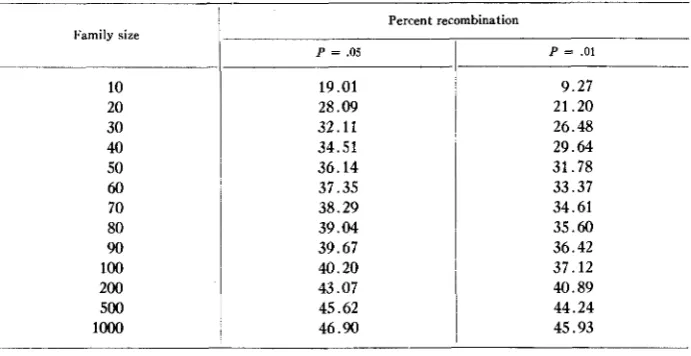
In the primary screening for linkage groups, backcrosses were always employed, since these provide more reliable information per unit of family size. For economy of space the complete four class segregation for each recombination studied is not pre- sented. By listing only the percentage recombination and family size, it is possible to summarize the results in a tabular form (fig. 1). For convenience in evaluating the results the maximum crossover values which are distinguished from independence in a given family size a t the 5% and 1 % levels of significance are listed in table 2.
LIXKBGE I N UPLAND COTTON 905
41.6 53.2 10.3 52.2
’
I
U31 80 113851.9
80
49.3
73 Le1
k2
X d I
I
I
FIGURE 1.-Linkage relations in Upland cotton. The results of testing 18 mutant loci are pre- sented based on 110 of the possible 153 paired combinations. The upper figure in each cel1,is the percentage recombination obtained in testcrosses; if it deviates from independence at the 552 level
of significance the figure is underlined. The lower figure in each cell is the family size.
Let n be the number of plants in a backcross family and r be the number of recom- binations. Deviation from independence is then calculated as a
x?
value,TABLE 2
M a x i m m percent recombination d i i c l t i s distinguished from independence in backcross segregations,
for various sizes of family and with two levels of precisiolt (P = .OS and P = .01)
I'amily size
10 20 30 40 50
60
70 80
90
100
200 500 lo00
Percent recombination
P = .os
19.01 28.09 32.11 34.51 36.14 37.35 38.29 39.04 39.67 40.20 43.07 45.62 46.90
P = .01
9.27 21.20 26.48 29.64 31.78 33.37 34.61 35.60 36.42 37.12 40.89 44.24 45.93
For a significant deviation from independence at the 5 % level this
x 2
should be 3.841 or greater (from the appropriate tables). Thus r = ( n-
d m n ) / 2 . By substi- tuting a series of values for n, the corresponding values of r can be determined. These are expressed in percent (100 r / n ) in table 2. Similarly, a t the 1% level, r = (n - 4 6 . 6 3 5 n ) / 2 . I t will be noted that except for the detection of very loose linkages, there is little advantage in increasing the family size above 100 plants.EXPERIMENTAL RESULTS
I n figure 1 significant departures from independence a t the 5% level are under- lined. Of the one hundred and ten combinations of loci tested for independence, seven were found to be linked. The complete backcross data for these seven combinations, supplemented by Fz data when available, are shown in tables 3-9.
Linkage between
RI
and cllThe data shown in figure 1 indicate 16.7% crossovers between these two loci. As this linkage has been repeatedly observed the detailed analysis of the data will not be presented here.
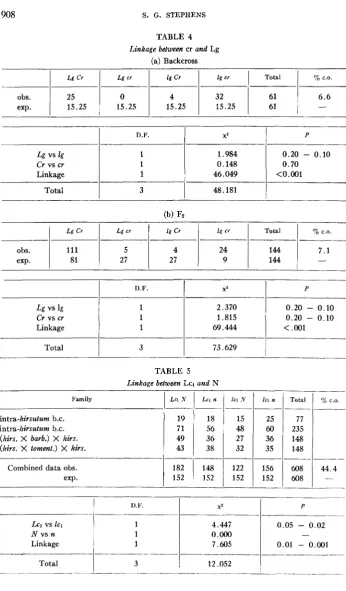
Linkage between cr and L
Four backcross families, all in coupling gave homogeneous segregations (table 3a).
Linkage was significant and a crossover value of 41.2% was obtained. These data are confirmed by the results of a single Fz family, also in coupling, shown in table 3b.
Despite a significant deficiency of crinkle segregates, linkage is significant and the crossover value of 41.1 % is practically identical with the backcross estimate.
Linkage between cr and Lg
LINKAGE I N UPL.4ND COTTON 907
ObS.
exp.
TABLE 3
Linkage between cr and L
(a) Pooled data from 4 backcrosses
L Cr I Cr I cr Total A C.O.
76 68
1
245-I
41.261.25 61.25 61.25 61.25 ~ 245
1
-D.F. x'
~~ - ~- .________--
L vs 1 1 0.004
Cr vs cr 1 0.918
Linkage 1 7.547
~ _ _ _ _ _ _ _ _ _ _ _ _ _ _ _ _ _ _ __
Total 3
i
8.469P
.___
> 0 . 9 0 0.50 - 0.30 0.01 - 0.001
(h) Single Fy family
L Cr 1 cr
80 50
124
I
124 41____-- _ ~ _ _ _ _ _
~ -
ohs. 400
exp. 372
Total
661 661
-
_ _ ~ -
____ ~
L vs 1
Cr vs cr
Linkage
9;. C.O.
41.1
-. . -
-
-
D F.
1 1 1
~ _ _ _ _ _ ~ - X 2
P
0.20 - 0.10
10.026 0.01 - 0.001
7.915 0.02 - 0.01
19.943
1
I
Total 3
Linkage beiween Lcl and
K
Four backcross families were examined, all in the coupling phase. Because two of the families involved only Upland (hirsutum) parents, while the others were inter- specific first backcrosses (barbadense -+ hirsutum, and tomentosum -+ hirsutum) their segregations are presented separately in table 5. The segregations in the four families were homogeneous
(x'
for 9 degrees of freedom = 3.61; P = 0.95-
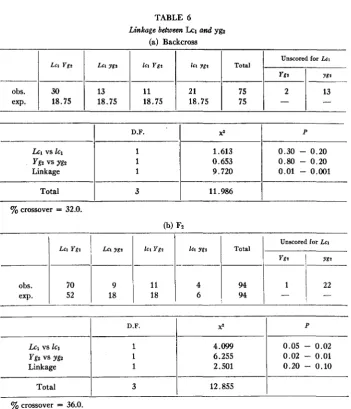
0.90) and their combined data showed significant evidence of linkage. A crossover estimate of 44.4% was obtained. There was a slight excess of Lcl segregates which was not significant in any of the individual families, though detectable in the combined data.Linkage between Lcl and yg2
Plants homozygous for yellow-green (yg2 yg2) are very late in flowering, and as a
result an appreciable number fail to mature seed in a normal growing season. This introduces an error in testing for linkage between yez and the seed-hair character,
Lcl. One backcross and one F2 family (both in coupling) were examined (tables 6a
Lg Cr Lg cr
obs. 25 0
exp. 15.25 15.25
l g CY l g cr Total % C.O.
4 32 61 6.6
-
15.25 15.25 61
TABLE 4
Linkage between cr and Lg
(a) Backcross
D.F.
Lg vs lg 1
Linkage 1
Cr vs CY 1
XZ P
~
1.984 0.20 - 0.10
0.148 0.70
46.049 <0.001
Lg Cr
obs. 111
exp. 81
Total
I
3I
48.181I
-
Lg cr l g Cr 2~ cr Total % C.O.
5 4 24 144 7.1
~ ~ _ _ _ _ _
27 9 144 -
27 I
D.F.
Lg vs lg 1
cr
vs CY 1Linkage 1
Total 3
~
X* P
2.370 0.20 - 0.10 1.815 0.20 - 0.10 69.444
<
,00173.629
______--~-___-__c__
TABLE 5 Linkage between Lcl and N
Lei .V
___ 19 71 49 43 182 ____ Family
intra-hirsulum b.c. intra-hirsutum b.c. (hirs. X barb.) X lzirs. (hirs. X toment.) X him.
L a n
___ 18 56 36 38 148 ___ Combined data obs.
exp.
-
[ t i .V
15
27 32
122 152
161 n
25 4 8 6 0
36 35 156 152 __ ___. Total 77 235 148 148 608 608
'3(, C.O.
-_I__
LINKAGE I N UPLAND COTTON
LCl Ygt Ln ygx 161 Ygr
obs. 70 9 11
exp.
I
52 18 18909
Unscored for LCI
l a ygt Total
y g r
I
yg24 94
6 94
TABLE 6
(a) Backcross
Linkage between Lcz and ygz
D.F. 2
Lc, vs IC1 1 4.099
Ygz vs yg2 1 6.255
Linkage 1 2.501
Total 3 12.855
Unscored for Lcl
I
LCI Ygt1
L a ygt1
161 YgzI
l a YgzI
Total1
Ygr
I
Y8tP
0.05
-
0.02 0.02-
0.01 0.20-
0.10obs.
1
301
131
111
21I
75I
21
13-
-
exp. 18.75 18.75 18.75 18.75 75
P
I
xz1
D.F.
I
Lc, vs IC1
Ygz vs ygz
Linkage
1.613 0.653 9.720
0.30
-
0.20 0.80-
0.20 0.01-
0.001Total
1
3I
11.9861
yo crossover = 36.0.
to produce seeds. Estimates based on the remaining plants give crossover values of
32.0% and 36.0% for backcross and F2 respectively. These values may be over-
estimates. Both in the backcross and in the F2 the recombination classes, Lc1 yg2
and Zcl Yg2, are approximately equal while the noncrossover class Zc1 yg2 is deficient. This suggests that the majority of the yg2 plants unscored for lint color might be of the constitution Zcl yg2, in which case the crossover estimates obtained might be
10%-15% in excess of their true values. Independent evidence that the overestimate is not as serious as this will be presented later.
Linkage between R2 and yg2
Re vs rz
Linkage I’g vs >‘,‘fiL
0.337 0.70 - 0.50
0.758 0.50 - 0.30
1
68.400 <0.001I
I D . F .
I
X 2I
P0.30 - 0.20
0.664 0.50 - 0.30
1
33.653 <0.001both in coupling, are shown in table 7. The single gene ratios did not deviate sig- nificantly from expectation and the crossover estimates of 20.0% and 22.3% are in reasonably good agreement.
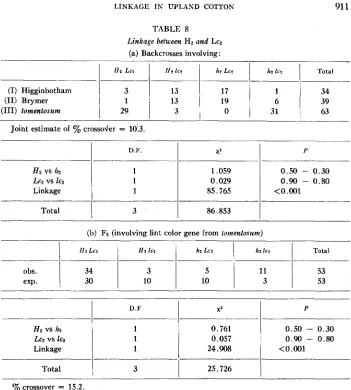
Linkage between H2 and Lcz
LINKAGE IN UPLAXD COTTON 91 1
TABLE 8
Linkage between H? and Lc2 (a) Backcrosses involving:
I12 L c 2
(I) Higginbotham 3
(11) Brymer 1
(111) lomentosum 29
I 1 2 IC2 112 L c 2
I
lzz lcz Total13 17 1
I
3413 19 39
3 0 3;
1
63Joint estimate of ’% crossoder = 10.3.
_______
I
D.F.I
X 2I
PHz VS 112
h 2 vs 162 Linkage
1
1 1
1.059 0 .5 0 - 0.30
0.029 0.90 - 0.80
85.765
______
obs. exp.
Total
I
3I
86.8531
IIZ L C ? I J 2 IC2 h 2 Lc2 1&2 IC2 Total
I _ _ _ _ ~
11 53
10 53
34 3
30 10
(b) F2 (involving lint color gene from lomenlowm)
1
1
1
0.761 0.50 - 0.30
0.057 0.90 - 0.80
24.908 <0.001
D.F
I
XZI
PI
H? VS lz, L G Z vs IC?
Linkage
Total
1
3I
25.7261
~~~
yo crossover = 15.2.
neither in respect of the single gene segregations nor in the linkage component. From the combined families a joint estimate of 10.3% crossovers was obtained.
A single Fz segregation (actually from a selfed brown lint segregate from a second backcross of lomentosum to hirsutum) was also examined (table 8b). The segregation is in coupling. An estimate of 15.2% crossovers was obtained which does not agree too well with the backcross estimate.
Double crossowrs
The seven linked pairs of loci (fig. 1) include one four point and one three point linkage group. These are:-
LC, Yg2
RP
LR
_________
1 ”
44.4 3 2 . 0 20.0
-~
L cr
Noncrossovers 87
Doubles 64
Singles (N
-
Lcl) 68Singles ( L t l
-
R2) 86Total 305
-
______Unfortunately only three groups of the families available were segregating concur- rently for more than two pairs of loci belonging to the same linkage group. These all involved the four point linkage N-Lcl-ygz-Rz. The map intervals are rather large, N being very loosely linked with Lc1, and the linkage between Lc1 and RP only detectable by segregation in the intervening locus, yg2. Also the total map distance has a mini- mum value of 96.4, so that no interference would be expected. The results from three groups of backcross families, each testing recombinations from 3-point linkages, are summarized in table 9. Interference is measured as a departure from independent crossing over in adjacent regions, using a form of contingency test for which I am indebted to DR. R. C. LEWONTIN. I n any 3-point linkage, A-B-C, let
pl
andp2
be the chances of a crossover occurring in the A-B and B-C interval, respectively. IfP 2 64 86 150
(1 - P 2 ) 68 87 155
--___
_ _ _ _ _ _
Total 132 173 305
x2 (1) = 0.045; P = 0.90 - 0.80 TABLE 9
Double crossovers i n the N
-
LCI-
ygz-
R2 region with appropriate tests for independence. In the contingency tests, pl and p2 represent the chances of obtaining a crossover i n the right and left mapinterval respectively. For further explanation see text
Noncrossovers 29
Doubles 1
Singles (yg2
-
R2) 16Total 67
Singles ( h
-
ygz) 21__
Contingency test for independence. Backcross data
I
$1I
(1 - $1)I
Total(a) N
-
LCI - R2 ( M a p distance = 96.4)p: 1.5 15.5 1 7 . 0
(1 - p2) 20.5 29.5 50.0
Total 22.0 45 .O 6 7 . 0
x2 (1) = 5.956; P = 0.02 - 0:Ol (b) N - Lcl
-
yg2 (Map distance = 76.4)Noncrossovers Doubles
Singles (N
-
Lcl) Singles (Lcl-
y e )_____________
X' (1) = 0.150; P = 0.70 - 0.50 Total
LINKAGE I N UPLAND COTTON 913
4 Total Mean
---
1 1 26 0.692
j 0.9 l 26
c7u
-
TABLE 10
Variance
1.102 -
No. of loci per chromosome
l o 1 1 1 2
observedexpected
xZ ( 2 ) 2.486; P = .30 - .20.
there is no interference ( p l independent of p z ) the expected composition of the result- ing gametic classes will be:-
Noncrossovers Singles
(A-B)
Singles
(B-C)
(1
-
pl)(l-
$4)pl
(1-
p z )pz
(1-
PI)
Doubles $1 P,
Total 1
Hence departures from expectation are indicative of interference and can be measured with a 2 X 2 contingency test in the usual way (table 9).
The data show no evidence of interference in the map intervals, N-Lc1 and Lcl-R2 (table 9a) nor in the map intervals, N-LcI and Lcl-ygz (table 9b). However there is a significant departure from independence in the map intervals, Lcl-ygz and yg2-Rz (table 9c). The family size is small, nevertheless the recovery of only one double cross- over in a map distance of 52 units is surprisingly low (coincidence = 0.18).
As
mentioned earlier, there is reason to suspect that the map distance between Lcl and ygz may be overestimated. However, the fact that there is no detectable linkage between the Lcl and Rz loci means that they cannot be separated by much less than 50 crossover units. Since the distance between yg2 and RZ is of the order of 20-22 units, the minimal distance between Lcl and ygz should be 50 minus 22, i.e. 28 units as compared with the probable overestimate of 32% in table 6a.DISCUSSION
Distribution of mutant loci
The eighteen mutants tested fall into a maximum of eleven linkage groups:- (1) N-Lcl-yfi-Rs
(2) L-CY-Lg ( 3 ) Ri-cll
(4) H r k
with seven other loci (cn, cu, fg,
P,
Rd, v and Y1) independent of each other and ofthe other four linkage groups. The remaining fifteen chromosomes of the total set of
10) do not differ significantly though there is a tendency for too many chromosomes to carry no mutant loci and for too many mutants to be concentrated in multiple linkage groups. In spite of its statistical nonsignificance there are four reasons for believing this tendency to be a real one:
(1) In a sample conforming to a Poisson distribution the mean and variance should have the same order of magnitude. The observed data in table 10 have a variance almost twice as large as the mean.
(2) The number of linked combinations recorded in figure 1 might be an under- estimate. Owing to limitations of family size, loose linkages might escape detection. (3) Only 110 out of the possible 153 combinations were tested (fig. 1). The combina- tions not tested might have revealed additional linkages.
(4) Two other mutant loci, not tested here, are known to belong to existing linkage groups. These are 612 in linkage group 1 and ck in linkage group 2.
All these factors suggest that the proportion of linked combinations is greater than has been detected and that as a consequence, the proportion of independent linkage groups should probably be smaller. In table 10 this should have the effect of increasing the frequencies of chromosomes with 2 and 3 loci a t the expense of those with 1 locus and therefore of producing a wider departure from the Poisson distribu- tion. On the whole it seems likely, though not proven, that the mutant loci are not randomly distributed but tend to be concentrated in certain chromosomes.
Since the hirsutum cottons are amphidiploids, a possible explanation of a non- random distribution of mutants might be a historical one, namely that one of the diploid parents had more mutable loci than the other. Evidence on this point is meager a t present but so far does not favor this interpretation. Since HARLAND (1935) showed that R2 was located in the A subgenome it follows that the other three genes in linkage group (1) are also located there. HUTCHINSON (unpublished) showed that a green lint gene occurring in the diploid D species, G. armourianum, was homologous with Lg in hirsufum and also linked with crinkle (6.). Later GREEN
(1953) showed that the leaf-shape gene of another diploid D species, G. thurberi, was an allele of the L series in hirsutum. Clearly the genes in linkage group (2) are located in the D subgenome. Linkage group (3) is in the D subgenome (HARLAND 1937). Linkage group (4) is still unlocated. The unlinked loci,
P
and Y1, are both inthe A subgenome (STEPHEKS 1954a, b). Two other loci, not tested here, have also been located; corky (ck) in the D subgenome (STEPHENS 1950) and short-branch
(CL) in the A subgenome (SILOW 1946). Altogether, there are six loci definitely placed in the D subgenome and seven in the A subgenome. This suggests that a nonrandom occurrence of mutants would be associated with differences between specific chromo- somes and not between chromosome sets.
The question of chiasma frequency
I.INK.4GE IK UPIAND COTTOS 915
“usually terminal or nearly so”. The conclusion therefore seems justified that 012 the
az’erage the hirsufum chromosome has one chiasma in each arm a t metaphase I. Meiotic prophase stages in cotton are technically difficult to study, and as yet there is no reliable evidence to determine whether the low chiasma frequency a t metaphase is the result of terminalization, or of a low initial frequency a t pachytene. In Asiatic cottons, SKOVSTED (1933) observed a maximum of three chiasmata per bivalent be- tween diplotene and metaphase, but the number of cells examined was not recorded and in any case his observation cannot be directly applied to the situation in other species of Gossypium. The question is important, because an initially low chiasma frequency a t pachytene should limit the rate of genetic recombination in a hybrid population. I t may account for certain discrepancies which are found when ap- parently identical genes are transferred by backcrossing to a “common” background
(STEPHENS 1945).
The mapping of hirsutum chromosomes, here commenced, should make possible a critical examination of the initial chiasma frequency. If the hypothesis of one chiasma in each arm is valid, one could predict that on the average the total map distance for a hirsutum chromosome would be of the order of 100 crossover units (50 per arm) and that double crossovers within any arm should be rare or nonexistent. Interference should be a common phenomenon and tend to be independent of map distance. The linkage groups at present available are quite inadequate to test the hypothesis, but it is interesting that the N-Lcl-yg2-R2 linkage group seems to be in agreement with it. Here the map distance is 96.4, crossing over to the left of Lc1 is independent of crossing over to the right of this locus, and there is practically com- plete interference between the intervals on either side of yg2. The interference cannot be attributed to proximity of two short intervals since the total distance between Lc, and R2 must be of the order of 50 units or greater. The simplest interpretation a t present is that a chiasma regularly formed in the left arm usually occurs between N and the centromere and that a chiasma regularly formed in the right arm falls either between the centromere and yg, or between yg, and the end of the right arm. Only rarely is a second chiasma formed in the right arm. On this interpretation, the dis- tance of about 50 units between Lcl and
R,
would indicate that these loci are situated near the centromere and near the end of the right arm respectively (fig. 2). It should be fairly simple to test the validity of this interpretation as new loci are added toN
0
76
96
v
FIGURE 2.-Provisional genetic map of linkage group 1 in Upland cotton. The open circle indicates the probable position of the centromere, based on the assumption that on the average only one chiasma is formed per arm, and that as a consequence the total map distance is approximately 100
units.
the linkage group. If it is substantially correct, few loci should be discovered to the left of N or to the right of R2 and all new map intervals associated with placement of additional loci should exhibit interference with either or both of their adjacent map intervals and irrespective of their map distances.
The location of short-branch, cl2, is of particular interest in this connection. It is known to be approximately sixteen map units away from R2 (SILOW 1946). On the interpretation presented here it would be expected that cls would be located to the right of yg2 and closely linked with it.
SUMMARY
Eighteen loci in Upland cotton have been screened for linkages, 110 of the possible 153 paired combinations of loci being tested in appropriate backcrosses. Seven linked combinations were obtained which could be arranged in
4
linkage groups as follows (testcross data only):(A subgenome)
(2) L CT Lg (D subgenome)
41.2 6.6
(D subgenome)
unknown
The correct order of cZ2 in (1) and ck in (2) is not yet established. There is an apparent
tendency for the mutant loci to “cluster” in specific chromosomes, though the num- bers are not large enough to demonstrate a significant departure from a random (Poisson) distribution. However, of the 18 mutants tested 7 can be shown to be located in the A subgenome and 6 in the D subgenome, so that any departure from random distribution would be associated with specific chromosomes rather than specific subgenomes. The metaphase I chromosome in Upland cottons has typically a median or submedian centromere and one chiasma in each arm. If this chiasma frequency represents a low initial frequency rather than the result of terminaliza- tion, one could predict that genetic map distances should approximate to 100 units (50 per arm) and that double crossovers should be rare or absent in any one arm, irrespective of map distance. I t is pointed out that the information available from linkage group 1 is not a t variance with this prediction.
LITERATURE CITED
BRAIN, S. G., 1950
GREEN, J. M., 1953
HARLAND, S. C., 1935
Heritable relationships of brown lints in cotton. Agron. J. 42: 188-191. Sub-okra, a new leaf shape in Upland cotton. J. Heredity 44: 229-232. 1955 Frego-bract, a genetic marker in Upland cotton. J. Heredity (in press).
LINKAGE I N UPLAND COTTON 91 7
1937 Homologous loci in wild and cultivated American cottons. Nature 140: 467-468. 1939 The Genetics of Cotton. London, Jonathan Cape. P. 193.
HUTCHINSON, J. B., 1946 The inheritance of brown lint in New World cottons. J. Genet. 47: 295- 309.
HUTCHINSON, J. B., and R. A. SILOW, 1939 Gene symbols for use in cotton genetics. J. Heredity 30: 461-464.
JOHNSON, B. L., 1949 Complementary factors for dark-red plant color in Upland cotton. J. Agr. Research 78: 535-543.
KNIGHT, R. L., 1952 The genetics of Jassid resistance in cotton. I. The genes H I and H2. J. Genet. 61: 47-66.
MENZEL, MARGARET Y., and META S. BROWN, 1954 The tolerance of Gossypizim hirsulum for deficiencies and duplications. .4m. Naturalist 88: 407-418.
RHYNE, C. L., 1955 The inheritance of yellow-green, a possible mutation in cotton. Genetics 40:
RICHMOND, T. R., 1943 Inheritance of green and brown lint in Upland cotton. J. Am. Soc. Agron.
SIKKA, S. M., IHSAN-UR-RAHMAN KAHN, and M. AFZAL, 1945 Study of somatic chromosomes of
SILOW, R. A., 1946 Evidence on chromosome homology and gene homology in the amphidiploid
SIMPSON, D. M., 1947 Fuzzy leaf in cotton and its association with short lint. J. Heredity 38:
SKOVSTED, A., 1933 Cytological studies in cotton. I. The mitosis and the meiosis in diploid and
1934 Cytological studies in cotton. 11. Two interspecific hybrids between Asiatic and New World
A genetic survey of leaf shape in New World cottons. J. Genet. 46: 313-330. 1950 The genetics of “Corky”. 11. Further studies on its genetic basis in relation to the general
1954a Interspecific homologies between gene loci in Gossypium. I. Pollen color. Genetics 39:
1954b Interspecific homologies between gene loci in Gossypium. 11. Corolla color. Genetics 39:
235-245.
36: 967-975.
some wild and cultivated species of Gossypium. Indian J. Genet. and P1. Br. 4: 55-68.
New World cottons. J. Genet. 47: 213-221.
153-156.
triploid Asiatic cotton. Ann. Botany London 47: 227-251.
cottons. J. Genet. 2 8 407-424. STEPHENS, S. G., 1945
problem of interspecific isolating mechanisms. J. Genet. 60: 9-20.
701-71 1.
712-723. WARE, J. C., 1932
WOUTERS, W. 1948 Contribution