PV Power System Using Maximum Power
Point Tracking (Increment Conductance
Algorithm)
Mohammed Ali Khalifa
1, Kamal Mohamed Saied
2,Sami Salem Bitro
3, Miftahul Anwar
4, Muhammad
Nizam
5P.G. Student, Department of Mechanical Engineering, Sebelas Maret University, Surakarta, Indonesia1
P.G. Student, Department of Mechanical Engineering, Sebelas Maret University, Surakarta, Indonesia2
P.G. Student, Department of Mechanical Engineering, Sebelas Maret University, Surakarta, Indonesia3
Associate Professor, Department of Mechanical Engineering, Sebelas Maret University, Surakarta, Indonesia4
Professor, Department of Mechanical Engineering, Sebelas Maret University, Surakarta, Indonesia5
Abstract: This paper demonstrates the comparative study between Boost and Cuk DC-DC converter using maximum power point tracking (MPPT) incremental conductance (ICA) algorithm. cuk converter use for comparative. Few parameters such as voltage, current and time response at different combination has been measured. Matlab simulink software was applied for performance evaluation on energy point. Simulation was considered different solar irradiance and temperature variations. And simulation results showed that cuk converter better than boost in terms of time responsee and the ripple voltage.
Keywords: maximum power point tracking, MPPT, photo voltaic, PV, direct current, DC DC Introduction
I.INTRODUCTION
[6], [9], etc. In this paper two most popular of MPPT technique (Perturb and Observe (P&O) methods and Incremental Conductance methods) and three different DC-DC converter (Buck, Boost and Cuk converter) will involve in comparative study Figure (2) [11]
Fig. 1: Block diagram of Typical MPPT system
Fig. 2: DC – DC converter for operation at the MPPT
Few comparison such as voltage, current and power out put for each different combination has been recorded. Multi changes in duty cycle, temperature by keeping voltage and current as main sensed parameter been done in the simulation. The DC converter techniques will be compared, by using Matlab tool Simulink, considering the variant of circuit combination.
II. BASIC THEORY
A. PV ARRAY
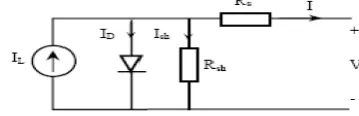
A solar panel cell basically is a p-n semiconductor junction. When exposed to the light, a DC current is generated. The generated current varies linearly with the solar irradiance The equivalent electrical circuit of an ideal solar cell can be treated as a current source parallel with a diode as shown in figure 3.
Fig. 3: Equivalent electrical circuit of a solar cell
The I-V characteristics of the equivalent solar cell circuit can be determined by following equations The current through diode is given by:
ID = IO [ exp (q(V + I RS)/KT)) – 1] (1)
While, the solar cell output current:
I = IL – ID – Ish (2)
Where:
I : Solar cell current (A)
I : Light generated current (A) [Short circuit value assuming no series/ shunt resistance] IO : Diode saturation current (A)
q : Electron charge (1.6×10⁻¹⁹ C) K : Boltzman constant (1.38×10⁻²³ J/K) T : Cell temperature in Kelvin (K) V : solar cell output voltage (V) Rs : Solar cell series resistance (Ω) Rsh : Solar cell shunt resistance (Ω)
B. BOOST AND CUK DC-DC CONVERTER
Boost Converter
The boost converter is also known as the step-up converter. The name implies it’s typically application of converting a low input-voltage to a high out-put voltage, essentially functioning like a reversed buck converter shown in figure 4
Fig. 4: Equivalent Circuit of a Boost Converter
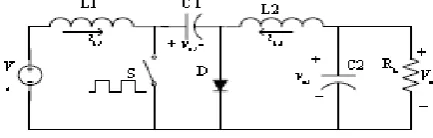
Cuk Converter
The Cuk converter uses capacitive energy transfer and analysis is based on current balance of the capacitor as showm in figure (5) Cuk converter will responsible to inverter the output signal from positive to negative or vise versa.
Fig. 5: Equivalent Circuit of Cuk Converter
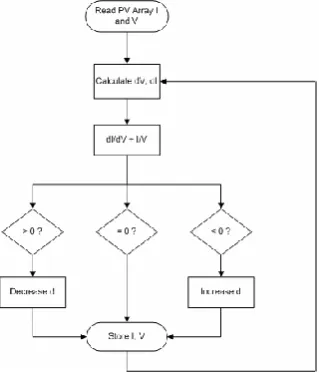
C. INCREMENTALCONDUCTANCE MPPT ALGHORITHM
The principle connotation of Incremental conductance over PV graphic of a solar module is shown in figure (6a & 6b). tendency of the P-V module power is zero at The MPP, increasing on the left of the MPP and decreasing on the Right of the MPP. The essential equations of this method are as follows:[14]
𝑑𝑃
𝑑𝑉= 0 at MPP 𝑑𝑃
𝑑𝑉< 0 right of MPP 𝑑𝑃
𝑑𝑉= 𝑑 𝑉𝐼
𝑑 𝑉 = 𝐼 + 𝑉. 𝑑𝐼
𝑑𝑉
The dP/dV is defined as Maximum power point identifier factor. By utilizing this factor, the IC method is proposed to
effectively track the MPP of PV array. The following definitions are considered to track the MPP.
𝛥𝐼
𝛥𝑉= −
𝐼
𝑉 at MPP, ΔVn = 0 𝛥𝐼
𝛥𝑉> − 𝐼
𝑉 left of MPP, ΔVn = + δ 𝛥𝐼
𝛥𝑉< − 𝐼
𝑉 right of MPP, ΔVn = - δ
Fig. 6(a): Graph Power versus Voltage for IC Algorithm
Fig. 6(b): Incermantal ConductancAlgorithm
III. METHODS
Fig 7: simulink model of Boost converter
In figure( 7) explains the boost converter circuit. 150 V DC voltage source passes through L = 6mH as a primary winding, an electric current at high speed by the IGBT switches then rectified by Diode3 and to minimize the ripple by a 1000 uF capacitor and R at 50 ohm load.
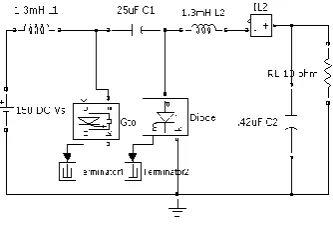
Fig 8:Simulink model of cuk converter
Figure 8 explains the Cuk converter circuit. 150 V DC voltage source passes through L = 1.3mH as a primary winding, an electric current at high speed by the IGBT switches then rectified by Diode and to minimize the ripple by a 0.42 uF capacitor and R at 10 ohm load
Fig. 9: simulink model for IC Algorithm
V. RESULT AND DISCUSSION
A. PV Panel Simulation
The figure (10(a) ) below illustrates the P-V Curve of PV Module at different Irradiation where X- axis has been symbolized by voltage (volt) range and Y- axis has been demonstrated by power (watt) level. Besides, The performance of PV cell has been depicted at different sub-division irradiation power level. Infact, The pink, blue, green, violet curve represents the irradiation power level at 1000, 750, 500, 250 w/m2 respectively.
Fig.10(a). P-V Curve of PV Module at different Irradiation
The figure (10(b) ) below explains the I-V Curve of PV Module at different Irradiation where X- axis has been symbolized by voltage (volt) range and Y- axis has been demonstrated by current (watt) level. Besides, The execution of PV cell has been depicted at different sub-section irradiation power level. Indeed, The pink, blue, green, violet curve represents the irradiation power level at 1000, 750, 500, 250 w/m2 respectively.
I-V Characteristics of PV cell
On whole, It can be said that both output current and power are directly proportional with changes in solar irradiation as expected from the model. Furthermore, The maximum output power as well as current of the module reduced to half when the solar irradiation droped to 500 W/m2. However, the open
circuit voltage did not change significantly.
B. Results of Converter Simulation
The figure (11) below illustrates the Output voltage for Cuk and Boost Converter where X axis has been symbolized by time (Second) and Y axis has been demonstrated by power (watt). Furthermore, Cuk and Boost converter have been characterized by two different colour. Infact, The red and blue curve have been represented by Cuk and Boost converter respectively.
Fig 11: Output voltage for Cuk and Boost Converter
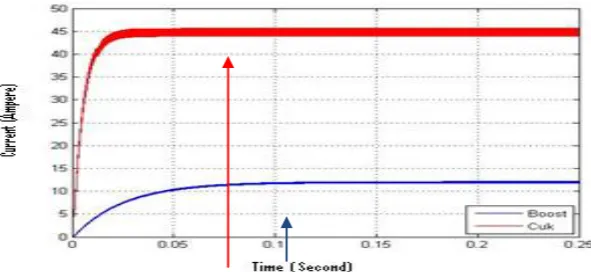
The figure (12) below illustrates the Output current for Cuk and Boost Converter where X axis has been symbolized by time (Second) and Y axis has been demonstrated by current (ampere). Furthermore, Cuk and Boost converter have been characterized by two different colour. Infact, The red and blue curve have been represented by Cuk and Boost converter respectively.
The figure (11) below illustrates the voltage ripple for Boost Converter where X axis has been symbolized by time (Second) and Y axis has been demonstrated by voltage (volt). Furthermore, the outcome of Boost converter has been characterized by blue colour.
Fig.13: Voltage Ripple for Boost Converter
The figure (11) below illustrates the voltage ripple for Cuk Converter where X axis has been symbolized by time (Second) and Y axis has been demonstrated by voltage (volt). Furthermore, the findings of Cuk converter has been characterized by blue colour.
Fig.14: : Voltage Ripple for Cuk Converter
COMPARISON BETWEEN BOOST AND CUK CONVERTER
Table 1. Comparison result between Cuk and Boost
Cuk Boost Comment
Voltage 450 V 600 V Boost higher
Current 44A 12A Cuk higher
Time Response 0.0025 sec. 0.125 sec. Cuk better Voltage ripple 452V–0.07 sec 608V-0.15sec Cuk better
From the comparison result, it can be remarked that the execution of Cuk converter was always better in case of all criteria than Boost converter except voltage result. Additionally, on the stability establishment point of view, finally it can be commented that cuk is better than boost converter.
VI.CONCLUSION
This paper has applied ICA and MPPT algorithm for the comparison between Cuk and Boost converter. The comparison result showed that the Cuk converter better over Boost converter because of (1) the achievement of stability voltage / current is only 0.025 second, while it took 0.12 second in terms of Boost, (2) voltage ripple is also smaller than Boost which is (11.48-11.53) and (14.8-15.2) amp respectively. It can be concluded that Cuk converter better than Boost in time response and the ripple voltage as shown Table 1.
REFERENCES
[1] Lewis , R. S., "Antartic Research and Relevant of Science," Bulletin of the Atomic Scientists, vol. 26, pp. 2, 1970.
[2] Chang , Y.-H., and Chang, C.-Y., "A Maximum Power Point Tracking of PV System by Scaling Fuzzy Control", International MultiConference
of engineers and Computer Scientists,Vol. II, March 17-19, Hongkong, 2010.
[3] Mekhilef, S., "Performance of grid connected inverter with maximum power point tracker and power factor control ", International Journal of
Power Electronics, vol. 1, pp. 49-62, 2008.
[4] Ahmad, M.E. , and Mekhilef, S., "Design and Implementation of a Multi Level Three-Phase Inverter with Less Switches and Low Output Voltage Distortation," Journal of Power Electronics, vol. 9, pp. 594-604, 2009.
[5] Chin, S. , Gadson, J., and Nordstrom, K. "Maximum Power Point Tracker," Tufts University Department of Electrical Engineering and Computer Science, pp. 1-66, 2003.
[6] Faranda, R. and Leva, S., "Energy Comparison of MPPT techniques for PV Systems," WSES Transaction on Power Systems, vol. 3, pp.
446-455, 2008.
[7] Vikrant.A.Chaudhari, "Automatic Peak Power Traker for Solar PV Modules Using dSpacer Software.," Maulana Azad National Institute Of
Technology vol. Degree of Master of Technology In Energy. Bhopal: Deemed University,, pp. 98, 2005.
[8] Lee, C. S. , " A Residential DC Distribution System with Photovoltaic Array Integration.," vol. Degree of Honors Baccalaureate of Science in
Electrical and Electronics Engineering, pp. 38, 2008.
[9] Esram, T. , and Chapman, P. L., "Comparison of Photovoltaic Array Maximum Power Point Tracking Techniques," 9. Urbana.
[10] Rivera, O. and E. I , "Maximum Power Point Tracking using the Optimal Duty Ratio for DC-DC Converters and Load Matching in
Photovoltaic Applications," IEEE, pp. 987-991, 2008.
[11] Adamidis, G. , Bakas, P. and A. Balouktsis, "Photovoltaic System MPPTracker Implementation using DSP engine and buck – boost DC-DC
converter."
[12] Azab, M. , "A New Maximum Power Point Tracking for Photovoltaic Systems," in WASET.ORG, vol. 34, pp. 571-574. 2008.
[13] Knopf, H. "Analysis, Simulation, And Evaluation of Maximum Power Point Tracking (MPPT) Methods for a solar power vehicle," in
Electrical and Computer Engineering, vol. Master of Science in Electrical and Computer Engineering: Portland State University, pp. 177. 1999.
[14] Selvan, S.D, Modeling and Simulation of Incremental Conductance MPPT Algorithm for Photovoltaic Aplications, International Journal of