A Case Study in Chair by Applying Quality
Function Deployment &Analytic Hierarchy
Process
Swarn Kumar
1, Anshuman Garnaik
2Research Scholar, School of Mechanical Engineering, KIIT University, Bhubaneswar, Odisha, India1
Research Scholar, School of Mechanical Engineering, KIIT University, Bhubaneswar, Odisha, India 2
ABSTRACT: Chair is used by people everywhere in classes, offices, hospitals etc. This case study is done in Lakshmi Enterprises, Odisha, India. They wanted to know more about customer‟s requirement and wanted to improve the standard of their current product. In this research paper, Quality Function Deployment & Analytic Hierarchy Process are used to find out about the need of customer. Quality Function Deployment is said to have taken birth in Japan around 1970. Quality Function Deployment makes the production process easier. It is also useful in increasing sales as the product is optimized as per the customer requirement. Analytic Hierarchy Process helps in acquiring weights of customer requirements.
KEYWORDS: Chair, Voice of Customer (VOC), Voice of Engineer (VOE), Quality Function Deployment (QFD), Analytic Hierarchy Process (AHP), House of Quality (HOQ)
I.INTRODUCTION
In current scenario, chair has a very vital role to play. It can be found everywhere. People like to work on it, sit on it etc. But there is also a set of requirement that people want to see in the chair. These requirements are known as Voice of Customer. The company motto should be to achieve all this goal as their utmost priority is to keep the customer happy and satisfied. This is company utmost priority because at the end of the day customer decides the fate of a company. Also, in order to make its place in the market company needs its product to sell out so that a profit is made within the company. When a product is designed, a designer should keep it in the mind that the customer requirements are logarithmically increasing at a fast pace. Quality Function Deployment is a process to help design the products that customer requires. By creating a series of sequential steps, Voice of Customer are converted into product. House of Quality is a key tool of Quality Function Deployment. Voice of Engineers includes the subject that how the customer requirements will be fulfilled. House of Quality comprises of technical attributes, customer requirements, absolute weight of both customer requirements & technical attributes, customer need weight, technical characteristic weight. Analytic Hierarchy Process is a multi-criteria decision making method in which real world life problems can be solved, no matter how complex is the problem. Analytic Hierarchy Process consists of these process-
1. Firstly, objective is defined.
2. Secondly, the elements are structured in alternatives.
3. Thirdly, a pair wise comparison of elements is made in each group. 4. Then, weights & consistency ratio is evaluated.
5. Eventually, alternatives are evaluated as per the weights.
II.RELATEDWORK
said that in AHP the decision can be inconsistent. The measurement of inconsistency and improvement in judgement are a crucial concern in AHP. A survey was made for determining which drink was consumed more in United States of America. Erkarslan and Yilmaz (2011) optimized the product design for a ceramic basin by the application of QFD & AHP. They examined that if QFD was applied during production phase, it increases the number of customer satisfied by the company which also results in increasing sales of the company. In the current paper, QFD given by Mazur (2008) is applied. Triantaphyllou and Mann (1995) inspected the actual as well as computational problems involved in engineering fields when the AHP method is implemented. AHP has convinced a number of researchers because of the mathematical characteristics of it and also that data needed for the calculation i.e. input data is very simple to obtain. Kamakura et al., (2005) said that in Customer Relationship Management one should always keep an eye on the behaviour of customer regarding the product and by utilizing this context, a solution should be formed which is acceptable to both, the customer and the company. Rababah et al., (2011) said that present situation is competitive for companies and also there is an exponential rate of increase in technology. Customer Relationship Management will help the company to get guarantee success and ensure the growth. It also helps in recognizing the customer and their needs in a better way. Eventually, the bond with customer will sustain for a long time which helps the company to meet its aim. Costa et al., (2001) applied QFD method in the case study of ketchup quality management. They discussed about the benefits, problems, challenges & flaws when QFD is implemented in Food Research and Development. Bayazit (2004) said that purpose of AHP is to bring out the best inference in decision making in case of multiple criteria. He used it in a tractor manufacturing plant for decision making in Flexible Manufacturing Systems.
III.SCOPE OF RESEARCH
AHP & QFD are vital tools for a company and organization. They should implement AHP & QHP to make huge profits. One‟s aim should be to know customer in a better way. More transparency in customer and company will give finally increase the sales of company. Every company and organization motto should be customer satisfaction.
IV.PROPOSED METHODOLOGY
A brief talk was done with 10 customers. All customer together said their requirement and agreed on it. Also, they together made the AHP plan matrix as per their requirement. The company also made a list of their technical attributes by discussing with designers and engineers. So, VOC comprises of Good Appearance, Cost, Easy Cleaning, Long Term Use, Supporter Handles, Width of seat and Backrest height. In the same way, VOE comprises of Base Strength, Weight, Volume, Seat, Design and Durable.
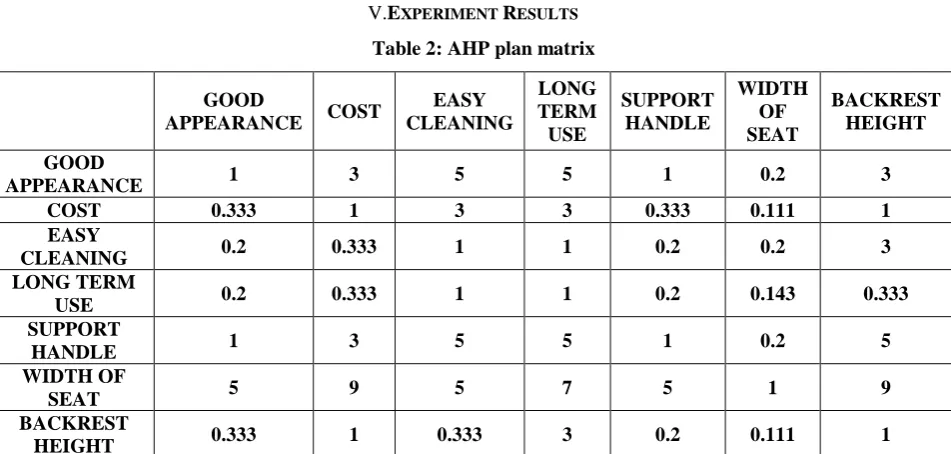
For AHP- In the AHP plan table, every integer value shows that row entry is more important than column entry. Also, when column entry is important, the reciprocal is used. The AHP plan table is the Normalizing Customer Requirement Table.
aij = 1/ aji
Percentage calculation- In the following matrix each requirement has its own weighted importance. For importance within the entire system, requirement in percentages are seen. After calculating the value of B for each components, the matrix „C‟ consisted of „n‟ items of B.
C= B1 B2 …… Bn. . This is called Normalization Matrix.
B1 = b11 ; bij =
aij aij
𝑛
𝑖=1 ;
W=. w1 ; wi =
𝑐𝑖𝑗
𝑛 𝑗 =1
𝑛
. .
. .
bn1 win
It is known that AHP has a consistent system but results also depends on decision maker. So, therefore, Consistency Ratio (CR) is evaluated. In order to determine CR, the basic value „λ‟ and number of factors is calculated. For value of „λ‟, we multiply matrices A & W.
Ei=
di
wi (i=1, 2, 3…n); λmax = Ei
n i=1
n ; CI =
λ𝑚𝑎𝑥−𝑛
n−1
Table 1: Random Index
N 1 2 3 4 5 6 7 8 9 10
RI 0 0 0.58 0.9 1.12 1.24 1.32 1.41 1.45 1.49
Table 1 describes about the Random Index which is used to find the Consistency Ratio. Random Index technique was discovered by Saaty. He randomly generated reciprocal matrix scale using figures like 1
9, 1 8,
1
7…1…8….9. This table gives us the values for 10 number of customer requirements. Similarly, more values can be found out by increasing the range of the denominators in the fraction used.
CR = 𝐶𝐼
𝑅𝐼 ; For AHP analysis to be consistent, the value of CR must be less than 0.1. If it is not there is calculation mistake or an inconsistency is made by decision maker. This is need to be corrected immediately. Here, n=7
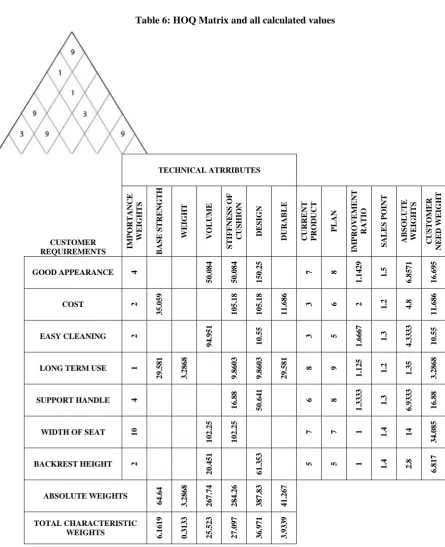
For QFD- ATechnical Attributes Table is made. Then the HOQ Matrix is constructed. The HOQ matrix comprises of Current Product, Plan, Improvement Ratio, Sales Point, Absolute Weight and Customer Needs Weight.
Current Product (CP): This is the current weight of product (here chair).
Plan (P): It is defined as target weight which company wants to pursue.
Improvement Ratio (IR): IR= P/CP
Sales Point (SP): Strong sales point & weak sales point were used. SP was analyzed & quantified with company‟s sales department.
Absolute Weight (AW): AW= IW x IR x SP
Customer Needs Weight (CNW): AW of each Technical attribute (AW x 100 )
V.EXPERIMENT RESULTS
Table 2: AHP plan matrix
GOOD
APPEARANCE COST
EASY CLEANING
LONG TERM USE
SUPPORT HANDLE
WIDTH OF SEAT
BACKREST HEIGHT
GOOD
APPEARANCE 1 3 5 5 1 0.2 3
COST 0.333 1 3 3 0.333 0.111 1
EASY
CLEANING 0.2 0.333 1 1 0.2 0.2 3
LONG TERM
USE 0.2 0.333 1 1 0.2 0.143 0.333
SUPPORT
HANDLE 1 3 5 5 1 0.2 5
WIDTH OF
SEAT 5 9 5 7 5 1 9
BACKREST
HEIGHT 0.333 1 0.333 3 0.2 0.111 1
Normalized Matrix (C)
0.123977 0.169818 0.245906 0.2 0.126056 0.101781 0.13433
0.041284 0.056606 0.147543 0.12 0.041977 0.056489 0.044777
0.024795 0.01885 0.049181 0.04 0.025211 0.101781 0.13433
0.024795 0.01885 0.049181 0.04 0.025211 0.072774 0.014911
0.123977 0.169818 0.245906 0.2 0.126056 0.101781 0.223884
0.619886 0.509453 0.245906 0.28 0.630279 0.508906 0.402991
0.041284 0.056606 0.16377 0.12 0.025211 0.056489 0.044777
This matrix is the Normalized Matrix. These values are found outby dividing the element value with the summation of the whole column values.
W = 0.15741 D = 8.740386 E = 7.932336
0.072668 3.907611 7.681931
0.056307 2.989634 7.585035
0.035103 1.845276 7.50962
0.170203 9.461874 7.941668
0.456774 26.179441 8.187676
0.051535 2.697956 7.478865
Matrix W is the average of the column values in each row. Matrix D is the product of AHP Plan Matrix and Matrix. Matrix E is found out by dividing each element of Matrix D with the corresponding element in Matrix W.
λmax = 7.75959, CI = 0.126598, CR = 0.095908, Hence, our calculation and data are consistent.
Table 3: Normalized Customer Requirements Matrix
GO OD A PPE A R A N C E C OS T E A S Y C L E A N IN G L ON G T E R M U S E S U PPOR T HA N D L E WID T H O F S E A T B A C KR E S T HEIGH T N OR M A L IZ E D C OLUM N S S U M R OW A V E R A GE
GOOD APPEARANCE 1 3 5 5 1 0.2 3
0 .1 2 4 0 .1 7 0 .2 4 6 0 .2 0 .1 2 6 0 .1 0 2 0 .1 3 4 1 .1 0 2 0 .1 5 7 COST 0 .3 3 3
1 3 3
0 .3 3 3 0 .1 1 1 1 0 .0 4 1 0 .0 5 7 0 .1 4 8 0 .1 2 0 .0 4 2 0 .0 5 6 0 .0 4 5 0 .5 0 9 0 .0 7 3
EASY CLEANING 0.2
0
.3
3
3
1 1 0.2 0.2 3
0 .0 2 5 0 .0 1 9 0 .0 4 9 0 .0 4 0 .0 2 5 0 .1 0 2 0 .1 3 4 0 .3 9 4 0 .0 5 6
LONG TERM USE 0.2
0
.3
3
3
1 1 0.2
0 .1 4 3 0 .3 3 3 0 .0 2 5 0 .0 1 9 0 .0 4 9 0 .0 4 0 .0 2 5 0 .0 7 3 0 .0 1 5 0 .2 4 6 0 .0 3 5
SUPPORT HANDLE 1 3 5 5 1 0.2 5
0 .1 2 4 0 .1 7 0 .2 4 6 0 .2 0 .1 2 6 0 .1 0 2 0 .2 2 4 1 .1 9 1 0 .1 7
WIDTH OF SEAT 5 9 5 7 5 1 9
BACKREST HEIGHT
0
.3
3
3
1
0
.3
3
3
3 0.2
0
.1
1
1
1
0
.0
4
1
0
.0
5
7
0
.0
1
6
0
.1
2
0
.0
2
5
0
.0
5
6
0
.0
4
5
0
.3
6
1
0
.0
5
2
TOTAL
8
.0
6
6
1
7
.6
7
2
0
.3
3
25
7
.9
3
3
1
.9
6
5
2
2
.3
3
1 1 1 1 1 1 1 7 1
Table 3 contains the AHP Plan Matrix, Normalized Matrix (C), Sum of the columns values in each row in Normalized Matrix, Matrix W which is called Row Average and the Column total of each column.
Table 4: Weight Scale according to Row Average
Range 0-0.05
0.05-0.10
0.10-0.15
0.15-0.20
0.20-0.25
0.25-0.30
0.30-0.35
0.35-0.40
0.40-0.45
0.45 & above Importance
Weights 1 2 3 4 5 6 7 8 9 10
Table 4 consists the Weight scale which is set by an individual which depends on the Row Average values. A range is set according to the values of Row Average in 10 intervals and then weights are given to them from 1 to 10.
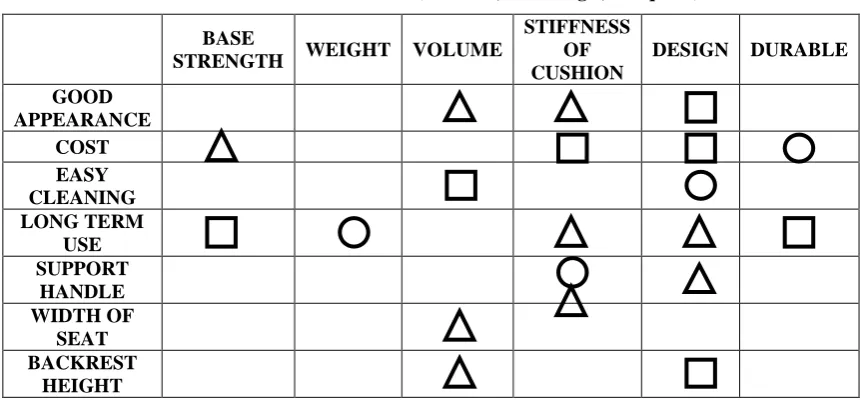
Table 5: Technical Attributes (1: Circle, 3: Triangle, 9: Square)
BASE
STRENGTH WEIGHT VOLUME
STIFFNESS OF CUSHION
DESIGN DURABLE
GOOD APPEARANCE
COST EASY CLEANING LONG TERM
USE SUPPORT
HANDLE WIDTH OF
SEAT BACKREST
HEIGHT
Table 6: HOQ Matrix and all calculated values
TECHNICAL ATRRIBUTES
CUSTOMER
REQUIREMENTS IM
POR T A N C E WE IGH T S B A S E S T R E N G T H WE IGH T V OLUM E S T IFFN E S S OF C U S HIO N D E S IGN D U R A B L E C U R R E N T PR OD U C T PL A N IM PR OV E M E N T R A T IO S A L E S PO IN T A B S OLUT E WE IGH T S C U S T OM E R N E E D W E IGH T
GOOD APPEARANCE 4
5 0 .0 8 4 5 0 .0 8 4 1 5 0 .2 5 7 8 1 .1 4 2 9 1 .5 6 .8 5 7 1 1 6 .6 9 5
COST 2
3 5 .0 5 9 1 0 5 .1 8 1 0 5 .1 8 1 1 .6 8 6
3 6 2 1.2 4.8
1
1
.6
8
6
EASY CLEANING 2
9 4 .9 5 1 1 0 .5 5 3 5 1 .6 6 6 7 1 .3 4 .3 3 3 3 1 0 .5 5
LONG TERM USE 1
2 9 .5 8 1 3 .2 8 6 8 9 .8 6 0 3 9 .8 6 0 3 2 9 .5 8 1 8 9 1 .1 2 5 1 .2 1 .3 5 3 .2 8 6 8
SUPPORT HANDLE 4
1 6 .8 8 5 0 .6 4 1 6 8 1 .3 3 3 3 1 .3 6 .9 3 3 3 1 6 .8 8
WIDTH OF SEAT 10
1 0 2 .2 5 1 0 2 .2 5
7 7 1 1.4 14
3
4
.0
8
5
BACKREST HEIGHT 2
2 0 .4 5 1 6 1 .3 5 3
5 5 1 1.4 2.8
6 .8 1 7 ABSOLUTE WEIGHTS 6 4 .6 4 3 .2 8 6 8 2 6 7 .7 4 2 8 4 .2 6 3 8 7 .8 3 4 1 .2 6 7 TOTAL CHARACTERISTIC
WEIGHTS 6.16
1 9 0 .3 1 3 3 2 5 .5 2 3 2 7 .0 9 7 3 6 .9 7 1 3 .9 3 3 9
and Technical Attributes Tables. The figure above it is the House of Quality Matrix in which the values are written ranging from 1 to 9 which depicts the inter relations between each technical attributes with the others. Here also 9 is the strongest and 1 is the weakest.
VI.CONCLUSION
From this case study, it was concluded that, the most important technical attribute to be looked upon for meeting the customer requirements optimally is “Design”. It was preceded by “Stiffness of Cushion i.e. Seat” and “Volume”. It was also concluded that, the most important customer requirement among all of the 7 is “Width of the seat”, followed by, “Support Handle” and “Good Appearance”. So, throughout the study we found out at last that to achieve the most important customer requirement i.e. “Width of the Seat” optimally the “Design” should be perfect and should be taken care of with maximum priority.
VII.ACKNOWLEDGEMENT
The authors extend their heart felt gratitude to the reviewer & editor of IJIRSET for their constructive suggestions that helped to improve the literal and technical content of this paper. We also give our special thanks to Lakshmi Enterprises, Odisha, India for helping us for the collection of data for completion of this case study.
REFERENCES
[1] Vaidya, O. S., and Kumar S., “Analytic hierarchy process: An overview of applications”, European Journal of Operational Research 169, pp 1–29, 2006
[2] Satty, T. L., “ The Analytic Process”, McGraw Hill, New York, 1980
[3] Saaty,T. L., “Decision making with the analytic hierarchy process”, Int. J. Services, Vol. 1, No. 1, 2008
[4] Erkarslan, O., and Yilmaz, H., “Optimization of product design through Quality Function Deployment and Analytical Hierarchy Process: Case study of a Ceramic Washbasin”, METU JFA 2011/1 (28:1) 1-22, 2011
[5] Mazur,G. H., “Modern QFD Introduction”, 2nd National Symposium on Quality Function Deployment, Dokuz Eylul University, Izmir, 2008 [6] Triantaphyllou, E., and Mann, S.H., “Using the Analytic Hierarchy Process for decision making in Engineering Applications: Some
Challenges”, International Journal of Industrial Engineering: Applications and Practice, Vol. 2, No. 1, pp. 35-44, 1995
[7] Kamakura, W.,Mela, C.F.,Ansari, A.,Bodapati, A.,Fader, P., Iyengar,R., Naik, P., Neslin, S., Sun, B., Verhoef, P.C., Wedel, M., and Wilcox, R., “Choice Models and Customer Relationship Management”, Marketing Letters 16:3/4, 279–291, 2005
[8] Rababah, K., Mohd, H., and Ibrahim, H., “Customer Relationship Management (CRM) Processes from Theory to Practice: The Pre-implementation Plan of CRM System”, International Journal of e-Education, e-Business, e-Management and e-Learning, Vol. 1, No. 1, April 2011
[9] Costa,A. I. A., Dekker, M., and Jongen,W. M. F., “Quality function deployment in the food industry: a review”, Elsevier, Trends in Food Science & Technology 11, 306-314, 2001
[10] Bayazit, O., " Use of AHP in decision-making for flexible manufacturing systems", Journal of Manufacturing Technology Management, Vol. 16, No. 7, pp. 808-819, 2004
BIOGRAPHY
Swarn Kumar is a Research Scholar in School of Mechanical Engineering at KIIT University, Bhubaneswar, India. His areas of research are quality engineering and multi criteria decision making. He has published 2 research paper in national & international conferences.