Permutation Tests for Multiple Loci Affecting a Quantitative Character
R. W. Doerge
and
G. A. Churchill
Biometrics Unit, Cornell University, Zthaca, New York 14853
Manuscript received June 2, 1995 Accepted for publication September 19, 1995
ABSTRACT
The problem of detecting minor quantitative trait loci (QTL) responsible for genetic variation not explained by major QTL is of importance in the complete dissection of quantitative characters. Two extensions of the permutation-based method for estimating empirical threshold values are presented. These methods, the conditional empirical threshold (CET) and the residual empirical threshold (RET), yield critical values that can be used to construct tests for the presence of minor QTL effects while accounting for effects of known major QTL. The CET provides a completely nonparametric test through conditioning on markers linked to major QTL. It allows for general nonadditive interactions among QTL, but its practical application is restricted to regions of the genome that are unlinked to the major QTL. The RET assumes a structural model for the effect of major QTL, and a threshold is constructed using residuals from this structural model. The search space for minor QTL is unrestricted, and RET-based tests may be more powerful than the CET-based test when the structural model is approximately true.
A"
impressive amount of effort has gone into the development of statistical methods for the detection of quantitative trait loci (QTL) (e.&, WELLER 1986,1987; LANDER and BOTSTEIN 1989; CARBONELL et al. 1992;KNOTT and
HALEY
1992). Methods for the detection andlocation of a single major QTL are relatively well devel- oped, but the important problem of detecting minor QTL has received only limited attention ( JANSEN 1993a,b; ZENC 1993,1994;JmsEN and STAM 1994). Real- istically, many genetic factors contribute to the quantita- tive variation of many (most) traits of interest. In fact, the majority of human genetic diseases can be thought of as complex traits (LANDER and BOTSTEIN 1986). In this paper we derive statistical tests for minor QTL effects that take account of known major QTL effects. We also describe a sequential search procedure for multiple QTL. These methods are an extension of previous work on permutation-based tests (CHURCHILL and DOERGE 1994). Procedures for detecting a major QTL are typically based on a statistic that has power to detect a shift in the quantitative trait mean between individuals in different genotypic classes as defined by a marker or marker interval. The hypotheses being tested (HALEY
and KNOTT 1992) are usually as follows: (1) HA: no QTL
is present; (2) H:: a QTL is present but not linked to the marker(s) being tested; and ( 3 ) HA: a QTL is pres- ent and linked to the marker(s). We refer to a location in the genome at which the test statistic is calculated as an analysis point. The statistic will be computed at a number of analysis points throughout the genome, and the analysis point at which it takes its maximum value
Corresponding author: R. W. Doerge, Departments of Agronomy and Statistics, 1399 Mathematical Sciences Building, Purdue University, West Lafayette, IN 47907-1399. E-mail: [email protected]
Genetics 142 285-294 (January, 1996)
is used as an estimate of QTL location. The maximal value (over all analysis points in the genome) of the test statistics can be used to construct a test for a major QTL effect. The problem of obtaining an appropriate threshold value for this test has been addressed by LANDER and BOTSTEIN (1989,1994), REBM et al. (1994) and CHURCHILL and DOERGE (1994). The defining fea- ture of a threshold value is that, under the assumption of no QTL effects, the value of the test statistic should exceed the threshold with probability not to exceed some nominal level a (e.g., a = 0.05). There are two types of errors that can occur in the major QTL detec- tion problem. A type I error occurs when no QTL ef- fects are present in the genome, but we (incorrectly) declare significant effects. A type I1 error occurs when there are QTL effects present but we fail to detect them. The relative importance of type I and type I1 errors will depend on the particular application and the resources available to the experimenter. If the cost of a false posi- tive result is not substantial, lower thresholds can be obtained using for example a = 0.10 or a = 0.20. If false positives are a serious concern, a more stringent level a = 0.01 or a = 0.001 may be desirable. For a given type I error rate, the type I1 error rate can be decreased by increasing the size of the population.
where the number of model parameters is greater, the integration must be approximated by numerical means. CHURCHILL and DOERCE (1994) describe a permuta- tion-based method to estimate a threshold value. The quantitative trait data are permuted with respect to the marker data a large number of times to effectively sam- ple from the distribution of the test statistic under a null hypothesis of no phenotype-genotype associations. This method is intuitive and easy to implement. It does not rely on distributional assumptions regarding the quantitative trait and is valid in small sample situations.
It has been suggested (PATERSON et al. 1988; LANDER and BOTSTEIN 1989; LINCOLN et al. 1992a,b) that once a major QTL has been detected its effects should be accounted for before a search for secondary QTL is car- ried out. We consider a similar approach to the detection of multiple QTL in the form of a sequential testing pro- cedure. Essentially, the problem is one of model selec- tion in general. For the problem at hand, we have chosen to use a forward selection procedure. Given that one or more QTL have been detected (declared significant), we account for the effects of these QTL and search the genome for the next most significant QTL. Termination of the search occurs when no remaining QTL effects are detected. The error structure of a sequential search procedure is complex and at each step depends on deci- sions made at earlier steps. At a given stage in the sequen- tial search, a type I error may occur if a QTL effect is detected at an analysis point where there are no linked QTL. The search for additional QTL would then con- tinue, and any additional QTL detected may be genuine QTL or type I errors. A type I1 error can occur when no QTL effects are detected, but there are in fact QTL in the genome that have not been detected at an earlier step. The seriousness of type I1 error and the subsequent decision to stop the search for further QTL is dependent on the magnitude of remaining QTL effects. For exam- ple, if only genes of negligibly small effect remain, s t o p ping may be acceptable.
In this paper, we present two methods for carrying out the tests in a sequential search procedure. These methods are also applicable in the case where there is a known ( a priori) major QTL, and we wish to test for a secondary QTL while controlling for the effects of the major QTL.
METHODS
Motivation: The key to the detection of QTL effects is the observation of statistical association between the trait values and the genotypes of markers segregating in an experimental population. Both single marker and interval mapping methods are well suited for the detec- tion of a single major QTL somewhere in the genome. However, these methods often yield multiple indica- tions of QTL effects at distinct analysis points. Our goal is to propose statistically sound methods for assessing
the significance of secondary QTL effects. This assess- ment is not as straightforward as declaring a universal threshold value or an increment to the single QTL threshold value. One must first account for correlations of the markers under study with the major QTL effect and for other factors such as nonrandom segregation and/or patterns of missing data that can lead to false indications of secondary QTL effects.
Two possible causes for false indications of QTL are type I error and ghost QTL effects. MCMILLAN and ROE
ERTSON (1974) discuss both type I errors and detection
of “ghosts” (ghost QTL) in their discussion of methods for detecting loci affecting quantitative traits in Dro- sophila. They referred to two errors. “(i) The detection of loci which do not exist. (ii) The magnification of the estimated effect of those major loci which do exist by accumulating to their effect those of undetected loci close to them on the chromosome.” Type I errors are a property associated with any statistical test procedure and can be controlled to occur at or below a specified level by setting an appropriate critical value. A ghost QTL is an artifact of cosegregation between QTL and nonadjacent or distant markers. Cosegregation with un- linked markers can occur due to chance or due to selec- tion effects in the experimental population. More typi- cally, a ghost QTL will present itself across intervals in the vicinity of large QTL effects (KNAPP et al. 1990;
HALEY and KNOTT 1992; MARTINEZ and CURNOW 1992;
JANSEN 1993). It is an inherently difficult problem to
distinguish between real multiple QTL located near one another and a single QTL with ghosting effects.
Realistically, several different regions of the genome may contain genes whose segregating alleles affect the distribution of the trait. Major QTL are those that con- tribute most to the genetic variation, while minor QTL contribute less. The distinction is not sharp. Having detected a major QTL, we wish to account for its effects in order to assist detection of secondary QTL. This ap- proach will generally increase the power for detecting unlinked secondary QTL effects and will reduce or eliminate ghosting. Power for detecting multiple linked QTL will be diminished by this approach. The difficulty that arises in the study of multiple linked QTL is that there are few recombinants. One way to increase the number of recombinants is to increase the number of progeny. Possible alternatives to using very large sam- ples, such as the development of near isogenic lines
(YOUNG and TANKSLEY 1989) or pooling strategies
287
conditioning can lead to limitations on the power of these tests (ZENG 1994). Methods described here first account for the variation associated with known or as- sumed QTL, then focus on the remaining variation to detect secondary QTL.
In the remainder of this section we will first describe the permutation test for a major QTL effect. We then discuss the conditional empirical threshold (CET) and residual empirical threshold (RET) procedures in turn including implementation of sequential search for QTL with justification. We conclude with comments on the permutation sample size and the use of t-tests.
Permutation tests for major QTL effects: A permu- tation test for QTL effects has been described by CHURCHILL and DOERGE (1994). The individuals in an experiment are labeled 1 to n and each is scored at m genetic markers selected from a known map. Also associated with each individual is a trait value yi. A test statistic is computed at each of a number of analysis points and its maximum value is an indicator of QTL effects in the genome. It is possible to use any test statistic in this procedure. Single marker F or t statistics or LOD scores from interval mapping (LANDER and
BOTSTEIN 1989) are all reasonable choices. The trait values are shuffled N times among the n individuals to create permuted data sets that have only random genotype-phenotype associations. The permuted data sets are a representative sample from an appropriate null distribution, HA or
G.
An
empirical threshold value for detecting a major QTL effect is obtained by computing the (1 - a ) percentile from the Npermuted data sets of the maximum test statistic value over the genetic map.CET values: In the QTL setting, when one or more QTL are known to be linked to a (set of) marker(s), the population can be stratified into marker genotype classes. Permutations are then carried out within these classes. Stratification effectively controls for the effects of known QTL and can improve the power of a test for additional QTL because the within class variation is reduced. Tight linkage between the marker(s) and the QTL is desirable to obtain the maximum amount of reduction in the variation. Analysis of the permuted data is carried out to estimate a CET value. The idea of conditioning in this context is based on a suggestion of LEHMAN (pp. 230-231, 1986) for improving the power of permutation tests by stratification on a variable known to affect the response. This procedure is com- pleteiy nonparametric in that it makes no distributional assumptions about the quantitative trait nor does it make assumptions about the additive or nonadditive effects of the QTL linked to the markers used to define the strata.
The steps of the conditional approach to multiple QTL detection may be applied to both single marker and interval analyses. We assume a fixed known genetic map and a information about a major QTL. The
marker or interval most closely associated with the ma- jor QTL is called the “conditioning marker” (“condi-
tioning interval”). We can estimate a CET value that accounts for the variation due to the major QTL. The test statistic is not specified, as it is possible to use any reasonable test statistic within this framework. In appli- cations of the CET method, the critical value is com- pared to the original test statistics.
To estimate the CET, individuals in the population are separated into genotypic classes corresponding to the genotype at the conditioning marker. The result is a stratification of individuals into g genotypic classes, where, for example, g = 2 for backcross and recombi- nant inbred populations, and g = 3 for an F2 popula- tion. In cases where a significant amount of genotypic data is missing, an additional class of individuals should be included. If the missing data class is large, it may be prudent to choose an alternative conditioning marker even if it is less tightly linked to the QTL. In the event that data are not missing at random with respect to the trait values and the QTL genotype, biases may be unavoidable. The stratification of individuals into marker classes reduces (or in the case of perfect link- age, eliminates) the effect of the major QTL within the classes. It is this reduction in variation that provides the power of the test ( JANSEN 1994; ZENG 1994). The stratified data are then permuted within each class to effectively destroy any remaining genotype-phenotype associations within the classes. The shuffled data are analyzed by computing the maximal test statistic over all markers outside the linkage group containing the conditioned marker. The maximal test statistics is stored, and the process is repeated N times. The (1 -
a ) quantile of this sample provides an estimate of the conditional empirical threshold value.
Sequential search by C E T This procedure can be continued for the purpose of
identifying
additional QTL and controlling for effect of previously detected QTL. For example, a backcross with missing data has g = 3 genotype groups. Let A homozygous class, H=
heterozygous class, and M=
missing data. The first conditioning marker has g = 3 ( A , H, M) possible geno- typic classes to permute within. The second condition- ing marker, given the first conditioning marker, has 3‘ possible genotypic classes ( A A , AH, AM, HA, HH, HM, MA, MH, MM). The third conditioning marker has 33 possible genotypic classes, and so forth. Each additional level of stratification builds on the previous level of stratification. Potentially, there are a large number ofstratifying
factors(g,
where c is the number of condi-When searching for secondary QTL using the se- quential CET procedure, we suggest limiting the search space, the set of analysis points considered, to those chromosomes on which no QTL have been detected at earlier steps. Inclusion of markers linked to the condi- tioning marker(s) will lead to an elevated threshold value for detecting effects at other unlinked, markers thus reducing the power of the test at these markers. The effect occurs because the threshold is taken as the
(1 - a) percentile of the maximum score over all analy- sis points. Markers linked to the conditioning marker will continue to show associations with the major QTL in permuted data sets and thus will show high values of the test statistic, increasing the global threshold. By
eliminating the chromosome(s) containing the condi- tioning marker(s) from the search space, we gain power at unlinked loci. The price for this gain in power is the inability to detect multiple linked QTL. Ghosting effects due to correlations among unlinked markers will also lead to inflated threshold values.
The error structure at each step of a sequential search procedure is dependent on the pattern of decisions made at earlier steps. If a type I error occurs at any stage, the process may stop or continue, but once an error is made the marker associated with the error re- mains in the analysis. An incorrect inclusion of a marker in the conditioning process may falsely direct the re- mainder of the analysis. Alternatively, if a type I1 error occurs ( i . e . , no QTL detected when there really is one), the entire process terminates.
In summary, the process described is sequentially decrementing in that each time a significant QTL is identified and its associated marker used to condition upon, an experimentwise threshold value for the re- mainder of the genome is estimated, and the chromo- some is permanently removed from the analysis. The process proceeds in this manner until either no more secondary QTL are found, or until markers on each of the chromosomes representing the total of the genome have been conditioned on, and there are no more chro- mosomes to analyze.
Justification for the CET test: Consider testing for a secondary QTL in a backcross population for which a single major QTL is known to be segregating. Let
0 nonrecurrent parental allele is absent
1 nonrecurrent parental allele is present
Q J t =
{
indicate the major QTL genotype of the ith individual. We will assume the effect of nonrecurrent parental al- lele of the major QTL is a shift in the location parame- ter of the trait distribution by an amount A I . The condi- tioning marker genotype is indicated by
M1i =
{
0 1 nonrecurrent parental allele is absent nonrecurrent parental allele is present, and the recombination fraction between loci Ml and8
will be denoted by 7,. Similarly define the indicatorQZ for a secondary QTL, unlinked to the first, with an additive effect of size A2 on the location of the trait distribution. Let MZi be the indicator for a marker linked to the locus Q with recombination fraction r2.
We assume that
Ai
f 0 , and 0 I ri<
1/2 for i = 1, 2.The trait value is a random variable with conditional (given the QTL genotypes) probability density func- tion.
P Y l Q , @ ( Y ? 0 , 0 ) =
foe,
P Y l Q , @ ( Y ? 1 , 0 ) =
f(y
-AI),
PYla,@(Y,
0 , 1) =f(y
-A d >
P y l a , @ ( y , 1, 1) = f ( y - A1 - Az).
Note thatf( ) may be taken from any family of continu- ous distributions. For example, if there are a number of additional QTL (beyond the major and secondary QTL under consideration),
f(
) itself may be a mixture distribution (TITTERINGTON et al. 1985).Since in practice we will observe QTL genotypes only indirectly through the linked marker genotypes, the conditional distribution of interest is
fiYlMl,M2(y, m1, m 2 ) = f l ( 1 - rl)l-ml
x
[Q(1 - T d - ? j I y ) +4 - Y
- T 2 ) m q ( y -Ad1
+
d p m l ( l - TI)^^ X [ Q ( l - ~ 2 ) ' - ? j I y - A,)+
&9(1 - ~ ) ? f ( y - A1 - A,)].This mixture of mixture densities reflects the possibility of recombination between the unobservabled QTL ge- notypes and the observed markers. Conditioning on additional QTL through linked markers will result in nested mixture distributions of the same general form. The essential points for this justification are as fol- lows:
1. We assume that there is a major QTL effect (A l f
2. Either of the null hypotheses H&A2 = 0 or H$r2 =
3. When
A2 f
0 and r2< I/,,
there will be a location shift of magnitude ('/,
- r2)Az between the densi-0 ) linked to the marker MI (71
<
'/2).' / z imply that
PYIM,,M~(Y,
ml, 0 ) =PYIM,,M~(Y,
m l f 1 ) .ties
P Y I M ~ , M ~ ( Y ,
m, 1) andPYIM,,M~(Y,
m, 0 ) .Condition 2 is necessary. Condition 3 can be relaxed to allow location shift of more general form (Le., to allow the effect of Q to depend on the state of QJ). The case where Q effects are equal but opposite sign within the
8
classes is problematic. The likelihoodn
~ ym l , ,
m2)
=n
PYIM~,M~(Y,, ml,, %i)requires a specific form for the density function ) . A common choice off( ) is a normal density such that the distribution of the continuous trait values, when the
289
QTL genotype is known, will be normally distributed. Unbiasedness of the permutation test in this situation is assured by the choice of
L(
) and points (2) and (3), which satisfy the conditions of lemma 3 in LEHMANN(1986, p. 234).
RET values:
An
alternative approach to detecting secondary QTL effects is to examine the residuals from a fitted model for major QTL effects within a permuta- tion setting. In this situation, a structural model (e.g., additive effects) is assumed for the known QTL effects. Estimated mean (genetic) trait values are computed for each individual and residuals from these fitted values are analyzed to detect secondary effects. The residuals are permuted across the entire experimental popula- tion and the resulting data sets are analyzed to estimate a RET value. This procedure is nonparametric in that there are no distributional assumptions on the quantita- tive trait values. In situations where the structural model is true, the RET is more powerful than CET.We will assume a structural model of the form
y,
= p+
&Ql
+
€ 8 , ( 1 )where y is an overall mean for the population, Q i is
an indicator of the major QTL genotype,
A,
is the effect of an allelic substitution at the QTL, and the ei are error terms. For a given marker M I , tightly linked to Q , we can compute a residual value for each individual ( i =1,
. . . ,
n ) a s6
= yi -p(0,
(2)where
p
denotes the sample mean of the quantitative trait values within the marker genotype class k and k( i)is the marker genotype of the ith individual. The distribution of the residuals depends on the strength of linkage between the QTL and the marker. If the QTL is completely linked to the marker, the QTL genotype classes are known with certainty, and the re- siduals reflect the variation associated with the QTL. If the QTL is unlinked to the marker or a type I error occurs, the residual calculations are calculated based on random individuals assigned to marker classes. In the limit, as linkage between the marker and the QTL becomes weaker, the reduction in the residual variation grows smaller, and the power to detect secondary QTL becomes less.
The estimated residuals 4; i = 1 ,
. . .
,
n are now treated as new trait data. Any remaining phenotype-ge- notype associations may be tested directly on the resid- ual data using a permutation test. RET is different from CET in that we recompute the test statistics on unper- muted data using residuals as new traits and apply the standard permutation test.Sequential search by
RET:
The residual empirical threshold values are influenced by the structural model that defines the mode of the major QTL action. If the structural model is correct and the linkage to the QTLis tight, one would expect this procedure to have higher power than the CET procedure because the permuta- tions are not restricted by stratification.
As
the linkage between the conditioning marker and theQTL
weakens(i.e., becomes more distantly linked), additional noise is introduced into the residuals, thus reducing the power to detect secondary effects.
The sequential search for secondary QTL using RET is essentially the same as using CET except that it is no longer necessary to restrict the search space. Markers linked to the conditioning marker are also linked to the major QTL and will have estimated genetic trait values that reflect this linkage. The RET procedure may be used in situations for multiple QTL detection/loca- tion, but a loss of power around the conditioning marker is expected due to linkage.
Justification for the RET test: Permutation tests re- quire exchangeability under the null hypothesis among the values being permuted. Under mild conditions SCHMOYER (1994) shows that permutation tests with re- siduals are asymptotically valid and consistent. In gen- eral, residual values are not necessarily exchangeable or uncorrelated. Consider the linear model
Y = m + e .
The matrix X is the matrix of indicators (0 or 1) on marker genotype associated at the point of analysis,
P
is the association between the phenotype and genotype, and e is a vector of identically distributed random er- rors. Under the usual regression setup X is observed directly without error, but in this situation we observe the marker classes that are tightly linked to the QTL and thus they reflect the QTL classes with some error due to recombination. The condition of SCHMOYER(1994) is that J . 0 + 0 as n + a, where
D
is the maximumdiagonal element of X(X'X)"X'. When the columns of X are indicator variables of marker genotype, this condition is easily verified.
Number of permutations: The number of permuted data sets analyzed will determine the accuracy with which we can estimate quantiles (e.g., critical values) of the distribution of the test statistic under the null hypothesis. Through experience, we have found that N
= 1000 is adequate for estimating critical values at a significance level of a = 0.05. EFRON (1993, pp. 208-
209) details the distribution of the number of random- ized test statistic values exceeding the observed value of the actual test statistic as having a binomial distribution, Bin(N, a ) . Let
a = Pr(T 2 TFm,),
value defined for analysis. Therefore & has a binomial distribution, Bin(N,
a ) ,
with mean a and variance a ( 1 - a ) / N . If we wish to control the resampling error associated with our estimatedp
value, this may be re- flected through the coefficient of variation m ( & ) to determine the number of shuffles,N,
required to achieve significance level a with < l O O c u ( & ) % error.1 - a N =
a [ c u ( & ) ] 2 .
In other words, as the amount of error we are willing to make through type I error and resampling error decreases, the number of permutation replications in- creases. For example,
N
= 1000 is required for a type I error rate of 0.05 with<
“13.78% Monte Carlo resam- pling error.Test statistic: The key property of the t-test, Ftest and normal likelihood ratio or LOD score is that each measures the difference in class means, in fact -
could be used directly in the two class case. We use the t-test as our choice of test statistic for demonstration of the CET and RET procedures. The t-test is just a scaled difference in means on a familiar scale, while the Ftest and LOD score are the sum of squared deviations from a common mean. The t-test or Ftest provides a valid approach to single marker analysis for most standard experimental situations (e.g., backcross, I$, or R.I.). It is also possible to use CET and RET procedures within an interval mapping framework. To implement the CET procedure within MAPMAKER/QTL (PATERSON et al. 1988; LINCOLN et al. 1992a,b), classes for the conditional permutations can be constructed using joint genotypes of markers flanking the interval of interest. The chro- mosome containing the conditioning interval should be eliminated from the conditional analysis. Similarly, it is possible to use the one QTL model within MAP- MAKER/QTL to compute interval mapping LOD scores on the residual data. The residual data has to be recalculated, using Equation
2,
after each level of conditioning.EXAMPLES
A simulated example: We consider the same exam- ple as in our previous work (CHURCHILL and DOERGE
1994). One hundred genomes containing four 100 cM chromosomes were simulated according to a standard backcross model. Chromosomes I and I11 each contain 50 randomly placed markers. Chromosomes
IZ
andIt’
each contain 10 randomly placed markers. The true genetic map was used in the QTL analysis. A QTL with additive effect 0.75 (a2 = 1.0) was simulated at 44.4 cM from the left end of chromosome I (between marker number 24 and marker number 25). A second QTL of effect 1.0 (a2 = 1.0) was simulated at 61.6 cM from the left end of chromosome I1 (between marker number 55 and marker number 56).
The first QTL is detected using empirical threshold values (CHURCHILL and DOERGE 1994) at a 5% signifi- cance level. Our goal is to accurately detect the QTL of lesser effect using single marker t-tests. We also calculate the equivalent single marker LOD score analysis
(DOERGE 1995). Since the evaluation is at the genetic marker, LOD scores determined by interval mapping within an interval of known length may be higher due to the incorporation of genetic map information. We chose the single marker t-test as our test statistic for com- putational speed and because it performs as well as inter- val mapping when the marker map is dense (REBAI et al. 1995). The results of the estimated residual threshold analysis are not presented since the RET analysis pro- duces the same magnitude threshold values and results. The estimated permutation threshold for declaring the initial QTL significant at the 5% level is 3.3636
(LOD = 2.3725). The largest t-statistic ( t = 4.5412) for the original data is associated with genetic marker number 55 linkage group 2. Marker 55 becomes the first conditioning marker. The trait values are per- muted
(N
= 1000) within the conditioning marker ge- notypic classes. Single marker analyses are performed on the permuted data for markers in linkage groups 1,3 and 4 only. The experimentwise 95% critical value for declaring a second QTL is 3.2606 (LOD = 2.2365). The largest test statistic ( t = 3.9577) across linkage groups 1, 3 and 4 from the original data is associated with the genetic marker number 25 on linkage group
1. We condition on both markers 25 and 55 and carry out a permutation analysis of linkage groups 3 and 4. The original t-statistics associated with linkage groups 3 and 4 are all below the estimated 95% critical value of 2.7738 (LOD = 1.6412), thus terminating the search.
Rice data: A cross between C039, a lowland indica cultivar developed in India, and Moroberekan, an up- land japonica cultivar developed in Guinea, was used to derive 203 recombinant inbred (R.I.) lines (F7 genera- tion) scored at 123 molecular markers. The trait of interest is root thickness (measured in microns) as it relates to root morphology and drought avoidance in rice (CHAMPOUX et al. 1995). Moroberekan has a deep thick root system, whereas C039 has shallow fine roots. The goal of this analysis is to identify regions of the genome associated with root thickness.
29 1
TABLE 1
CET values used in the sequential search applied to the rice root thickness data
Conditioning markers“ Chromosomeb t-testc LODd
RG214 RZ398 RG197 RG570 CD0533 RG136 CD0365 RZ576 RG13 RG437 RZ397 RZ892
4 6 1 9 7 8 11 3 5 2 12 10
3.337 3.228 3.231 3.136 3.037 2.897 2.736 2.626 2.595 1.995 1.952
2.377 2.227 2.232 2.105 1.978 1.803 1.612 1.487 1.453 .864 .848
a Indicates which marker was added at each step of analysis.
Chromosome on which QTL is detected.
Based on t-tests From 1000 conditional permutations of the original data.
where n1 and TQ are the sample sizes of the genotypic marker
classes, and Tis the t-test statistic (DOERGE 1995).
taken in various combinations with each other, thus implying some amount of interaction.
Both of the methods presented in this paper are a p plied to the R.I. data set using single marker analysis (t-tests). The CET analysis, when performed using 95% experimental permutation threshold values across the remaining genome, found a significant marker on each chromosome (Table 1). Among the markers found sig- nificant, RG214, RZ398, RG197, and RG437 verify the original analysis, however, no significance of RG811 is indicated. Since RG811 and RG197 are both on chro- mosome 1, and RG197 shows stronger evidence for link- age, RG811 is eliminated with the rest of the markers on chromosome 1. Each of the
12
regions detected by CET is associated with root morphology QTL (CHAM POUX et ul. 1995). Table 1 summarizes the results.The RET values were estimated using the structural model in Equation 1 to describe the behavior of the QTL effect and 95% experimental permutation thresh- olds. Markers RG214, RG197, RG351, and RG64 were found significant (Table
2).
While RG214 and RG197 correspond to the previous analyses, the structural QTL model may not be correct, due to the nonadditive na- ture of the markers ( CHAMPOUX et al. 1995).Simulations: The error rate characteristics of the se- quential search procedure have been studied by simula- tion. A known (random) genetic map was established as described in example 1. Monte Carlo simulation was used to generate 500 data sets each for 0, 1 and 2 QTL models (as described above). The Monte Carlo data were analyzed using t-tests, and the number of correct
TABLE 2
RET values used in the sequential search applied to the rice root thickness data
Conditioning markers“ Chromosomeb t-test‘ LODd
RG214 RG197 RG351 RG64
4 3.650 2.829
1 3.487 2.589
7 3.489 2.592
6 3.528 2.648
Indicates which marker was added at each step of analysis. Chromosome on which QTL is detected.
“Based on t-tests from 1000 residual permutations of the original data.
where n, and m2 are the sample sizes of the genotypic marker classes, and Tis the t-test statistic (DOERGE 1995).
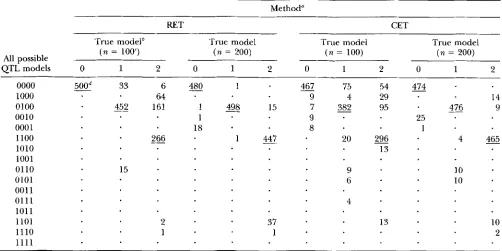
TABLE 3
Power simulations for CET and RET values
Method"
RET CET
True model6 True model True model True model
All possible
QTL models 0 1 2 0 1 2 0 1 2 0 1 2
( n = 1003 ( n = 200) ( n = 100) ( n = 200)
0000
md
33 6 4 8 0 1467
75 54 4g-1000 64 9 4 29 14
0100
452
161 1 % 15 7 3 8 2 95 476 90010 1 9 25
0001 18 8 1
1100
266
1 4 4 7 20296
4 4 6 51010 13
1001
0110 15 9 IO
0101 6 10
001 1
0111 4
1011
1101 2 37 13 10
1110 1 1 2
1 1 1 1
-
" 500 Monte Carlo simulations each of RET and GET sequential searches were carried out using single marker t-test, 95% permutation threshold values, and N = 1000 permutations.
''
QTL models for simulated data are 0 = 0000 (no QTL), 1 = 0100 (one QTL on chromosome 2), 2 = 1100 (one QTL on chromosomes 1 and 2 ) . The binary pattern indicates the presence ( 1 ) or absence (0) of a QTL on each of four chromosomes.'The table shows the number of times each of the possible models was indicated by the sequential search. The true model
n denotes sample size.
is underlined. A dot indicates that the model was never identified in any of the simulations.
tions were made for the third QTL on chromosome
ZZ.
The number of overcalls when compared to the un- dercalls were fewer.
DISCUSSION
Permutation tests provide a practical and easily imple- mented method to search a genome for multiple QTL. Once a major QTL has been detected, its phenotypic effects can be accounted for in the search for secondary QTL. Conditional and residual permutations provide critical values for the construction of valid hypothesis
TABLE 4
Power simulations for three QTL model using RET values
Result" n = 100 n = 200
Overcallb 2 45
Correct' 129 363
Undercalld 365 92
Incorrect' 4 0
500 Monte Carlo simulations.
'All three QTL plus nonsimulated QTL were identified. 'The correct 3 QTL model was identified.
Not all of the three QTL were detected. ' A I other incorrect models.
tests that account for the specifics of the experiment (e.g., marker density, missing data, nonnormality of trait values) as well as effects of known major QTL.
There are a number of test statistics available that can be used to locate QTL (WELLER 1986; LANDER and BOTSTEIN 1989; KNAPP et al. 1990; CARBONELL et al. 1992; HALEY and KNOTT 1992). Recently, (JANSEN 1993a,b; ZENG 1993, 1994) multiple regression-based methods have been presented that condition on the remainder of the genome for the purpose of con- structing a test in a defined interval. The concept is to test the current location within the interval void of any effects caused by additional QTL elsewhere in the ge- nome. ZENG (1993) notes that conditioning on linked markers in the analysis will increase the precision of the test and parameter estimation, yet decrease the sta-
tistical power of the test. While many discussions have arisen as to which test statistic i s "best", in the end, the key issues are power to detect QTL and robustness of the procedures to model assumptions. Statistical tests based on the permutation principle have many desir- able properties. In particular, they allow one to empiri- cally derive the distribution of a test statistic under an appropriate null hypothesis without relying on a distri- butional assumptions.
the classical Neyman-Pearson formulation of statistical hypotheses testing (LEHMANN 1986, pp. 74-76). This approach sets up a null hypothesis that is to be rejected in favor of an alternative in light of sufficient evidence in the data. A different approach to the QTL problem could be based on a decision theory viewpoint (BERGER
1985). The result of QTL analysis would be declaration of the certainty with which a QTL exists at a specific location, based upon prior knowledge of the experi- mental situation.
The problem of detecting and locating multiple QTL is complicated by many factors. When multiple QTL are unlinked and/or reside on different chromosomes, the methods presented here provide threshold values appropriate for testing secondary QTL effects. How- ever, when multiple QTL are tightly linked, increased frequency of recombinants may be the only hope for such differentiation, regardless of methodology. By in- creasing sample size, parameters may be estimated more accurately, and the power for detecting QTL in- creased. Unfortunately, even though the number of in- dividuals scored at each marker and measured trait may appear to be large enough for effective estimation, miss- ing marker data can quickly decrease samples to less than optimal numbers. While we assume that data are missing at random, a glance at almost any experimental data set will demonstrate otherwise. Contamination of samples, bad digest, or difficulty in scoring certain markers are among the sources that produce missing data patterns (specific individuals or markers). A de- scriptive summary of the marker, trait, and marker by trait missing data may aid in identifying markers and/ or traits that are responsible for loss of statistical power. The problem of missing genotype data can be serious and is worthy of further investigation.
Finally, the issue of cosegregation between QTL and distant markers that create ghost QTL effects may mis- lead the search for QTL. MARTINEZ and CURNOW (1992) present a simulation study where two QTL of equal effect, separated by one (empty) interval, create a ghost QTL in the empty interval having larger effect than either of the known QTL. When the QTL effects are changed to equal but opposing sign, the ghost QTL is eliminated. However, the estimation of QTL effects are underestimated. Ghost QTL are a key issue in the proper detection of QTL. Further work on distinguish- ing between ghost QTL and multiple QTL is needed to fully address the QTL detection/location problem.
Each of the methods presented in this paper is non- parametric in the sense that no distributional assump tions are placed on the error structure. One may con- sider the residual based thresholds as semiparametric since a structural model is employed to model the ef- fects of known QTL before calculating residuals. The conditional permutation thresholds are completely nonparametric, and allow one to account for multiple QTL without relying on the restrictions of model-based
parametric tests. Existing multiple QTL regression models (see above citations) assume independent and identically distributed normal error structure (mean 0 and variance 0').If the model assumptions are correct,
then these methods ( JANSEN 1993a,b; ZENC 1993,1994) may perform better. However, if the statistical model describing the QTL action is not valid, the protection against model failure provided by the nonparametric permutation methods is a realistic alternative.
We have generalized the permutation test to account for the effects of known major QTL through their asso- ciation with genetic markers. The two methods sug- gested here are direct extensions of previous work using permutation theory (CHURCHILI. and DOERCE 1994). Both methods are easily implemented and can be used in conjunction with any method of QTL detection for the purpose of estimating threshold values for specific experimental situations.
The authors thank M. BONIERBALE, S . MCCOLJCH and C. YENCHO for helpful discussions. The R.I. lines in example 2 were developed at the International Rice Research Institute by G. WAN(;. R.W.D. ac- knowledges financial support from the National Initiative Competitive Grants Program of the U.S. Department of Agriculture, Award 9 4 37300-0323. G.A.C. acknowledges financial assistance in part from the U S . Department of Agriculture and the U.S. Department of Energy.
LITERATURE CITED
BERGER, J. O., 1985 Statistical Decbion T h e q and Bayesian Analysis,
Ed. 2. Springer-Verlag. New York.
CARBONELL, E. A., T. M. GERIG, E. BAIANSARD and M. J. ASINS, 1992 Interval mapping in the analysis of nonadditive quantitative trait loci. Biometrics 48: 305-315.
CHAMPOUX, M. C., G. WANG, S . S-UNG, D. J. MACKII.~., J. C. O'TOOLE et al., 1995 Locating genes associated with root mor- phology and drought avoidance in rice via linkage to molecular markers. Theor. Appl. Genet. 9 0 969-981.
CHURCHILL., G. A., J. J. GIOVANNONI and S . D. TANKSLEY, 1993 Pooled-sampling makes high-resolution mapping practical with DNA markers. Proc. Natl. Acad. Sci. USA 9 0 16-20.
CHURCHILL, G. A., and R. W. DOERGE, 1994 Empirical threshold values for quantitative trait mapping. Genetics 138: 963-971. DAVIES, R. B., 1977 Hypothesis testing when nuisance parameter is
present only under the alternative. Biometrika 6 4 247-254. DOERGE, R. W., 1995 The relationship between the LOD score and
the analysis of variance F-statistic when detecting QTL using sin- gle markers. Appendix 1: locating genes associated with root morphology and drought avoidance in rice via linkage to molecu- lar markers. Theor. Appl. Genet. 9 0 969-981.
EFRON, B., 1993 A n Introduction to the Bootstrap. Chapman and Hall, New York.
W E Y , C. S . , and S . A. KNOTT, 1992 A simple regression method
for mapping quantitative trait loci in line crosses using flanking markers. Heredity 6 9 315-324.
JANSEN, R. C., 1993a A general mixture model for mapping quantita- tive trait loci by using molecular markers. Theor. Appl. Genet.
JANSEN, R. C., 1993b Interval mapping of multiple quantitative trait loci. Theor. Appl. Genet. 79: 583-592.
JANSEN, R. C., and P. STAM, 1994 High resolution of quantitative traits into multiple loci via interval mapping. Genetics 136: 1447-
1455.
JANSEN, R. C., 1994 Controlling the type I and type I1 errors in mapping quantitative trait loci. Genetics 138: 871-881. KNmP, S . J., W. C. BRIDGES and D. BIRKFS, 1990 Mapping quantita-
tive trait loci using molecular marker linkage maps. Theor. Appl. Genet. 79: 583-592.
methods for the mapping of quantitative trait loci in line crosses. Genet. Res. 60: 139-151.
LANDER, E. S . , and D. BOTSTEIN, 1986 Mapping complex genetic traits in humans: new methods using a complete RFLP linkage map. Cold Spring Harbor Symp. Quant. Biol. 51: 49-62. LANDER, E. S . , and D. BOTSTEIN, 1989 Mapping Mendelian factors
underlying quantitative traits using RFLP linkage maps. Genetics
LANDER, E. S . , and D. BOTSTEIN, 1994 Corrigendum. Genetics 36:
LEHMANN, E. C . 1986 Testing Statistical Hypotheses, Ed. 2. John Wiley. LINCOLN, S . , and E. LANDER, 1992a Systematic detection of errors
in genetic linkage data. Genomics 14: 604-610.
LINCOLN, S . , M. DNvand E. LANDER, 1992b Mapping genes control- ling quantitative trait3 with MA€"AKER/QTL 1.1. Whitehead Institute Technical Report, Ed. 2.
MARTINEZ, O., and R. N. CURNOW, 1992 Estimating the locations and the sizes of the effects of quantitative trait loci using flanking markers. Theor Appl Genet. 88: 480-488.
MCMILIAN, I., and A. ROBERTSON, 1974 The power of methods for the detection of major genes affecting quantitative characters. Heredity 32: 349-356.
PATERSON, A. H., E. S. LANDER, J. D. HEWITT, S . PETERSON, S . E. LINCOI.N rt al., 1988 Resolution of quantitative traits into Men- delian factors by using a complete linkage map of restriction fragment length polymorphisms. Nature 335: 721 -726.
121: 185-199.
705.
R E B A ~ , A,, B. GOFFINET and B. MANGIN, 1994 Approximate thresh- olds of interval mapping tests for QTL detection. Genetics 138:
235-240.
REBAI, A,, B. GOFFINET and B. M A N G I N , 1995 Comparing power of different methods of QTL detection. Biometrics 51: 87-99. SCHMOYER, R. L., 1994 Permutation tests for correlation in regres-
sion errors. JASA 89(428): 1507-1516.
TITTERINGTON, D. M., A. F. M. SMITH and U. E. MAKOV, 1985 Statisti- cal Analysis of Finite Mixture Distributions. ,John Wiley and Sons, New York.
WEILER, J. I., 1986 Maximum likelihood techniques for the map- ping and analysis of quantitative trait loci with the aid of genetic markers. Biometrics 42: 627-640.
WEILER, J. I., 1987 Mapping and analysis of quantitative trait loci in 1,ycycopersiron (tomato) with the aid of genetic markers using appropriate maximum likelihood methods. Heredity 59: 413-421. YOUNG, N. D., and S . D. TANKSLEY, 1989 Restriction fragment length polymorphism maps and the concept of graphical genotypes. Theor. Appl. Genet. 77: 95-101.
ZENG, Z.-B., 1993 Theoretical basis for separation of multiple linked gene effects in mapping quantitative trait loci. Proc. Natl. Acad. Sci. USA 90: 10972-10976.
ZENG, Z.-B., 1994 Precision mapping ofquantitative trait loci. Genet- ics 136: 1457-1468.