Copyright1999 by the Genetics Society of America
Estimation of Past Demographic Parameters From the Distribution of
Pairwise Differences When the Mutation Rates Vary Among Sites:
Application to Human Mitochondrial DNA
Stefan Schneider and Laurent Excoffier
Genetics and Biometry Laboratory, Department of Anthropology and Ecology, University of Geneva, CP 511 1211 Geneva 24, Switzerland Manuscript received July 30, 1998
Accepted for publication March 19, 1999
ABSTRACT
Distributions of pairwise differences often called “mismatch distributions” have been extensively used to estimate the demographic parameters of past population expansions. However, these estimations relied on the assumption that all mutations occurring in the ancestry of a pair of genes lead to observable differences (the infinite-sites model). This mutation model may not be very realistic, especially in the case of the control region of mitochondrial DNA, where this methodology has been mostly applied. In this article, we show how to infer past demographic parameters by explicitly taking into account a finite-sites model with heterogeneity of mutation rates. We also propose an alternative way to derive confidence intervals around the estimated parameters, based on a bootstrap approach. By checking the validity of these confidence intervals by simulations, we find that only those associated with the timing of the expansion are approximately correctly estimated, while those around the population sizes are overly large. We also propose a test of the validity of the estimated demographic expansion scenario, whose proper behavior is verified by simulation. We illustrate our method with human mitochondrial DNA, where estimates of expansion times are found to be 10–20% larger when taking into account heterogeneity of mutation rates than under the infinite-sites model.
W
ITH the advent of the coalescent theory (King- and its magnitude, but the choice of parameters to be man 1982), people have become increasingly estimated depends on a particular scenario of popula-aware of the profound effect of demography on the tion growth one might choose, such as exponential amount of genetic variability maintained in a popula- growth, logistic growth, or an instantaneous stepwise tion (Hudson1990;DonnellyandTavare´1997). Pop- population size change. These three models are obvi-ulation expansions or contractions indeed leave recog- ously related but have rarely been compared (but see nizable signatures in the pattern of molecular diversity Polanskiet al. 1998). The latter model has been favored (reviewed in Harpending et al. 1998). For instance, in the literature due to its simplicity and because simula-sudden demographic expansions lead to star-shaped tion studies have shown that it was a good approxima-phylogenies and unimodal distributions of pairwise dif- tion of rapid logistic growth (RogersandHarpending ferences (Slatkin and Hudson 1991; Rogers and 1992). Rogers andHarpending (1992) convincingly Harpending 1992), to a reduction of the number of showed that under an infinite-sites model, the shape of segregating sites (BertorelleandSlatkin1995;Aris- the distribution of the number of observed differences BrosouandExcoffier1996;Tajima1996), to a lower between pairs of DNA sequences (often called the mis-amount of linkage disequilibrium between linked loci match distribution) conveyed information on the tim-(Slatkin1994), or to the occurrence of a large propor- ing and the amplitude of a stepwise expansion. They tion of very low frequency mutations (FuandLi1993; proposed a nonlinear least-squares approach (Rogers Fu1997). Note that population bottlenecks usually have andHarpending1992) or a method of moments (Rog-other recognizable effects, often opposed to those of ers1995) to find the theoretical mismatch distribution population expansions (e.g., Tajima 1993; Cornuet that would best fit the observations. Several authors andLuikart1996;Harpendinget al. 1998). noted that this approach could be inadequate (Lund-When exposed to the evidence of a past demographic stromet al. 1992;BertorelleandSlatkin1995; Aris-expansion, one might want to estimate the parameters BrosouandExcoffier1996;WakeleyandHey1997) of the expansion, such as the time at which it occurred because the infinite-sites model was not realistic,espe-cially in the case of the mitochondrial genome where an important heterogeneity of mutation rates had been Corresponding author: Laurent Excoffier, Genetics and Biometry Lab, observed (Lundstromet al. 1992;Wakeley1993). In
Department of Anthropology and Ecology, University of Geneva, CP
fact, the presence of a few fast mutating sites can lead
511 1211 Geneva 24, Switzerland.
E-mail: [email protected] to unimodal mismatch distributions even for moderate
expansions (Lundstromet al. 1992;Aris-Brosouand Excoffier1996) and would thus lead to an underesti-mation of the age of the expansion and to an overestima-tion of its magnitude. Rogers and his collaborators tried to address these concerns. They concluded that both the mean number of pairwise difference (Rogers1992) and the confidence intervals around the estimated de-mographic parameters were relatively unaffected by slight to moderate amounts of rate heterogeneity (Rog-erset al. 1996). They thus proposed to ignore any het-erogeneity of mutation rates when estimating demo-graphic parameters from the mismatch distribution and therefore to stick to the infinite-sites predictions. One cannot be entirely satisfied by these conclusions because
Figure 1.—Diagrammatic representation of the
instanta-simulation studies have shown that the mean of the
neous stepwise demographic expansion model considered in mismatch distribution was indeed very sensitive to rate
this study. heterogeneity (Aris-BrosouandExcoffier1996) and
that the relative insensitivity of the confidence intervals to rate heterogeneity was mainly due to their very large
mutation rate per generation per gene. Here, Fi(u) is size (Rogerset al. 1996).
also the probability of observing i differences between We thus propose in this article to extend the model
two genes in an equilibrium population as (Watterson of Rogers andHarpending (1992) to explicitly take
1975) into account possible heterogeneity of mutation rates
when estimating the demographic parameters. We also
Fi(u)5 u i
(u 11)i11. (2)
propose an alternative way to derive confidence intervals around the estimated parameters based on a simple
RogersandHarpending(1992) rederived Equation 1 bootstrap approach. We check by simulations the
valid-and used it to describe the distribution of the number ity of those confidence intervals for a few test cases and
of pairwise differences between nonrecombining DNA show that only those associated with the timing of the
sequences or RFLP haplotypes in a given sample, which expansion are approximately correctly estimated. As
they called the “mismatch distribution.” They proposed one can sometimes observe a poor fit between the data
to estimate the demographic parametersu0,u1, as well
and the mismatch distribution predicted by the model,
as the expansion time t directly from this mismatch we also propose a test of the validity of the stepwise
distribution. demographic expansion scenario. We finally illustrate
The mismatch distribution under a finite-sites model:
our method by human data from the mitochondrial
Under the finite-sites model, F∞i(u1,u0,t) provides the
DNA control region.
distribution of the number of mutations having occurred during the evolution of a random pair of genes. Note THEORY AND METHODS that this number can be equal to or larger than the
number of observed differences, depending on whether
The mismatch distribution under the infinite-sites
the same site has been hit several times by mutations
model:We assume that t generations ago, a population
or not. In this case, the expected mismatch probability at equilibrium of size N0entered a demographic
expan-distribution noted by Fm
i(u1,u0,t) can be obtained by
sion phase to instantaneously reach a new size N1 and
taking into account those cases where j mutations ( j$ that it remained at that size ever since. Under this
demo-i) have led to exactly i differences, as graphic scenario described in Figure 1 and assuming
that every new mutation occurs at a new site [the
infinite-Fm
i(u1,u0,t)5
o
∞
j5i
F∞j(u1,u0,t)Hm(i, j ), (3)
sites mutation model ofKimura(1969)],Li(1977) de-rived an expression for the probability of observing i
where Hm(i, j ) is the conditional probability of observing differences between two genes taken at random from
i differences given j mutations have occurred in the this population, as
ancestry of two sequences of length m. We now describe how to obtain these conditional probabilities Hm(i, j ) F∞i(u1,u0,t)5Fi(u1)1 exp
1
2t(u111)
u1
2
starting with m51 and extending it to a sequence ofarbitrary length.
3
o
ij50
tj
tion (s) and transversion (v) rates subject to s1v51. finally have Conditional on the number of mutations, we consider
the mutation process as a random walk between the Hm(i, j )5
o
j2i11l50
b(l, j,p)(P11 P2)
nucleotides A, C, G, and T. This Markov process has
the single-step transition matrix 5
o
j2i11
l50
b(l, j, p){H1(1, l )Hm21(i2 1, j2l )
1 H1(0, l )Hm21(i, j2 l )}, (6)
M5 A C G T
A C G T
0 v/2 s v/2
v/2 0 v/2 s
s v/2 0 v/2
v/2 s v/2 0
,
where b(l, j, p) 5 ( j !/l !( j 2 l )!) pl(1 2 p)j2l is the binomial probability with parameter p51/m.
The mismatch distribution under a two-rates finite-sites model: Mutation rate heterogeneity arises when the mu-where the elements of each row add up to one. The jth
tation rates are not equal for all nucleotide sites. The power of the matrix M can be used to describe the
simplest form of heterogeneity to be considered is a two-impact of j mutations at that site. A closed-form
expres-rates mutation model, where we make the distinction sion for Mjcan be conveniently obtained by a
diagonal-between fast and slow sites. As most mutations accumu-ization of M, as M5VDV21, where D5 diag {2s,2s,
late at a small number of fast sites, convergent or reverse v1s,2v1s} and V is a matrix where the columns are
mutations can become quite common. The conse-the eigenvectors of M.
quence of this type of heterogeneity on the pattern of We thus obtain
diversity has been studied in the case of the control region of human mitochondrial DNA (Wakeley1993; Yang1994, 1996;BertorelleandSlatkin1995;Yang
Mj5VDjV215
aj bj gj bj
bj aj bj gj
gj bj aj bj
bj gj bj aj
, et al. 1995). FollowingYang(1996), who inferred the number of segregating sites in a stationary population under the finite-sites model for two classes of mutation where aj51⁄4(112(2s)j1(s2v)j),bj51⁄4(12(s2 rates, we can modify Equation 3 by considering that m1
v)j), andg
j51⁄4(122(2v)j1(s2v)j). The diagonal of the m sites are fast and that m2 are slow. In this
terms of Mj, here all equal toa
j, represent the probability case, we have to take into account all possible ways of of returning to the initial state after j mutations. It thus partitioning the i differences among the slow and fast follows that regions. If we assume that mutations occur indepen-dently, the probabilities of these partitions simply follow H1(0, j ):
5
P(no difference|j mutations) 5 aj,
a binomial distribution. The expected mismatch proba-bility distribution is thus given by
H1(1, j ):
5
P(one difference|j mutations)512 aj.
(4) Fm1;m2
i (u1,u0,t)5
o
∞
j5i
F∞j (u1,u0,t)
o
i
l50
o
j
k50
b(k, j, p) Multisite case, homogeneous mutation rates: Instead of
3Hm1(l, k) Hm2(i2
l, j2k), (7) deriving an explicit equation for Hm(i, j ), when m.1
we can compute these probabilities numerically using
where b(k, j, p) is the same binomial probability function a recurrence equation, as shown below. Let us suppose
as in Equation 6 but with parameter p5 m1r/(m1r 1
that we have already derived the probability Hm21(i, j )
m2) being the conditional probability that a mutation
and that we want to study the case for an additional site
will hit one of the m1 fast mutating sites, and r is here
and thus derive Hm(i, j ). Suppose that l mutations have
the ratio of fast and slow mutation rates. Note that Equa-occurred at the mth site and that the ( j2l ) remaining
tion 7 is the equivalent toYang’s (1996) Equation 39, mutations have occurred at the m21 other sites. The
derived for the case of a stationary population. Yang probability of observing overall i differences will depend
used an infinite-alleles mutation model, stipulating that upon whether we observe one or no difference at the
once a site is hit by one or more mutations, we observe mth site. With probability P1, one difference will be
ob-one difference. Due to the high transition bias, this served at the mth site and (i21) at the (m21) other
model also tends to overestimate the number of differ-sites, and with probability P2, all i differences will be
ences because it does not allow back mutations at non-observed among the (m21) other sites. Therefore,
segregating sites.
P1 5H1(1, l )Hm21(i21, j 2l ), Multisite case, m-rates mutation model: Suppose that we
have a sequence of length m and that each nucleotide P2 5H1(0, l )Hm21(i, j 2l ), (5)
has a potentially different probability pi (i5 1 . . . m) of being hit by a mutation, subject to the condition where we admit that Hm21(21, j 2 l ) 5 0. Summing
o
mi pi 51. Under this m-rates model, Hm(i, j ), noted over all possible l values and multiplying by the
relation given in (6) except that the parameter p is now to find those parameters that minimize the sum of square deviations (SSD) between the observed mis-equal to pn/
o
n
i51pi. Here n is the index of the recursion
match distribution {Fi–obs}, i51, . . . , n and its expecta-step (1#n# m), and pnthus changes at every step of
tion {Fi–exp} under a particular model. SSD is convention-the recursion. It is important to note that, unlike convention-the
ally defined as homogenous mutation rate case, the intermediate
re-currence matrices are here meaningless, and only the
SSD5
o
ni50
(Fi–obs2 Fi–exp)2. (9)
last matrix obtained by this recurrence is correct for the required heterogeneity pattern. Under this m-rates
mutation model, the expected mismatch distribution is Depending on which mutation model we consider, we not given in a more complex form than in the constant replaced {Fi–exp} by the quantities defined in Equations mutation rate case, as all the additional complexity of 3, 7, or 8. The Hooke-Jeeves algorithm starts from an the model is embedded in the term HmR(i, j ) to give
arbitrary initial set of parameters and converges by an iterative process to a local minimum. This minimization FmR
i (u1,u0,t)5
o
∞
j5i
F∞j (u1,u0,t)HmR(i, j ). (8) procedure was mainly chosen for its robustness and its
ability to converge under nontrivial conditions. Note that the two-rates model is a special case of the Bootstrap confidence intervals: We followed a para-present model and that it could be treated similarly. In metric bootstrap approach to generate percentile con-that case, the double summation of Equation 7 could fidence intervals around the estimated parameters uˆ1, be condensed into the last term of Equation 8. uˆ0, andtˆ (see, e.g.,Efron andTibshirani1993, p. 53 The mismatch distribution for gamma-distributed mutation and Chap. 13). The parametric model that we used here rates: A gamma distribution of mutation rates can be is a coalescent process with superimposed mutations. seen as a special case of the m-rates mutation model. We adapted the coalescent simulation program from Such a distribution has been hypothesized for ex- Hudson (1990) to generate B samples of DNA se-plaining the pattern of diversity in the control region quences according to the estimated parametersuˆ1, uˆ0,
of the mitochondrial genome (e.g.,KocherandWilson andtˆ. For each of the B simulated data sets, we applied 1991; Hasegawa et al. 1993; Wakeley 1993; Yang our estimation procedure according to Equation 3, 7, 1996). The density of the gamma distribution is given or 8 to evaluate B bootstrapped values u0*, u1*, and t*.
by For a given confidence levela, the approximate limits of the confidence interval were obtained as thea/2 and 12 a/2 percentile values (EfronandTibshirani1993, f(x)5 1
G(a)x a21e2x,
p. 168). It is important to emphasize that this form of parametric bootstrap assumes that the data are distrib-whereais the shape parameter of the gamma
distribu-uted according to the sudden expansion model. tion equal to V(x)/x2, the inverse of the square of the
Testing the validity of the sudden expansion model:
coefficient of variation of mutation rates. We can
discre-We tested the hypothesis that the observed data fitted tize the gamma distribution over the m nucleotides as
the sudden expansion model defined by the estimated follows. We draw an arbitrarily large number of
continu-parameters using the same parametric bootstrap ap-ous gamma-distributed variates (say 1 million) with
proach as described above. We used here SSD defined in mean and variance equal to the shape parameter a
Equation 9 as a test statistic. We obtained its distribution (AhrensandDieter1974). The variates are then sorted
under the hypothesis that the estimated parameters are and divided into m groups of equal size. The mean value
the true ones by simulating B samples around the esti-of the ith group is then taken as a discretely distributed
mated parameters. As before, we reestimated each time gamma variate p˜i. The relative probability of being hit
new parametersu0*,u1*, andt*and computed their
asso-by a mutation pi is then obtained by setting pi5
ciated sums of squares SSDsim. The P value of the test is
p˜i/
o
mi51p˜i. Those pi’s can then be used directly in
re-therefore approximated by cursion Equation 6 to get the probabilities HmR(i, j )
required in Equation 8.
P 5number of SSDsimlarger or equal to SSDobs
B .
In the present article, we used the values of the shape parametersacomputed by S. Meyer (Meyeret al. 1999)
on a human mtDNA control region sequence database To check the accuracy of this procedure, we generated 1000 random data sets for the parametersu051,u15
(Handtet al. 1998) asa 50.26 for HV1 anda 50.13
for HV2. 1000, ands53 under a two-rates model with 270 slow sites and 30 fast sites mutating 20 times faster than the
Estimation of past demographic parameters using a
least-squares approach:We estimated the demographic slow sites, which corresponds to the simulation condi-tions of the top of Table 1. The simulated distribution parametersu0,u1, andtfrom the mismatch distribution,
SSD statistic provides a valid test of the sudden expan- region (Gravenet al. 1995). Except for the curve based on Rogers’ method of moments (Rogers 1995), the sion model.
shapes of the theoretical mismatch distributions are very similar to each other and provide no real indication of RESULTS the validity of the underlying model. Note also that a much better fit is found for HV1 than for HV2. While We show in Figure 2 the theoretical mismatch
distri-the shape of distri-the best-fitted mismatch does not seem to butions and the demographic parameters estimated
us-depend much on the mutation model, the values of ing different methods and mutation models for the two
the estimated parameters do change quite extensively, hypervariable segments of Mandenka mtDNA control
especially the expansion timet, which shows larger val-ues for finite-sites models than for the infinite-sites model. This is of course due to the fact that several mutations can accumulate at a given site in finite-sites models and that a longer evolutionary time is necessary to lead to the same number of observed differences. The magnitude of the expansion is also found to be smaller in finite-sites models, in agreement with previ-ous simulation results (Aris-Brosou and Excoffier 1996).
In Figure 3, we show the expected mismatch distribu-tions fitted for the Turkana sample (Watsonet al. 1996) according to a finite-sites two-rates model (Figure 3a) and to a finite-sites gamma distribution model (Figure 3b). We also report the average mismatch distributions obtained from 5000 simulations performed according to the estimated parameters. Simulated and expected mismatch distributions are found to be in very good agreement, motivating the use of simulations to get empirical confidence intervals around the parameters. To check if these confidence intervals have good cov-erage properties (i.e., the true parameters should be included in the confidence interval with a probability 12 a), we performed a series of simulations for a set of predefined parameters. For a given set of parameters
u0, u1, and t, we simulated 1000 data sets from which
we estimated the parametersuˆ0,uˆ1, andtˆ. For each set
of estimated parameters, we simulated 1000 additional data sets from which new values u0*, u1*, and t* were
estimated. The distribution of these 1000 bootstrap val-ues was used to evaluate the lower and upper limits of a 100(12 a)% confidence interval around theuˆ0,uˆ1,
andtˆ values as thea/2 and 12 a/2 percentiles of the distribution, respectively. The results of these analyses are shown in Tables 1 and 2 for different types of muta-tion rate heterogeneity. It can be seen that the only parameter for which the bootstrap confidence interval has a good coverage ist, as the proportion of the times
Figure 2.—Theoretical mismatch distributions obtained
under different mutation models. Moments, Rogers’ method the true value is outside the confidence interval is ap-of moments (Rogers1995) based on the mean and the vari- proximately equal to the significance levela. Note, how-ance of the observed mismatch distribution. Infinite site,
Rog-ever, that the confidence interval is not well centered,
ersandHarpending(1992) method based on Li’s equation
as the true values outside the confidence interval are (Li1977). Two-rates, finite-sites model (300 bp). For HV1, 29
sites are mutating 12 times faster than the other sites, whereas always found on the left of the distribution. The boot-for HV2, 17 sites are mutating 22 times faster than the other strap confidence intervals for u0 and u1 are much too sites. m-rates, finite-sites model (300 bp) where mutation rates broad (the true value of the parameter is found too are supposed to follow a gamma distribution with shape
pa-often within the empirical confidence interval). In Fig-rametera equal to 0.26 for HV1 and 0.13 for HV2. Except
ure 4, we plot the distributions of the two statistics x2 for Rogers’ method of moments, the fit is done through a
least-squares procedure as defined in the text. xˆ and xˆ2x*for x5 tand for x5 u
conservative confidence interval due to a too large up-per bound (see Figure 4). Finally, both the estimate of the population size after the expansion and its confi-dence interval cannot be adequately recovered from the mismatch distribution. However, as the bias in u1
appears mainly due to an overly large upper bound, the lower bound for u1 could be useful even though still
underestimated.
For illustration purposes, we present in Figure 5 the expected mismatch distributions of a few human sam-ples analyzed for HV1 or HV2, as well as the limits of a 95% confidence interval around the mismatch distri-butions. Despite an obvious lack of goodness-of-fit for some distributions, the adequacy of the sudden expan-sion model could only be rejected for the Ngoebe HV2 sample (SSD P value5 0.007). For the other samples, random mismatch distributions generated by simula-tions lead to SSD values larger than the observation in .5% of the cases, making the observed mismatch distributions compatible with the estimated parameters.
DISCUSSION
In this study, we extend the model of Rogers and Harpending (1992) to estimate the parameters of a sudden stepwise demographic expansion by explicitly taking into account a possible heterogeneity of mutation rates. Contrary to previous claims (Rogers 1992;
Rog-Figure3.—Theoretical and simulated mismatch
distribu-ers et al. 1996), we find that the estimated values of tions for Turkana’s mtDNA HV1 (Watsonet al. 1996). The
the parameters and their confidence intervals are quite simulated line was obtained as the mean mismatch distribution
obtained after 5000 simulations according to the estimated sensitive to departure from the infinite-sites model. For parameters shown at the bottom of each graph. The estimated instance, the estimated values of the expansion time (t) parameters were obtained for (a) two-rates model: of 370 sites, shown in Figure 2 for the Mandenka population are 34 were considered mutating 11 times faster than the others;
found, respectively, 9 and 20% larger for HV1 and HV2 and (b) finite sites (370 bp) m-rates model assuming a gamma
when using a model with gamma-distributed mutation distribution of mutation rates (shape parametera 50.26).
The 95% confidence intervals of each estimated parameter are rates than for the infinite-sites model. Even though our shown within brackets and are obtained from the simulations. methodology appears computationally more intensive, it thus seems justified to take into account the known departures from the infinite sites model to estimate the confidence intervals, the bootstrap percentile method parameters of the stepwise demographic model. The requires that these two distributions be identical (see, present approach does not allow us to retrieve all the e.g.,Rice1995, p. 271). We can see that it is only approxi- parameters of a demographic expansion with the same mately the case fortbut not foru0or for u1 (data not efficiency. As shown in Tables 1 and 2, the expansion
shown for u1). Moreover, the estimations of t and u0 time (t) and the initial population size (u0) are the only
appear much less biased than that of u1. Note that a parameters that can be estimated without much bias
possible explanation of the bias foru1is mentioned in and with reasonable precision, while the estimation of
RogersandHarpending(1992), who rightly point out u1 is clearly biased upward. The confidence intervals that it is difficult to distinguish between a large expan- obtained from the parametric bootstrap approach are sion and a very large expansion, thus generating an fairly estimated only for the expansion time t, while upward bias in u1. Interestingly, the parameters of old those for the population sizes are clearly too large and
TABLE 1
Proportion of noninclusion of the exact parameter value: two mutation rates model
Parameters of the two-rates
Average
mutation modela Significance level
Demographic True estimated
m1 m2 r parameters values valueb 0.010 0.020 0.050 0.100
270 30 20 t 3 3.726 (1.195) 0.008 0.024 0.095 0.203
u0 1 0.812 (1.137) 0 0 0.004 0.061
u1 1000 3777 (7638) 0 0 0.002 0.015
290 10 50 t 3 3.854 (1.493) 0.010 0.023 0.089 0.189
u0 1 0.806 (1.051) 0 0 0.001 0.020
u1 1000 3246 (6664) 0 0 0.007 0.019
270 30 20 t 9 9.253 (1.037) 0.003 0.005 0.015 0.057
u0 1 0.822 (1.019) 0 0 0 0
u1 1000 4183 (8444) 0 0 0 0
290 10 50 t 9 9.286 (1.072) 0.004 0.009 0.023 0.056
u0 1 0.808 (1.019) 0 0 0 0
u1 1000 3986 (8917) 0 0 0 0.001
am
1is the number of slow sites; m2is the number of fast sites; r is the ratio of mutation rates between the
fast and the slow sites.
bAverage value of the parameters estimated from 1000 coalescent simulations around the true values (standard deviations shown in parentheses).
provide some information on the present population theoretical mismatch distribution. A set of demographic parametersu0,u1, andtwas declared compatible if the
size, there will often be too few of them to get a reliable
estimate of the present size, which will also tend to be goodness-of-fit statistic fell within a 95% confidence in-terval obtained by simulation. While this approach seems overestimated. The present parametric bootstrap
ap-proach for defining the confidence intervals differs valid, it requires much heavier computations than ours if one wants to adequately explore the space of possible somewhat from that described in previous studies
(Rog-ers1995;Rogerset al. 1996). The previous approaches parameters, as a series of simulations needs to be carried out for each set of parameters. Moreover, the potential consisted of finding a set of values of the demographic
parameter compatible with the observed data. The impact of the chosen goodness-of-fit statistic on the re-sults and the reliability of the confidence intervals has “compatibility” criterion was a statistic of
goodness-of-fit (mean absolute error) between the observed and the not been addressed. The fact that the effective
popula-TABLE 2
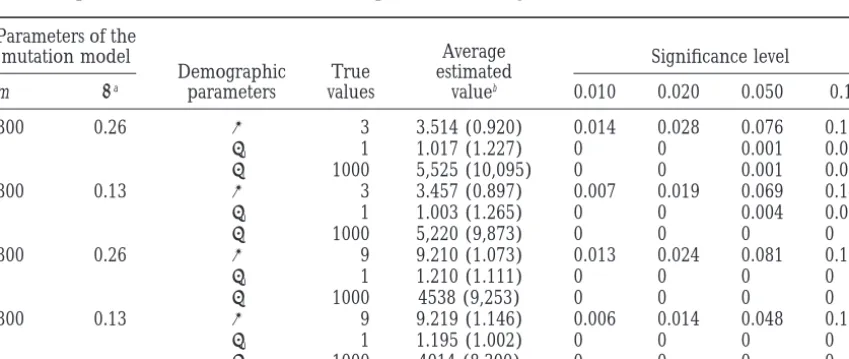
Proportion of noninclusion of the exact parameter value: gamma distribution of mutation rates
Parameters of the
Average
mutation model Significance level
Demographic True estimated
m aa parameters values valueb 0.010 0.020 0.050 0.10
300 0.26 t 3 3.514 (0.920) 0.014 0.028 0.076 0.183
u0 1 1.017 (1.227) 0 0 0.001 0.033
u1 1000 5,525 (10,095) 0 0 0.001 0.002
300 0.13 t 3 3.457 (0.897) 0.007 0.019 0.069 0.146
u0 1 1.003 (1.265) 0 0 0.004 0.039
u1 1000 5,220 (9,873) 0 0 0 0
300 0.26 t 9 9.210 (1.073) 0.013 0.024 0.081 0.152
u0 1 1.210 (1.111) 0 0 0 0
u1 1000 4538 (9,253) 0 0 0 0
300 0.13 t 9 9.219 (1.146) 0.006 0.014 0.048 0.112
u0 1 1.195 (1.002) 0 0 0 0
u1 1000 4014 (8,300) 0 0 0 0
aShape parameter of the gamma distribution.
to small changes in the mismatch distribution (see also Rogers 1997). Conversely, small differences in the shape of the observed mismatch distribution will pro-foundly affect the values of the estimated parameters. As the estimation of the expansion timetdepends essen-tially on the mean of the mismatch distribution (Rogers andHarpending1992), while the other parametersu0
andu1depend on higher moments of the distribution,
those latter two parameters are more likely to be affected by the stochasticity of the genealogical process thant. This is in keeping with our simulations, which show that the expansion time is usually quite well recovered from the mismatch distribution (Tables 1 and 2).
Even though we have refined the mutation model for mtDNA sequences, one can see that the theoretical mismatch distributions do not always perfectly fit with the observed distributions (Figures 2, 3, and 5). We can see two reasons explaining this discrepancy.
First, the single stepwise expansion model may be inadequate for some populations. Alternative popula-tion expansion models such as exponential growth or logistic growth could be more realistic that the stepwise growth used in this study (Polanskiet al. 1998), but as long as the magnitude of the expansion is large and we start from a small population, they should lead to results very similar to those provided here (Rogersand Har-pending1992;Rogers1997). It seems more likely that demographic scenarios very different from population growth may explain these discrepancies. Population contractions may indeed have occurred in some popula-tions and could explain the rejection of the sudden expansion model. A population crash could have oc-curred in the Ngoebe population from Panama, as well as in other native Amerindian populations, where the hypothesis of sudden expansion is not supported, as in the Kuna from Panama (P 5 0.05, HV1), the Huetar from Costa-Rica (P 5 0.026, HV2), or the Mapuche
Figure 4.—Verification of the validity of the parametric
bootstrap procedure. The distribution of the difference be- from Argentina (P50.009, HV2). Additional evidence tween the true value of the parameter (x) and its estimation for a recent population contraction comes from the from the simulation (xˆ) (1000 values) is compared to the
observation of large positive values for Tajima’s D-statis-distribution of the difference between the simulated (xˆ) and
tics (Tajima 1989) in those populations (results not bootstrapped parameter values (x*) (1,000,000 values). The
shown), which are expected in the case of a recent two statistics x2xˆ and xˆ2x*should be identically distributed
for parametric bootstrap to work. (Top) x 5 t 53,u051, population bottleneck (Tajima 1993). Note also that
u151000. (Bottom) x5 u051,t 53,u151000. other factors like admixture events, population
sub-structure, or inbreeding could all affect the shape of the mismatch distribution but to an extent that has not tion sizes are not well recovered from the mismatch yet been quantified.
Figure 5.—Empirical 95% “confidence intervals” for the mismatch distribution in four human populations analyzed for mtDNA control region. In all cases, a finite-sites mutation model was used, assuming gamma distribution of muta-tion rates (a 5 0.26 for HV1 anda 50.13 for HV2). For the Ngoebe sample (Kolmanet al. 1995), the hypothesis of sud-den expansion is rejected by the SSD test (P50.007). The SSD P values for the other samples are as follows: English HV1 (Piercyet al. 1995), 0.764; Mandenka HV2 (Gravenet al. 1995), 0.0652; !Kung HV1
(Vigilantet al. 1991), 0.1368.
on those branches. In that case, the correlation between after having introduced a more realistic mutation model, we still find that the observed number of segre-the number of pairwise differences (dij) will only be due
to shared external branches (i.e., d12 and d13 will be gating sites is not always in agreement with the
distribu-tion obtained from simuladistribu-tions based on the estimated correlated due to the shared lineage leading to
se-quence 1, but d12and d34should be almost independent), demographic parameters. For instance, considering the
mismatch distributions shown in Figure 5, even if we get and our derivations should better hold at the sample
level. On the other hand, for stationary populations or a perfect fit for the English HV1 sample, the estimated parameters lead on average to far fewer segregating sites relatively small or remote expansions, some coalescent
events will occur before and after the expansion. The than observed, although not significantly so (Sobs567;
Smean560.6; SD(S)56.2; P50.872). Interestingly, the
internal branches will be longer and have a large
associ-ated variance. Those equations, while still being correct Mandenka sample presents a significant lack of segregat-ing sites for HV2 as compared to the estimated expan-for a single pair of genes, will thus not allow us to get
the sample distribution of pairwise differences as they sion conditions (Sobs 5 27; Smean 5 38.0; SD(S) 5 5.0;
P5 0.014). This discrepancy could be explained by a do not take into account the covariance of pairwise
differences. Therefore, the present method is not ex- very large heterogeneity of mutation rates in HV2 for this population, but it seems difficult to understand how pected to recover the parameters of a demographic
expansion efficiently unless the expansion has been very and why the structural and functional constraints that are supposed to shape the heterogeneity of mutation large.
Although mismatch distributions carry some informa- rates (Wakeley1993, p. 614) could differ between pop-ulations. Additional studies on that matter would never-tion on the shape of the underlying gene genealogy
and coalescent process, other aspects of molecular diver- theless be needed to exclude this possibility.
To get absolute values for the demographic parame-sity are not explicitly taken into account by this
ap-proach. It has been shown that demographic parameters ters inferred using the present approach, one should get an estimation of the substitution rate at the nucleo-recovered from the mismatch distribution did not allow
the correct prediction of the number of observed poly- tide level. The real value of mutation rate in humans has recently been the subject of an intense debate between morphic sites (Bertorelle and Slatkin 1995) or of
the distribution of mutation frequencies (Wakeleyand those advocating the use of a phylogenetic mutation rate (z33 1026 substitutions per site per generation
Hey 1997) for human mtDNA. This could either be
human mtDNA control region sequences. Nucleic Acids Res. 26:
the mutation process directly on pedigrees giving
num-126–129.
bers z10 times larger (z2.7 3 1025 substitutions per
Harpending, H. C., M. A. Batzer, M. Gurven, L. B. Jorde, A. R. Rogerset al., 1998 Genetic traces of ancient demography. Proc.
site per generation;Howellet al. 1996;Parsonset al.
Natl. Acad. Sci. USA 95: 1961–1967.
1997; Parsons and Holland 1998). For the present
Hasegawa, M., A. DiRienzo, T. D. KocherandA. C. Wilson,1993
methodology to be fully beneficial, it thus seems highly Toward a more accurate time scale for the human mitochondrial
DNA tree. J. Mol. Evol. 37: 347–354.
necessary to get reliable estimates of mutation rates.
Hooke, R.,andT. A. Jeeves,1963 “Direct search” solution of
numer-Otherwise, the importance of taking into account more
ical and statistical problem. J. Assoc. Comput. Machinery 8: 212–
realistic mutation models would seem rather futile. 229.
Howell, N., I. KubachaandD. A. Mackey,1996 How rapidly does
Even if the present approach is an improvement over
the human mitochondrial genome evolve? Am. J. Hum. Genet.
previous methods, it seems that the use of the mismatch
59:501–509.
distribution as a summary statistic may not exploit the Hudson, R. R.,1990 Gene genealogies and the coalescent process,
pp. 1–44 in Oxford Surveys in Evolutionary Biology, edited byD. J.
full potential of molecular data and that
maximum-FutuymaandJ. D. Antonovics.Oxford University Press, New
likelihood methods that take into account phylogenetic
York.
relationships between DNA sequences (e.g.,Griffiths Jazin, E., H. Soodyall, P. Jalonen, E. Lindholm, M. Stonekinget al., 1998 Mitochondrial mutation rate revisited: hot spots and
and Tavare´ 1994; Kuhner et al. 1995; Tavare´ et al.
polymorphism. Nat. Genet. 18: 109–110.
1997; Kuhner et al. 1998; Weiss and von Haeseler
Kimura, M., 1969 The number of heterozygous nucleotide sites
1998) would be needed to get more reliable estimates maintained in a finite population due to the steady flux of
muta-tions. Genetics 61: 893–903.
of demographic parameters. However, considering the
Kimura, M.,1980 A simple method for estimating evolutionary rate
fact that these methods are extremely
computer-inten-of base substitution through comparative studies computer-inten-of nucleotide
sive when heterogeneity of mutation rates is considered, sequences. J. Mol. Evol. 16: 111–120.
Kingman, J. F. C.,1982 The coalescent. Stochastic Process. Appl.
the present approach may still be useful in most
practi-13:235–248.
cal purposes.
Kocher, T. D.,andA. C. Wilson,1991 Sequence evolution of mito-chondrial DNA in humans and chimpanzees: control region and We are grateful to Ziheng Yang, Monty Slatkin, and two anonymous
protein-coding region, pp. 391–413 in Evolution of Life: Fossils, reviewers for their helpful comments on the manuscript and to Simon
Molecules and Culture, edited byS. OsawaandT. Honjo. Springer-Tavare´ for some useful advice. We thank Alan Rogers for providing
Verlag, Tokyo. us with C source code for generating gamma-distributed random
Kolman, C. J., E. Bermingham, R. Cooke, R. H. Ward, T. D. Arias variates. We are grateful to Andre´ Langaney for his support
through-et al., 1995 Reduced mtDNA diversity in the Ngobe Amerinds out this work. This study was made possible by Swiss National Fund of Panama. Genetics 140: 275–283.
grant nos. 32-047053.96 and 31-039847.93. A program for computing Kuhner, M. K., J. Yamato and J. Felsenstein, 1995 Estimating the estimated demographic parameters from the mismatch distribu- effective population size and mutation rate from sequence data tion and performing the tests described in this article is available from using Metropolis-Hastings sampling. Genetics 140: 1421–1430.
Kuhner, M. K., J. Yamato andJ. Felsenstein, 1998 Maximum-S.S. upon request. These programs are also integrated into the Arlequin
likelihood estimation of population growth rates based on the software, available on http://anthropologie.unige.ch/arlequin/.
coalescent. Genetics 149: 429–434.
Li, W. H.,1977 Distribution of nucleotide differences between two randomly chosen cistrons in a finite population. Genetics 85: 331–337.
LITERATURE CITED
Lundstrom, R., S. Tavare´andR. H. Ward,1992 Modeling the evolution of the human mitochondrial genome. Math. Biosci. Ahrens, J. H.,andU. Dieter,1974 Computer methods for sampling
from gamma, beta, Poisson, and binomial distributions. Comput- 112:319–335.
Meyer, S., G. WeissandA. von Haeseler,1999 Pattern of nucleo-ing 12: 223–246.
Aris-Brosou, S.,andL. Excoffier,1996 The impact of population tide substitution and rate heterogeneity in the hypervariable re-gions I and II of human mtDNA. Genetics 152: 1103–1110. expansion and mutation rate heterogeneity on DNA sequence
polymorphism. Mol. Biol. Evol. 13: 494–504. Parsons, T. J.,andM. M. Holland,1998 Reply to Jazin et al. Nat.
Genet. 18: 110. Bertorelle, G.,andM. Slatkin,1995 The number of segregating
sites in expanding human populations, with implications for esti- Parsons, T. J., D. S. Muniec, K. Sullivan, N. Woodyatt, R. Allis-ton-Greineret al., 1997 A high observed substitution rate in mates of demographic parameters. Mol. Biol. Evol. 12: 887–892.
Cornuet, J. M.,andG. Luikart,1996 Description and power analy- the human mitochondrial DNA control region. Nat. Genet. 15: 363–368.
sis of two tests for detecting recent population bottlenecks from
allele frequency data. Genetics 144: 2001–2014. Piercy, R., K. M. Sullivan, N. Benson and P. Gill,1995 The
application of mitochondrial DNA typing to the study of white Donnelly, P.,andS. Tavare´,1997 Progress in Population Genetics
and Human Evolution. Springer-Verlag, New York. Caucasian genetic identification. Int. J. Legal. Med. 106: 85–90. Polanski, A., M. KimmelandR. Chakraborty,1998 Application Efron, B.,andR. J. Tibshirani,1993 An Introduction to the Bootstrap.
Chapman and Hall, London. of a time-dependent coalescence process for inferring the history
of population size changes from DNA sequence data. Proc. Natl. Fu, Y.-X., 1997 Statistical tests of neutrality of mutations against
population growth, hitchhiking and background selection. Ge- Acad. Sci. USA 95: 5456–5461.
Rice, J. A.,1995 Mathematical Statistics and Data Analysis. Duxburry
netics 147: 915–925.
Fu, Y. X.,andW. H. Li,1993 Statistical tests of neutrality of muta- Press, Belmont, CA.
Rogers, A.,1992 Error introduced by the infinite-sites model. Mol. tions. Genetics 133: 693–709.
Graven, L., G. Passarino, O. Semino, P. Boursot, A. S. Santachi- Biol. Evol. 9: 1181–1184.
Rogers, A., 1995 Genetic evidence for a Pleistocene population ara-Benerecettiet al., 1995 Evolutionary correlation between
control region sequence and RFLP diversity pattern in the mito- explosion. Evolution 49: 608–615.
Rogers, A. R.,1997 Population structure and modern humans ori-chondrial genome of a Senegalese sample. Mol. Biol. Evol. 12:
334–345. gins, pp. 55–79 in Progress in Population Genetics and Human
Evolu-tion, edited byP. DonnellyandS. Tavare´.Springer-Verlag, New Griffiths, R. C.,andS. Tavare´,1994 Ancestral inference in
popula-tion genetics. Stat. Sci. 9: 307–319. York.
waves in the distribution of pairwise genetic differences. Mol. Wilson,1991 African populations and the evolution of mito-chondrial DNA. Science 253: 1503–1507.
Biol. Evol. 9: 552–569.
Wakeley, J.,1993 Substitution rate variation among sites in hyper-Rogers, A. R., A. E. Fraley, M. J. Bamshad, W. S. WatkinsandL. B.
variable region I of human mitochondrial DNA. J. Mol. Evol. 37: Jorde,1996 Mitochondrial mismatch analysis is insensitive to
613–623. the mutational process. Mol. Biol. Evol. 13: 895–902.
Wakeley, J.,andJ. Hey,1997 Estimating ancestral population pa-Slatkin, M.,1994 Linkage disequilibrium in growing and stable
rameters. Genetics 145: 847–855. populations. Genetics 137: 331–336.
Watson, E., K. Bauer, R. Aman, G. Weiss, A. von Haeseleret al.,
Slatkin, M.,andR. R. Hudson,1991 Pairwise comparisons of
mito-1996 mtDNA sequence diversity in Africa. Am. J. Hum. Genet. chondrial DNA sequences in stable and exponentially growing
59:437–444. populations. Genetics 129: 555–562.
Watterson, G.,1975 On the number of segregating sites in geneti-Tajima, F.,1989 The effect of change in population size on DNA
cal models without recombination. Theor. Popul. Biol. 7: 256– polymorphism. Genetics 123: 597–601.
276. Tajima, F.,1993 Measurement of DNA polymorphism, pp. 37–59
Weiss, G., and A. von Haeseler, 1998 Inference of population in Mechanisms of Molecular Evolution. Introduction to Molecular
Paleo-history using a likelihood approach. Genetics 149: 1539–1546.
population Biology, edited byN. TakahataandA. G. Clark.Japan
Yang, Z.,1994 Maximum likelihood phylogenetic estimation from Scientific Societies Press, Sinauer Associates, Tokyo/Sunderland,
DNA sequences with variable rates over sites: approximate
meth-MA. ods. J. Mol. Evol. 39: 306–341.
Tajima, F.,1996 The amount of DNA polymorphism maintained in Yang, Z., 1996 Statistical properties of a DNA sample under the a finite population when the neutral mutation rate varies among finite-sites model. Genetics 144: 1941–1950.
sites. Genetics 143: 1457–1465. Yang, Z., S. KumarandM. Nei,1995 A new method of inference
Tavare´, S., D. Balding, R. C. GriffithsandP. Donnely,1997 In- of ancestral nucleotide and amino acid sequences. Genetics 141:
ferring coalescence times from DNA sequence data. Genetics 1641–1650.
145:505–518.