Self-Adapting Method for Edge Detection:
Application to Images of Non-Isothermal Air
Flow
Adil Rachek
1, Colette Padet
2Professor, Département of Industrial Processes Engineering, Ecole Nationale Supérieure des Mines de Rabat, Morocco1
Professor, Groupe de Recherche en Sciences Pour l’Ingénieur/ Thermomécanique, UFR Sciences Exactes et Naturelles,
Université de Reims, France 2
ABSTRACT: In this paper, we propose a self-adapting method for edge detection of the non-isothermal air flow images. In this method the localisation of the edge points is obtained by the intersection of the original image with a filtered one. The filtered image is found by the application of an optimal two-dimensional low-pass filter on the original one. The optimal filter window size is determined by a criteria based on the Index of Non-Linearity (INL). Then, we will present the application of this method to images obtained by laser tomography of an non-isothermal air flow. The efficiency of this method is evaluated by comparing its results to those obtained by other existing techniques as the operator of Prewitt, the Laplacien, and the Canny operator.
KEYWORDS:Flow structure, Edge detection, Air flow, Image processing.
I. INTRODUCTION
The fluids flow analysis by the use of images is an approach used to apprehend phenomena whose existence is not always represented by models. It is also used for the spatial localization of a particular phenomenon in the flow, like the detachment of the vorticity in the shearing of two fluids, the jet attachment to a solid surface by Coanda effect or inversely its detachment from the surface under gravity effects for an no-isothermal flow. Knowing this information is very important for the analysis, but the interpretation of the images is somehow complicated because it is always based on the observer's subjectivity. The edges detection may play a major role to facilitate the analysis by reducing the observer's subjectivity. Indeed, edges often correspond to rapid change of some physical properties. In the context of the image processing, the edges can be associated to a fast variation of the grey level.
Several methods have been proposed for edge detection, we can classify them in three categories: the differential methods, the methods by optimization based on the modeling of edges and noises and finally the statistical methods In the first category, the first-order differential operators [1-4] such as the Robert, Sobel and Prewitt ones are convolved with images to enhance spatial intensity changes, then a threshold is applied to obtain edge points. But the second-order differential operator [5-7], such as the Laplacian one, indicates edge points by its zero-crossing property. In practice, to make edges explicit through differentiation, one looks for extrema of the gradient or zeros of the Laplacian. These operators bring out the edge by detecting sudden variations of grayness.
efficiently approximated by the first derivative of a Gaussian function in the one-dimensional case. But in the same time as Canny works, Shen and Castan [9,10] used, as an optimal filter, the first derivative of Poisson function instead of the Gaussian one.
The last category [11-13] is based on the statistical comparison of two populations: the first one represents the points "edge" while the second one represents the points "non edge". The main inconvenience of this technique is that it is necessary to know the evolution of the grey level in the two regions close the edge to detect. Therefore, it can be applied in those cases where the different edges are known. However, in the general case the edges in an image are often difficult to detect by eyes.
To use these models, some parameters of big influence on the results like (the doorstep, the scale,…) must be chosen. So, the observer's subjectivity will play a major role on the results because the user will choose the parameters according to his judgement of what are the "true" edges in the image. To avoid the observer's subjectivity in the analysis of the image, we developed an auto-adaptive method for edge detection in image processing.
In the first part of this paper, we present our method. Then, we apply it on an images obtained by laser tomography of a non-isothermal air flow. Finally, we evaluate the performance of this method by comparing it to other existing techniques as those based on the operator of Prewitt, the Laplacien, and the Canny operator.
II. METHODPRESENTATION
A. Method principle
In the proposed method, the localisation of the edge points is obtained by the intersection of the original image with a filtered one. The filtered image is obtained by the application of an optimal two-dimensional low-pass filter on the original one. The optimal filter window size is obtained by a criteria based on the Index of Non-Linearity (INL). The inlgramme which represents the evolution of the INL according to the filter window size has the particularity to present, according to cases, landing trends or variations of slope leading to extremas. The criteria chosen to determine the optimal filter window size is to take the first minimum of the inlgramme. This choice is made to allow us to keep useful information while eliminating noises, because with increasing window size more and more information may be lost.
B. Numerical image definition
I A numerical image is a two-dimensional discreet signal represented by the application:
) j , i ( I ) j , i ( : I
N N :
I 2
where I(i,j) is an image element corresponding to coordinates (i,j) and called pixel (picture element). The value of I(i,j) can be a grey intensity for grey level images or a colour value for coloured images. Generally, in the RVB system, the last ones include three components red, green and blue. In our study we are interested only in grey level images. The value of a pixel gives representative information of the image in an element of the considered pave.
1 L 1 K 2 L 1 K 10 K 10 K
1 L 1 2 L 1 12 11 10
1 L 0 2 L 0 02 01 00
I I I
I
I I I I I
I I I I I
) j , i ( I
C. Two-dimensionnel low-pass filter : moving average
Let I(i,j) be an element of the original image corresponding to coordinates (i,j). The moving average of I(i,j) is defined by the following formula:
2 N 2 N n 2 N 2 N mN(n,m)I(i n,j m)
h ) m , n ( a ) j , i ( I (1)
where: hN(n,m) is the impulse response of the filter and a(n,m) is the Hamming window of size NN, these terms
are given by:
m N m 2 sin n N n 2 sin ) m , n ( hN 2 N m , 2 N n N m 2 cos 46 . 0 54 . 0 N n 2 cos 46 . 0 54 . 0 ) m , n ( a
The use of a filter will modify the image aspect and moreover some information will be lost. The amount of the lost information depends directly on the window size. The choice of the low-pass filter results from the aim to eliminate some details, from this point of view, the best choice of the window size needs objective criterion without an arbitrary choice of the user. This criterion can be given by the mean of the index of non-linearity (INL).
D. Determination of the filter window length
Let I(i,j) be the average of the image elements I(i,j), the index of non Linearity is defined by the following formula:
1 N 1 j 2 / 1 2 min max 1 N 1 j 2 / 1 1 N 1 j 2 2 / 1 I I ) j , i ( I ) 1 j , i ( I 1 ) j , i ( I ) 1 j , i ( I ) 1 , i ( I ) 1 N , i ( I ) j , i ( I ) 1 j , i ( I 1 N 1 N ) i ( INL(2)
The index of non linearity is composed of two terms; the first one corresponds to the fluctuation ratio and the second one to the curve length. So, the evolution of the values in the image represented by I(i,j) can appears in a statistical form in the first term and in a structural form representing the function irregularity in the second one.
For every window size N used in the filter, a filtered image IN(i,j) can be obtained and then after, an associated index
bottom or some constant values. The corresponding values of the windows size N can be determined by the mean of the first derivative of the INLgramme. These values give us the criteria to choose the best window size.
E. Edges detection
The intersection of the original image and the filtered one based on the best window size will occur in the region of rapid change of the grey level. So, in this manner we can obtain the edges image. In order to localize the intersection points, we evaluate for every pixel the intensity of its four nearest neighbors: the right, left, top and bottom ones and then we calculate the following products:
I(i,j 1) I(i,j 1)
I(i,j 1) I(i,j 1)
P
) j , 1 i ( I ) j , 1 i ( I ) j , 1 i ( I ) j , 1 i ( I P
V H
(3)
which will be of negative sign for edge points.
This non linear operation gives a black and white image with only two levels: 0 if the point belongs to the edge and 255 in the other case..
III. APPLICATION AND COMPARAISON
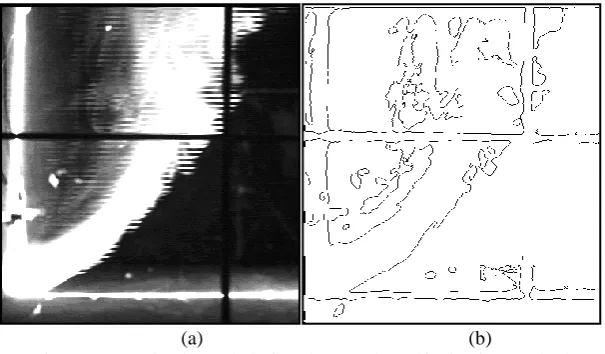
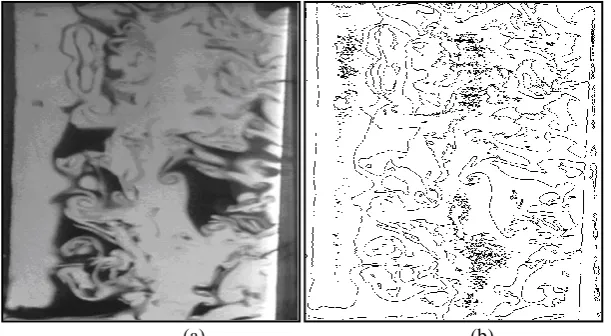
We apply the proposed method to two different images obtained from an experimental setup by visualization technique using laser tomography. The first one represents a non-isothermal air flow diffused close to a floor (Fig. 1 (a)). From a phenomenal point of view, this case is similar to that one of a cold air flow diffused close to the ceiling. The position of the detachment point of the air jet from the ceiling surface under the gravity forces is needed for its utility in the prediction of the user thermal comfort by using the air-conditioned system in the studied room. So, we must detect and localize in an optimal way the edges of the jet which will facilitate the determination of its detachment point. The second image represents a vertical air flow near a vertical surface in mixed convection regime (Fig. 3 (a)). The objective of this study was the determination of the flow structure inside the air flow. This goal can be easily achieved by a good detection and localization of the edges in the image.
(a) (b)
Fig. 1 (a) Non-isothermal air flow image, (b) Self-adapting method
continuous. Thus, these edges describe well the shape of the objects contained in the original image and specially that one of the air flow. Moreover, these edges have been detected in an selfadaptive manner without making any arbitrary choice of parameters as the step, the scale of observation,…etc.
(c) (d) (e)
Fig. 2 (c) Prewitt operator, (d) Laplacian operator, (e) Canny operator
In order to evaluate the performance of the proposed method, we compare its results with those ones obtained by other existing techniques for the edges detection as those based on the operators of Prewitt, the Laplacien and Canny.
As we can see in Fig. 2 (c), the Prewitt operator detects well the edges in the regions of good contrast, but it lakes in that ones of low contrasts where some edge points visible by eyes are not detected by the algorithm and consequently the edges are not complete.
On the other hand, the Laplacien and Canny operators detect the edges in a good manner even in low contrast regions (Fig. 2 (d) and (e)). But, we can observe some discontinuity in the edges. Anyway, the results obtained by these methods are better than the Prewitt operator.
(a) (b)
(c) (d) (e) Fig. 4 (c) Prewitt operator, (d) Laplacian operator, (e) Canny operator
The method is applied to a second image of non-isothermal air flow in mixed convection regime (Fig. 3 (a)), obtained by laser tomography. The good results obtained by this method (Fig. 3 (b)) confirm its effectiveness to give a better drawing of the edges. Moreover, we compare the result with another existing operators presented in the literature, like the Prewitt operator (Fig. 4 (c)), the Laplacian operator ((Fig. 4 (d)) and the Canny one ((Fig. 4 (e)). We can observe that the different operators give a part of the edges, and one of them like the Prewitt operator fail to detect edges when there is a slow spatial variation of the intensity. But, the Canny operator and the Laplacian operator give a better detection of the edges with an advantage of our method in the detection of some details.
Finally, from the precedent comparison we can say that the proposed method has two advantages: the first one it detects and localizes the edges in the images in both low and high contrast in a good manner, the second advantage it makes this detection in an objective way without the need of any subjective paramertes unlike the other used algorithm.
IV. CONCLUSION
The proposed method gives satisfactory results for the two cases studied in this paper. The edges contained in the images of air flow have been detected in a complete and perfect way without making any arbitrary choice of parameters contrary to the other existing techniques. The obtained edges represent the extent of the flow which will allow an easy study of its structure. Moreover, this method has been used on other type of images and gives in a similar way good results.
REFERENCES
[1] Roberts, L. G., “Machine perception of three-dimensional solids”. In Optical and Electrooptical Infomation Processing, J.T.Trippett et al. Eds. Cambridge, MA : MIT Press, pp. 159-197, 1965.
[2] Prewitt, J. M. S., “Object enhancement and extraction”, in:B.S. Lipkin, A. Rosenfeld (Eds.), Picture Processing and Psychopictorics, Academic Press, New York, 1970.
[3] Kirsch,R., “Computer determination of the constituent structure of biological images”, Comput. Biomed. Res. 4, pp. 314-328, 1971.
[4] Duda, R. O. and Hart, P. E., “Pattern classification and scene analysis”, Wiley, New York, pp. 271-272, 1973.
[5] Haralick, R. M., “Digital step edges from zero crossing of second directional derivatives”, IEEE Transactions on Pattern Analysis and Machine Intelligence, Vol. 6, pp. 58-68, 1984.
[6] Marr D., Hidreth E., “Theory of edge detection”, Proc. Roy. Soc. London PAMI-6 58, 1984.
[7] Cocquerez, J. P. and Philipp, S. , “Analyse d’images : filtrage et segmentation”, Masson, 1995.
[8] Canny J., “Computational approach to edge detection”, IEEE Trans. Pattern Anal. Mach. Intell. PAMI-8, 1986.
[9] Deriche, R. and Giraudon, G., “A computational approach for corner and vertex detection”, International Journal of Computer Visio, Vol.10), pp. 101-124, 1993.
[10] Shen J., Castan S., “An Optimal Linear Operator for Step Edge Detection”, CVGIP, Vol. 54, pp. 112-133, 1992.
[11] Souza, P. D., “Edge detection using sliding statistical tests”. Computer vision, graphics, and image processing, Vol. 23, pp. 1-14, 1983.
[12] Huang J.S., Tseng D.H., “ Statistical theory of edge detection”, Comput. Vision Graphics Image Process., Vol. 43, pp. 337-346, 1988.