ABSTRACT
PORTERFIELD, KALIE GRACE. Quantifying Consumer Sacrifice Gap for Product Optimization in Mass Customization Environments. (Under the direction of Dr. Scott Ferguson.)
Quantifying Consumer Sacrifice Gap for Product Optimization in Mass Customization Environments
by
Kalie Grace Porterfield
A thesis submitted to the Graduate Faculty of North Carolina State University
in partial fulfillment of the requirements for the degree of
Master of Science
Mechanical Engineering
Raleigh, North Carolina 2013
APPROVED BY:
_______________________________ Dr. Scott Ferguson
Committee Chair
BIOGRAPHY
TABLE OF CONTENTS
LIST OF TABLES ... vi
LIST OF FIGURES ... IX CHAPTER 1: INTRODUCTION AND MOTIVATION ... 1
1.1. MOTIVATION ... 1
1.2. RESEARCH QUESTIONS ... 6
1.3. CHAPTER SUMMARY ... 9
CHAPTER 2: BACKGROUND ... 10
2.1. MASS CUSTOMIZATION ... 10
2.1.1. BENEFITS OF MASS CUSTOMIZATION ... 11
2.1.2. CHALLENGES TO REALIZATION ... 13
2.2. MARKETING TOOLS ... 14
2.2.1. CONSUMER PREFERENCE DATA AQUISITION ... 15
2.2.2. MATHEMATICAL MODELING ... 17
2.3. ENGINEERING TOOLS ... 24
2.3.1. MINIMIZING THE COST OF VARIETY ... 25
2.3.2. INCORPORATING CUSTOMER PREFERENCES INTO DESIGN ... 31
2.4. CHAPTER SUMMARY ... 39
CHAPTER 3: METHOD AND METRIC FORMULATION ... 42
3.1. ASSUMPTIONS ... 42
3.2. MOTIVATION FOR APPROACH ... 45
3.4. SURVEY EXECUTION AND HB MODELING ... 51
3.4.1. GENERAL GUIDELINES ... 52
3.4.2. MARKET SCENARIO APPLICATION ... 59
3.5. QUANTIFYING SACRIFICE GAP ... 69
3.5.1. CHOOSING A “WHAT THE CUSTOMER WANTS EXACTLY” DATUM ... 71
3.5.2. SACRIFICE GAP METRIC DEFINITION ... 74
3.6. MODELING MARKET ALTERNATIVES ... 78
3.6.1. GENERAL PROCEDURE ... 79
3.6.2. COMPETING PRODUCTS ... 82
3.6.3. BASE AND CUSTOM PRODUCTS ... 84
3.7. LEVERAGING SACRIFICE GAP IN PRODUCT DESIGN ... 88
3.7.1. GENERAL CASE STUDY PROCEDURE... 89
3.7.2. VARIABLE REPRESENTATION ... 91
3.7.3. FIRM VALUE METRIC: AGGREGATE CONTRIBUTION ... 94
3.8. CHAPTER SUMMARY ... 95
CHAPTER 4: CUSTOMER-CENTRIC PRODUCT DESIGN... 97
4.1. SACRIFICE GAP CALCULATION EXAMPLE ... 98
4.2. SINGLE OBJECTIVE OPTIMIZATION PROCEDURE ... 105
4.2.1. OBJECTIVE FUNCTION CALCULATION ... 110
4.2.2. GENETIC ALGORITHM PARAMETERS ... 113
4.3. SINGLE OBJECTIVE OPTIMIZATION RESULTS ... 113
4.3.1. INDIVIDUAL-LEVEL SACRIFICE ANALYSIS ... 115
4.3.2. FIRM IMPACT ANALYSIS ... 127
4.4. CHAPTER SUMMARY ... 131
5.1. MULTI-OBJECTIVE OPTIMIZATION PROCEDURE ... 134
5.1.1. OBJECTIVE FUNCTION CALCULATION ... 135
5.1.2. MULTI-OBJECTIVE GENETIC ALGORITHM PARAMETERS ... 137
5.2. MULTI-OBJECTIVE OPTIMIZATION RESULTS ... 137
5.2.2. CUSTOMER IMPACT ANALYSIS ... 142
5.2.3. FIRM IMPACT ANALYSIS ... 167
5.3. CHAPTER SUMMARY ... 175
CHAPTER 6: CONCLUSIONS AND FUTURE WORK ... 179
6.1. RESEARCH QUESTIONS ... 179
6.2. FUTURE WORK ... 184
6.3. CHAPTER SUMMARY ... 188
LIST OF TABLES
Table 2.1: Conjoint Analysis Task Example ... 15
Table 2.2: Part-Worth Sum Example ... 20
Table 2.3: Part-worth Characteristic Example ... 22
Table 2.4: Comparing Part-worths Across Respondents ... 23
Table 3.1: Generic Attribute and Level Matrix ... 55
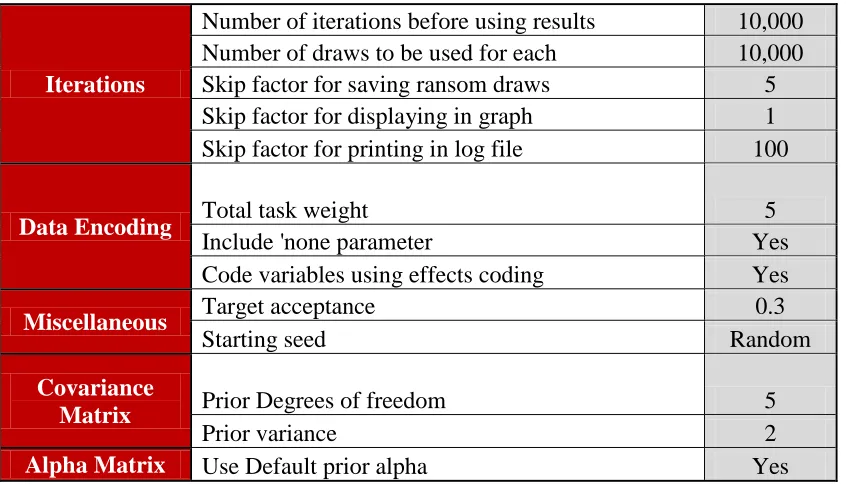
Table 3.2: Sawtooth CBC/HB Standard Model Fit Settings... 58
Table 3.3: Sample of Respondent Part-Worth Utilities ... 58
Table 3.4: Final Attribute Description ... 60
Table 3.5: Final Attribute and Level Configuration ... 61
Table 3.6: Qualitative and Quantitative Definitions ... 74
Table 3.7: Product Utility Sum Example ... 80
Table 3.8: Mass Production Attribute Pricing Structure ... 81
Table 3.9: Example of Product Mass Production Price Calculation ... 82
Table 3.10: Hypothetical Market Scenario Competing Products ... 84
Table 3.11: Hypothetical Market Scenario Base Product ... 85
Table 3.12: Customization Tax Structure ... 87
Table 3.13: Summary of Multi-Objective Optimization Attribute Level Representation ... 93
Table 4.1: PVC Part-worths for customer i ... 98
Table 4.2: Customer i's Ideal Product Configuration and Price ... 99
Table 4.4: Customer i's Ideal Product Utility ... 100
Table 4.5: Customer i's Best Available Alternative Utilities ... 102
Table 4.6: Total Utility Range Calculation Example ... 103
Table 4.7: Example Available Attribute Configuration ... 106
Table 4.8: Example Available Attribute Variable Representation ... 107
Table 4.9: Customization Tax Calculation Example ... 108
Table 4.10: Custom Product Profile Utility Calculation Example ... 109
Table 4.11: Single Objective Optimization Configuration ... 114
Table 4.12: Sacrifice Gap Change Behavior from Mass Production to Customization ... 116
Table 4.13: Respondent Choice Behavior Summary ... 117
Table 4.14: Feature and Price Importances by Best Available Alternative in Mass Production ... 119
Table 4.15: Optimal GA Configuration Market-Level Metrics ... 128
Table 5.1: Objective Function Values for Pareto Points ... 139
Table 5.2: Level Configuration Behavior Summary... 140
Table 5.3: Pareto Configuration for “Sometimes Offered” Levels... 141
Table 5.4: Pareto Point FCMSP for All Alternatives ... 143
Table 5.5: Customer Segmentation Summary ... 144
Table 5.6: Respondent 165’s Level Choice Behavior (PVC) ... 153
Table 5.7: Respondent 165’s WAP Part-Worths ... 155
Table 5.8: Respondent 6’s Storage Choice Behavior for Lines 4 and 5 ... 157
LIST OF FIGURES
Figure 1.1: Product Design Strategy Spectrum... 3
Figure 1.2: Merging Marketing and Engineering Knowledge in Pursuit of MC ... 6
Figure 2.1: Market Segmentation Grid Diagram (adapted from Meyer and Lehnerd 1997) .. 33
Figure 2.2: Segmentation-Based Mass Customization (SBMC) Model ... 35
Figure 3.1: Histogram of Maximum Allowable Product Price [77] ... 47
Figure 3.2: Research Question Investigation Flow Chart ... 51
Figure 3.3: Section 3.4 Investigation Process Flow Chart ... 52
Figure 3.4: Choice Task Example ... 63
Figure 3.5: Demographic Questions ... 65
Figure 3.6: Functional Use Questions ... 66
Figure 3.7: Section 3.5 Investigation Process Flow Chart ... 69
Figure 3.8: Attribute Importance Calculation Example ... 76
Figure 3.9: Normalized Sacrifice Gap Illustration ... 77
Figure 3.10: Section 3.6 Investigation Process Flow Chart ... 78
Figure 3.11: Section 3.7 Investigation Process Flow Chart ... 88
Figure 3.12: Genetic Algorithm Process ... 91
Figure 4.1: Sacrifice Gap Distribution by Best Available Alternative ... 121
Figure 4.2: Sacrifice Gap by Change Behavior ... 123
Figure 4.3: Individual Sacrifice Gaps in Mass Production and Custom Markets ... 125
Figure 5.1: Pareto Frontier ... 138
Figure 5.2: Sacrifice Gap Reduction for Type 1 Respondent Subset ... 146
Figure 5.3: Type 2 Proximity to Sacrifice Gap Reduction ... 149
Figure 5.4: Type 2, Base Product Selecting Individual Sacrifice Gaps ... 151
Figure 5.5: Mass Production and Custom Individual Sacrifice Gap for Type 3 Respondents ... 160
Figure 5.6: Type 3 Respondent Subset ... 162
Figure 5.7: Type 4 Sacrifice Gap Fluctuation ... 166
CHAPTER 1:
INTRODUCTION AND MOTIVATION
This chapter provides context for the work in this thesis by discussing tools in the engineering and marketing domains that look to enable a practical application of mass customization in real markets. The motivation for this work comes from identification of knowledge gaps in the formulation and application of these tools. The motivation is translated into two research questions that address the need for greater integration of engineering and marketing research in the pursuit of mass customization. The chapter concludes with an outline of this thesis.
1.1.
MOTIVATION
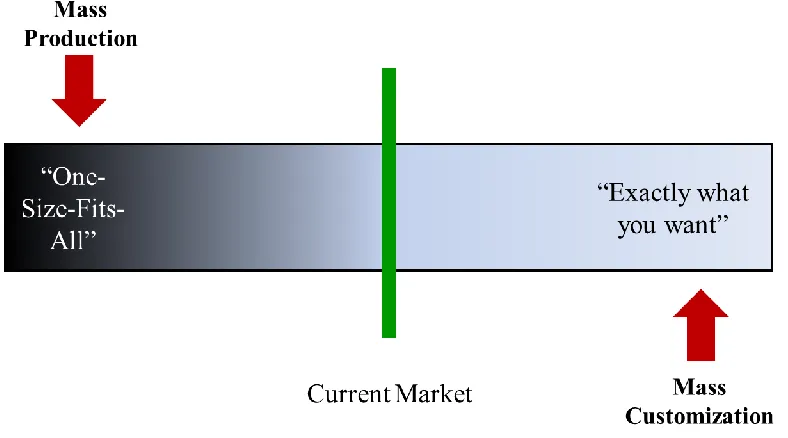
Individual customers are, by nature, unique in their product preferences. Person A may prefer a blue sedan with leather seats and a manual transmission, while Person B may prefer a black SUV with cloth seats and an automatic transmission. Person C, meanwhile, may prefer some mix of both vehicle configurations. In choosing how to approach this heterogeneous market, a vehicle company will choose a design strategy that represents a point lying somewhere between mass customization (everyone is different) and the one-size-fits-all extreme of mass production (everyone is the same). Mass production provides the firm and consumer with the greatest opportunity to capitalize on efficiency and cost savings, but at the expense of fully meeting all of an individual customer’s needs and/or preferences.
practical definition adapted from Pine and used by Ferguson et al. (2011) is the “concept of MC is to provide consumers with custom goods and (services) at prices consistent with mass production” [2], [3]. Taken from Ferguson et al. and Davis’ ideas, mass customization is defined by the following two tenets:
1) goods and services that maximize customer value by giving them “exactly what they
want”, and
2 ) providing these goods and services at “prices consistent with mass production”
Figure 1.1: Product Design Strategy Spectrum
Marketing, on the other hand, has traditionally been responsible for soliciting and interpreting customer preference data, i.e. determining “exactly what they want" [9]. The One method of quantifying customer preferences involves the use of conjoint surveys [10]. When used in conjunction with certain discrete choice models, such as hierarchical Bayes mixed logit, one can numerically represent estimations of respondent preferences for product attributes for each respondent [11]. This information can then be used to compare a respondent’s perceived value of one product to another.
In theory, incremental variety should increase a customer’s chances of finding a product that best meets their needs. Practice suggests, however, that too much variety can dampen a company’s success by flooding the market with too many options. This notion is reinforced by Iyengar (2010), who notes that too many choices can delay or discourage consumer purchase decisions due to the increased cognitive load [13]. This brings forth the challenge of offering the right amount of variety to the right market. Although engineering and marketing have traditionally been segregated fields, Michalek et al. (2005) notes the importance of incorporating more marketing information into product family design [14]. Recent work in the design community has begun to challenge this segregation, incorporating market considerations such as customer preferences and competition into product design problems [15] [16].
“what the customer settles for”[2]. Every time a customer selects a product from the shelf they make a decision based on weighing tradeoffs associated with the available options. Standard products may exhibit feature excess at a price premium, feature deficiency at a price discount, or some combination of both. By purchasing a product that does not exactly meet their needs and/or preferences, a customer experiences some magnitude of sacrifice gap. This magnitude is different for each customer and is dependent upon their preferences as well as the offerings of all firms in the market. The concept of sacrifice gap has been acknowledged in both the engineering and marketing communities, but current literature has yet to provide a means of quantifying it for or applying it to product design [2].
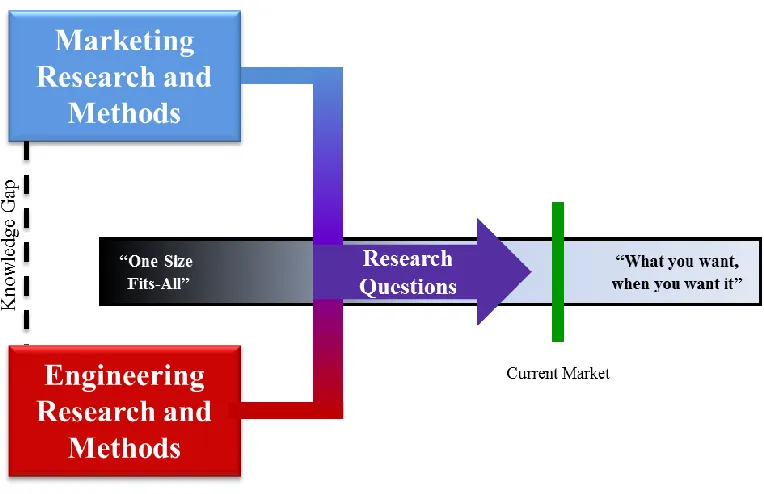
engineering and marketing domains to push the resulting product lines closer to the mass customization pole from Figure 1.1. This objective is illustrated in Figure 1.2 below.
Figure 1.2: Merging Marketing and Engineering Knowledge in Pursuit of MC
1.2.
RESEARCH QUESTIONS
How can sacrifice gap be empirically defined using quantified respondent choice data?
The goal of Research Question 1 is to provide a means to measure how far alternatives in a particular market are from providing the consumer “what they want exactly”. The principle challenge associated with calculating sacrifice gap is developing empirical relationships for the terms in Pine and Gilmore’s equation: “what the customer wants exactly” (referred to as the “ideal product”) less “what the customer settles for” (referred to as the “best available product”). A numerical representation of respondent preferences on an individual level is necessary for quantifying sacrifice gap. Furthermore, an explicit method for using these preferences to define the “ideal product” and the “best available product” that is not case-study specific is required.
phase. Respondent preference information is commonly integrated by optimizing product line configurations for firm-centric metrics such as share of preference and aggregate contribution. Although these metrics involve embedded consumer preference information, none explicitly maximize value for the consumer. The second research question (RQ2) follows then:
How can sacrifice gap be leveraged as a customer-centric metric to guide product line design decisions towards mass customization?
Research Question 2 looks to build on previous work that indirectly incorporates respondent preference information into product design by using a consumer-centric metric as an optimization objective rather than just a firm-centric one. The goal of Research Question 2 is to explore how direct incorporation of respondent preferences can help fulfill the first tenet of mass customization from an engineering design standpoint.
from marketing and engineering disciplines to provide an interdisciplinary approach to practical execution of mass customization strategies.
1.3.
CHAPTER SUMMARY
CHAPTER 2:
BACKGROUND
This chapter presents the necessary background research to justify the significance of the research questions presented in Chapter 1 and to facilitate a clear understanding of the approach developed in Chapter 3. An overview and discussion of the following areas are presented: 1) definitions and commentary relating to the concept of mass customization, 2) methods of customer preference information acquisition to determine “what the customer wants”, and 3) engineering design methods and strategies to achieve “what the customer wants” at “prices consistent with mass production”.
2.1.
MASS CUSTOMIZATION
all definitions of mass customization share two basic constructs: 1) they aim to maximize customer value by offering customized products to the masses and 2) they aim to leverage innovation in design, manufacturing, and distribution to provide customized goods at prices comparable to mass production. These constructs are concisely described as the two tenets of mass customization in Chapter 1.
The remainder of this section discusses the benefits to the firm and consumer that mass customization provides, as well as highlights the challenges to its practical execution.
2.1.1.
BENEFITS OF MASS CUSTOMIZATION
The appeal of mass customization is its ability to simultaneously increase value to the consumer and the firm when compared to mass production. In this context, customer value refers to the net benefits garnered from product purchase. Firm value refers to metrics that correlate with profitability such as brand awareness, customer loyalty, and profit.
Increased customer value, then, leads to increased firm value. Minimizing sacrifice gap not only provides customers with higher value products, but Peppers and Rogers (1995) argue that a large sacrifice gap leads to less loyal customers and results in lower customer retention rates [18] . Several sources have reinforced the importance of customer retention in the market, especially as competition for customers becomes more intense [18], [19]. Developing new customer relationships is five times more expensive than retaining a current customer, and satisfied customers are more likely to purchase the same brand again [20]. In addition, satisfied customers are likely to tell three others about their positive experience, while dissatisfied customers may tell up to nine others of their discord [21]. Finally, a 5 percent reduction in customer defection can increase profits by as much as 25-85 percent depending on the circumstances and industry [20].
Not only does mass customization facilitate an improved customer-firm relationship, but it also allows firms to charge a higher price. Customers, especially those invested in the product, are often willing to pay a premium for customized. Positive motivators for this behavior include the ability of customized products to better meet the customer’s unique needs, and negative motivators include avoidance of negative attributes present in standard products [22]. Increased market heterogeneity, increased customer expectations, and increased competition between firms for market share characterize today’s marketplace. These conditions make progress toward mass customization highly lucrative.
innovations have provided product variety at a decreased price premium; this helps mitigate sacrifice gap by some degree. Excess variety can become detrimental, however, when it leads to overinflated costs without providing sufficient value in return. A mass customized product, then, would allow the customer to balance the value of additional features with monetary cost; in effect minimizing their perceived sacrifice gap. This conclusion highlights the need for investigation outlined in Research Question 1.
2.1.2.
CHALLENGES TO REALIZATION
Although an increase in demand for individualized products and the prospect of lucrative benefits detailed in literature support the execution of mass customization in industry, the concept has, in the words of Ferguson et al. (2010), “largely not lived up to its promise”[23]. In a review of marketing, engineering, and distribution research related to mass customization, Ferguson et al. (2010) identify gaps in current research knowledge that may help to explain why MC is not broadly applied [23]. Their findings relevant to the research questions addressed in this work are summarized below; numbers 1-3 refer to gaps discerned from marketing literature and 4-6 from engineering literature:
1. Need for further development of tools and methods that allow quantification of customer preferences on an individual level;
2. Need for research and methods that aide in the transfer of information between the engineering and marketing domain;
4. Need for investigation of simultaneous market segmentation and product variant creation to optimize customer value;
5. Need for customer preferences elicitation methods that provide valuable engineering guidelines without overwhelming the respondent;
6. Need for engineering design metrics that quantify how well a product concept meets the need of the consumer [23].
The research questions in this work primarily address gaps 2, 4, and 6; relevant background from both engineering and marketing domains is presented in the following sections. Section 2.2 focuses on tools developed in the marketing domain that can be used to quantify customer preferences for investigation of Research Question 1. Section 2.3 focuses on the body of work in engineering that has strived to fulfill the tenets of mass customization. This thesis looks to expand upon these works in order to answer Research Question 2.
2.2.
MARKETING TOOLS
2.2.1.
CONSUMER PREFERENCE DATA AQUISITION
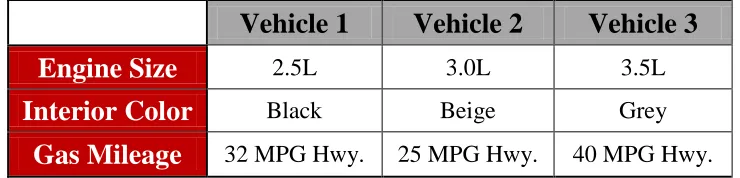
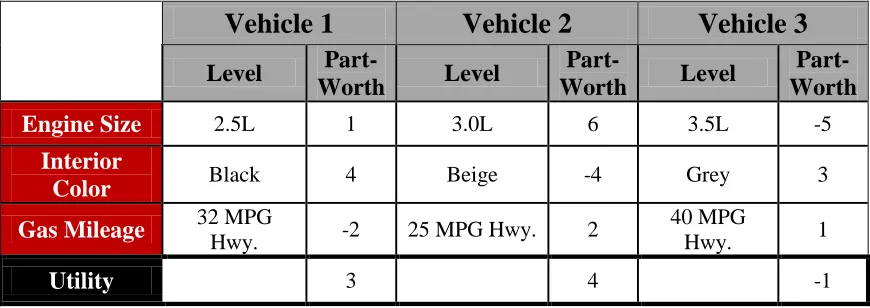
One of the most popular methods to obtain quantifiable customer preference data is through conjoint analysis [10], [24], [25]. Conjoint analysis is rooted in 1960s behavioral psychology, and was not applied to marketing problems until almost 1970. Using this method, respondents are asked to complete a number of questions or tasks; each task asks them to evaluate product profiles that are defined by multiple attributes or features. An example of a conjoint analysis task is depicted in Table 2.1 below. Each column represents the product profile for a vehicle and each row represents a feature of that vehicle.
Table 2.1: Conjoint Analysis Task Example
Vehicle 1
Vehicle 2
Vehicle 3
Engine Size
2.5L 3.0L 3.5LInterior Color
Black Beige GreyGas Mileage
32 MPG Hwy. 25 MPG Hwy. 40 MPG Hwy.If Table 2.1 is used for traditional conjoint analysis, the respondent would be asked to rank order the columns or rate them on a specified scale. If Table 2.1 is used for CBC, the respondent is asked to indicate which column represents their “first choice”. Questions of this structure are repeated, and conjoint analysis yields a numerical representation (part-worth) of how important the surveyed attributes are relative to one another.
Researchers determine the part-worths by working backwards from the choice data taken from the conjoint survey. Put another way, conjoint analysis decomposes product preferences to deduce feature preferences; this stands in contrast to a compositional approach which asks respondents to rate each feature explicitly. These part-worths may be derived using a variety of mathematical tools; the particular method is dependent upon the conjoint approach used and the end use of the data.
The resulting part-worths are used to quantify the value of any product in terms of the attributes and levels featured in the conjoint tasks; this product value is referred to as its utility. This process can be used to evaluate the value of products against one another, and predict how the market will react to a particular product profile or configuration [11], [26], [27].
ignorance of preferences of latent subgroups in a market. Advancements in mathematical modeling techniques and the technologies to execute them have alleviated this challenge. These advancements allow for a more granular representation of consumer preferences, and commercial software packages that use mathematical modeling techniques that allow for individual-level preference assessment are readily available for use. These techniques will be discussed in detail in the next section.
CBC is also a less efficient means to collect the required volume of customer preference choice data when compared to traditional conjoint; respondents must spend more time on each question and a larger number of questions must be asked. The development of commercial software packages has helped mitigate this challenge as well. Survey design has become more efficient so respondents can complete as few tasks as possible. The ability of these software packages to web-host surveys has made disseminating the tasks and collecting the choice data much easier. In addition, CBC is more reflective of a “real world” purchase decision and is “theoretically and statistically more defensible than traditional conjoint” [11]. Given its strengths and the use of technology to mitigate its weaknesses, CBC will be the conjoint analysis survey method used throughout the remainder of this work.
2.2.2.
MATHEMATICAL MODELING
modeled as selecting the alternative that gives them the highest utility when choosing among a set of alternatives [28].
Results from discrete choice surveys can be mathematically modeled using a variety of random utility models (RUMs). These models are derived under the utility maximization assumption and consider a decision maker, i, who obtains a certain amount of value (utility) from alternative k in a choice set. The utility for a particular alternative is known to the decision maker but not the researcher. Therefore the researcher must estimate the decision maker’s utility based on selections made in the choice tasks. RUMs therefore assume two parts to the decision maker’s utility; one part captures the observations garnered from the choice tasks and the other represents factors that affect utility but are not observed through the choice tasks. The utility model of Equation 2.1 illustrates this conceptual model form definition; where Uik is the ith respondent’s overall utility for the kth product, Xijk is the ith
consumer rating of the jth attribute for the kth product, βij is the scaling coefficient of the jth
attribute, and εik is an error term accounting for differences in the observed consumer
response and that modeled by
j
ij ijk
X
. Differences in the observed response and thosepredicted by the model, εik, may be due to factors such as error in model fit, respondent
selection error, or attribute levels not included in the survey [29].
ik j
ij ijk
ik X
For the scope of this work, the most relevant RUMs are hierarchical Bayes mixed logit (HB), latent class multinomial logit (LC-MNL), and Individual Choice Analysis (ICE) models. These models can estimate heterogeneous attribute part-worth utilities, and they are available within widely-used commercial software packages. That is, they do not assume the entire market has the same preferences. Specifically, HB estimates individual-level part-worths, LC clusters individuals into homogeneous (to a certain tolerance) segments and estimates the part-worth of a segment, and ICE estimates individual-level part-worths from LC segments [30].
Comparing the three interpretations, Huber (1998) found that HB and ICE far outperformed LC in predicting individual choices [30]. In addition, although HB and ICE both work well in practice, HB is much more theoretically elegant, well established, and estimates individual-level preferences more effectively than ICE [30]. The goal of mass customization is to achieve a “market of one,” ergo accurate and reliable estimation of customer preferences to that granularity is vital. For these reasons, HB modeling is used to quantify discrete choice conjoint data in this thesis.
Hierarchical Bayes uses market-and individual-level discrete choice data (hence the name “hierarchical”) to derive part-worths for each respondent. A part-worth refers to the “value” of a particular level of a particular attribute; it is the ij term in Equation 2.1 above. The
j ijk
X term is like an “on/off” switch that determines whether a particular feature level
(and its corresponding βij) is present on the product. Since the
j ijk
X refers only to the presence
correspond to the feature levels that define a product gives the utility of that product profile, ik
U .Table 2.2 expands upon Table 2.1 to illustrate this concept.
Table 2.2: Part-Worth Sum Example
Vehicle 1
Vehicle 2
Vehicle 3
Level
Part-Worth Level
Part-Worth Level
Part-Worth
Engine Size 2.5L 1 3.0L 6 3.5L -5
Interior
Color Black 4 Beige -4 Grey 3
Gas Mileage 32 MPG
Hwy. -2 25 MPG Hwy. 2
40 MPG
Hwy. 1
Utility 3 4 -1
The dual-level approach to deriving part-worths is HB’s key differentiating factor mathematically. On a market-level, HB modeling assumes that the collection of individuals’ part-worths is distributed multivariate normal and is characterized by a vector of means and a matrix of covariances. This distribution is given as Equation 2.2, where is a vector of
part-worths for the ith individual, is a vector of means of the distribution of the market’s part-worths, and D is a matrix of variances and covariances of the distribution of part-worths across individuals [31].
On an individual-level, each respondent’s part-worths are governed by a multinomial logit model. A general form of this model is given as Equation 2.3 where is the probability of an individual choosing the kth concept (referred to as a product profile above) in a particular choice task and is a vector of values describing the jth alternative in that
choice task.
∑ (2.3)
The goal of HB model fitting is to maximize the probability (also called the “likelihood”) that the varied parameters reflect the selections a respondent made in the conjoint choice tasks. These varied parameters include , , and D [31].
This work uses Sawtooth’s Software’s CBC/HB software to fit an HB model to the choice data. The approach used in this software adopts a mixed logit model to determine the parameters. Mixed logits are a mixture of the logit function evaluated at different β’s, and their error functions have an extreme value distribution (iid). An extreme value distribution is very similar to a normal distribution, but with fatter tails; this makes the model more robust because it can account for slightly more aberrant model behavior than if normal were used [29].
re-several thousand iterations or more, until convergence is reached. An in-depth description of how hierarchical Bayes calculates individual level part-worths is provided in [31]. Additional resources that detail all model forms discussed in this section can be found in [28], [29].
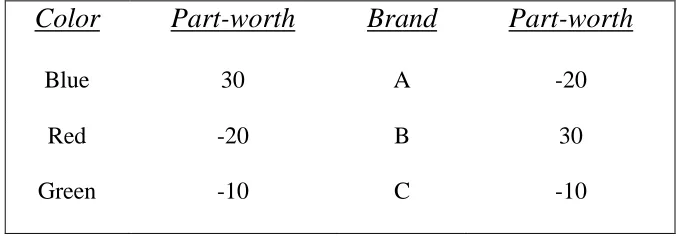
The properties of the part-worths derived by the HB model have great implications for data usage and analysis. The part-worths are interval data that have been scaled to an arbitrary additive constant within each attribute. This scaling gives all discrete choice models (including HB) two consistent characteristics 1) only differences in part-worths are relevant and 2) the scale of part-worths is arbitrary [29]. The implications of these characteristics are illustrated using Table 2.3, which is adapted from [11].
Table 2.3: Part-worth Characteristic Example
Color
Part-worth
Brand
Part-worth
Blue 30 A -20
Red -20 B 30
Green -10 C -10
utilities that are zero-centered, some utilities within an attribute must be negative. Because only differences in utility matter, the fact that Red and Green have negative utilities does not mean that they are “disliked” by the market; rather, it just means they are favored less than Blue. In addition, adding a constant to all part-worths for a particular respondent (effectively changing the scale of all utilities within each attribute) or multiplying all part-worths for a particular decision maker by the same constant has no consequence on the meaning of the data.
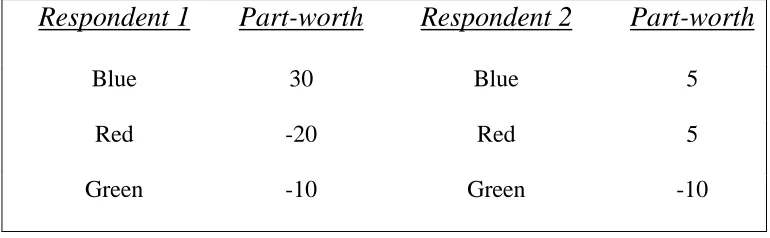
Although attribute part-worths can be compared for a single respondent, they cannot be compared across multiple respondents. Table 2.4 helps illustrate this concept.
Table 2.4: Comparing Part-worths Across Respondents
Respondent 1
Part-worth
Respondent 2
Part-worth
Blue 30 Blue 5
Red -20 Red 5
Green -10 Green -10
The individual-level part-worths derived from CBC choice tasks and subsequent HB modeling are used to numerically define sacrifice gap (Research Question 1) which is, in turn, applied to a product line optimization (Research Question 2). The next section presents relevant work in the engineering domain that looks to fulfill the two tenets of mass customization.
2.3.
ENGINEERING TOOLS
Engineering design research has looked to fulfill the two tenets of mass customization primarily through offering variety at prices consistent with mass production. The primary vehicle used to meet these challenges is the concept of product platfoming; a strategy used to create product families [6] By definition, a product platform is a “set of parameters (common parameters), features, and/or components that remain constant from product to product, within a product family,” [32]. The product family, consequently, is a group of products that are created from these common parameters. Product platforming is a well-recognized method for increasing variety while reducing lead times and maintaining costs comparable to mass production [4–6], [33].
A large body of work exists that focuses on minimizing the cost of variety (fulfilling aims associated with the second tenet of mass customization) by decreasing complexity, increasing commonality, and decreasing cost. The body of work that looks to determine the extent and characteristics of variety that best meet the wants and needs of the individual is much less developed; this is the body of work this thesis looks to build upon. This section summarizes the engineering design research that has contributed to the push toward mass customization; strategies and tools that address the first and second tenets of mass customization are noted.
2.3.1.
MINIMIZING THE COST OF VARIETY
The actual design of the product family often incorporates these architectures and involves considering numerous complex, somewhat abstract, integrated variables to create an optimal portfolio of products. Optimal in this case does not refer to a singular solution or architecture, however, because these problems are inherently multi-objective[9]. Simpson et al. (2004) conducted a review specifically targeting optimization methods used in product family design [6]. Those commonly used in previous literature included SLP, SQP, NLP, GRG, genetic algorithms (GA’s), simulated annealing, pattern search, and branch and bound techniques. Since product platforming problems are typically combinatorial and complex, genetic algorithms were advocated as the most effective in general [6].
To assess how well a product platform design minimizes the cost of variety there is a need for metrics that quantify its effects on the cost of design and manufacturing. These metrics are often used as the objective functions, and have traditionally focused on minimizing complexity, increasing commonality, and decreasing cost. Works associated with developing and improving metrics used to optimize product families for maximal variety and minimal cost are discussed in the following sections.
2.3.1.1.
COMPLEXITY
upon variety and much more difficult to estimate. Examples of indirect costs include logistics, quality, capacity change due to non-uniform product production, raw material inventory, work-in-progress inventory, finished goods inventory, and post sales inventory; all of which are a function of complexity [36]. Bruns and Kaplan (1987) note that overhead costing in particular is heavily situational and dependent upon the complexity of the product line; consideration must be given for component complexity, number of manufacturing operations, and number of individual components [37].
Out of the three platform architectures, modular platform architectures help reduce complexity in a product line as they greatly simplify the design and manufacture process. The body of research in this area includes methods to identify features that can be made modular, and the design of modular features to maintain performance.
One approach to modularization is from a functionality standpoint. Yu et al. (2003) used a design structure matrix (DSM) as a means to identify highly interactive product elements that could be grouped into a module, they then compared this method to MFD and heuristics to find it was the most repeatable [38]. Other works that explore methods to group product elements into modules include Malmstrӧm and Malmquist (1998) who employed MFD and DSM to quantify both technical and economic factors in early product development and Stone et al. (2000) who investigated a more elaborate heuristic formulation [39], [40].
reinforce this notion by stating the importance of standard interfaces within a product family and identifying the consequences that stem from lack of standardization [41–43].
2.3.1.2.
COMMONALITY
Similar to decreases in complexity, increases in commonality among product variants is a fundamental goal of product platforming meant to reduce costs in development and production. Researchers have investigated how to best measure, identify, and use commonality as a constraint or optimization objective in engineering design. Concerns regarding excess commonality, and therefore decreases in perceived variety, have also been addressed. A small sample of work in this area is discussed below.
Hӧlttӓ et al. (2003) developed a five-step algorithm to find common modules across products and Dahmus et al. (2001) proposed a product family architecture created by interchangeable modules using a modularity matrix to identify commonality [47], [48]. Fellini et al. (2005) formulated the design problem to maximize shared product components without exceeding a user-defined performance loss tolerance [49]. Fellini et al. also worked on developing a modular platform design process around a commonality of components constraint [50]. Nayak, Chen, and Simpson (2002) expanded upon this work by including both commonality and performance criteria as competing objectives in optimizing the product family as a whole [51].
Increasing commonality across a product family does decrease cost, but it may also decrease revenue due to product cannibalization if products become too similar [7]. Therefore, firms must find a balance between commonality of components and variety of the end product. Simpson and D’Souza (2003) introduced a genetic algorithm that used commonality and individual product performance (likened to distinctiveness) as competing objectives [52]. A Product Variety Tradeoff Evaluation Method was proposed for assessing product platforms with varying levels of commonality by Simpson et al. (2001) [53] while Dobrescu and Reich (2003) looked to maximize commonality by incorporating shared modules among variants in a product family while maintaining key components in each different product [54].
2.3.1.1.
COST
Both complexity and commonality are product line characteristics often used as a proxy measurement of cost. Estimation of actual product line cost and its use in product line design is not uncommon, however. Fujita and Yoshida (2004) developed a monotonic cost model to assess the benefits of commonality while Gonzalez-Zugasti et al. (2000) proposed a methodology for product platform design that took cost and performance requirements into account [55], [56]. Siddique and Repphun (2001) and Roemer and Fixson (2002) developed methods to link cost to product architecture decisions [57], [58]. Park and Simpson (2007) also map costs to product family components and incorporate the effect of design decisions on activity costs to give a more complete view of product family design expenses [59]. Helo et al. (2009) created a model for analysis of variety from a cost perspective and Wang et al. (2007) developed a procedure for product platform configuration to minimize cost [60], [61]. De Weck et al. (2003) optimized product platform design by maximizing profitability and minimizing cost and development time [62].
2.3.1.2.
MINIMIZING THE COST OF VARIETY SUMMARY
design work that addresses the first tenet of mass customization: determining “what the customer wants exactly”.
2.3.2.
INCORPORATING CUSTOMER PREFERENCES INTO
DESIGN
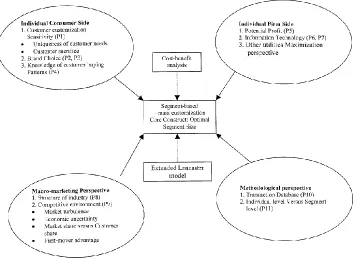
Michalek et al. (2005) notes the importance of incorporating more marketing decisions into product family design [63]. Although the customer preference component of product design has been traditionally left to marketing research, recent work in the design field has integrated this metric into product family design. The body of work that looks to incorporate customer preferences into engineering design can be divided into two groups; market segmentation and demand modeling. Market segmentation involves dividing the market into groups of consumers that have similar preferences; products are then designed to meet the wants and needs of consumers in that segment. Demand modeling incorporates consumer choice data, typically from conjoint analysis, into the product line design process by using it to calculate and optimize metrics such as profit or market share. Relevant works in each of these areas are discussed below.
2.3.2.1.
MARKET SEGMENTATION: CUSTOMER
INCORPORATION PRIOR TO DESIGN
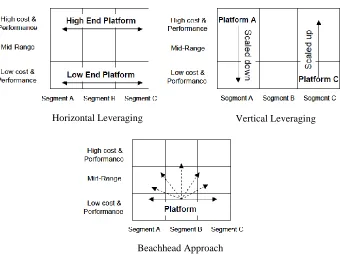
purpose of this grid is to aide in product design for effective product positioning, i.e. balancing the tradeoff between customer diversity and cost of additional variation [65]. For example, Farrell and Simpson (2001) applied this strategy to identify platform leveraging strategies in a flow control valve product line [66].
In general, the market is broken up into market segments that define a particular user-group. Price/performance tiers are also divided into segments such as low cost and performance, mid-range, and high cost and performance. Market segments are plotted horizontally on a grid and price/performance tiers are plotted vertically. The intersection of a vertical market segment line and a horizontal price/performance tier line denotes a specific market niche for which a product is designed.
Figure 2.1: Market Segmentation Grid Diagram (adapted from Meyer and Lehnerd 1997)
More recently, work has begun to incorporate market segmentation directly into product line design optimization problems. Zhang et al. (2007) used engineering characteristics derived from customer preferences and purchasing behaviors in conjunction with fuzzy clustering as a means of market segmentation [67]. Kazemzadeh et al. (2009) also used conjoint data and clustering to segment a market and compare design of a standard product with design of custom products for each segment [68]. They found that customizing products for each segment led to increased customer satisfaction and increased cost savings due to commonality.
Horizontal Leveraging Vertical Leveraging
Although the market segmentation grid provided a key step in better linking the engineering and marketing domains, its de facto means of application is not sufficient to address the first tenet of mass customization. The market segmentation grid is a very high-level means of customer preference incorporation because it focuses on differentiating products based on general customer preference information. As such, it is often viewed as a corporate strategy tool rather than a primary concern in the more granular stages of product design.
Figure 2.2: Segmentation-Based Mass Customization (SBMC) Model
2.3.2.2.
DEMAND MODELING: CUSTOMER INCORPORATION
DURING DESIGN
While the market segmentation grid itself does help determine design parameters using perceived customer wants and needs, its de facto method of use does not incorporate customer preference information into the product line optimization. Market-based engineering design research and method development is beginning to use customer demand modeling techniques taken from the marketing domain in conjunction with market segmentation and other consumer preference-based metrics in an effort to more directly incorporate customer preferences into engineering design optimization.
estimates the net gain to a company in the market if only direct product costs and revenues are considered.
The works cited above pursue consumer demand modeling either homogeneously (everyone has the same preferences) or represent heterogeneity but dividing the market into homogeneous segments. More work has investigated the effects of granularity in demand modeling (how and to what magnitude heterogeneity is represented in the model) on the outcome of the optimization. Ferguson and Donndelinger (2010) used share of preference as a metric to assess how the choice of a Latent class multinomial logit or hierarchical Bayes mixed logit model of consumer preferences affected the configuration and performance of an optimal product family design [14] Michalek et al. (2011) performed a firm-level product line optimization (where profit was the objective) that investigated the effect of modeling consumer demand on three levels of granularity; homogeneous preferences, segmented heterogeneous preferences, and continuous (individual-level) heterogeneous preferences [13]. In general, the study found that modeling customer demand more heterogeneously provided higher value to the firm in the form of profit and market share. The use of highly granular demand models is, at this time, an underdeveloped area of consumer preference incorporation in engineering design.
these models in the marketing community, and their prevalence in engineering optimization problems is steadily growing. Derivatives of discrete choice models that extract preferences on an individual level, and their incorporation into product line optimization, provide a potential pathway that can move design closer and closer to true mass customization.
2.4.
CHAPTER SUMMARY
This chapter presents the concept of mass customization as the embodiment of two seemingly contradictory tenets: 1) goods and services that maximize customer value by giving them “exactly what they want”, and 2) providing these goods and services at “prices
consistent with mass production.”
Sacrifice gap, the measure of “what the customer wants exactly” less “what the customer settles for”, is a widely discussed concept that this work likens to a measure of how close a market is to mass customization. Minimizing sacrifice gap is said to benefit both the customer, by providing greater value, and the firm, by increasing customer loyalty. Despite the perceived benefits of minimizing sacrifice gap, no methodology has been proposed to quantify it.
Providing variety at prices consistent with mass production has been the work of engineering and manufacturing research. Product platforming is the most common design strategy that allows firms to leverage commonality across product lines to maintain mass production efficiency and costs. Much of the research in this area has focused on decreasing costs and increasing commonality across a product line, while the incorporation of customer preference information is becoming more prevalent.
The body of engineering design work that incorporates consumer demand models that leverage discrete choice analysis, DCA, is steadily growing. Much of the existing research focuses on optimizing product lines for firm-centric metrics such as profit and market share. Although these works incorporate consumer preferences into the design process, they are done indirectly since the objective remains a firm-centric metric. In addition, the level of consumer demand model granularity has been at the aggregate or market segment level. Use of individual-level (representing continuous market heterogeneity) models has been executed in several works, and there stands significant potential for research that expands on their findings.
2. Need for research and methods that aide in the transfer of information between the engineering and marketing domain
4. Need for investigation of simultaneous market segmentation and product variant creation to optimize customer value
6. Need for engineering design metrics that quantify how well a product concept meets the need of the consumer [23]
The research questions work to address the knowledge gaps identified in this chapter by quantifying sacrifice gap (Research Question 1) and using the quantified customer preference metric as an objective in engineering product design (Research Question 2). Research Question 1 looks to better facilitate information transfer between marketing and engineering disciplines, while Research Question 2 aims to use this metric (which quantifies how well products meet customer needs) to optimize customer value in product design.
CHAPTER 3:
METHOD AND METRIC FORMULATION
The first two sections of this chapter present the motivation for and assumptions used to investigate the research questions given in Chapter 1. The research questions are investigated in the context of a hypothetical market scenario which is introduced in Section 3.3. Sections 3.4 to 3.7 describe how the research questions are investigated in the context of this hypothetical market scenario. Section 3.4 provides a guideline to obtain and model the data Section 3.5 uses to formulate the sacrifice gap metric. Section 3.6 presents the process to model the alternatives in the hypothetical market. Methods to explore sacrifice gap’s use in product line design are proposed in Section 3.7. These investigations take the form of a consumer-centric, single objective approach to product design and a consumer and firm-centric, multi-objective approach to product design. This chapter concludes with a summary of the key concepts in Section 3.8.
3.1.
ASSUMPTIONS
The proposed approach aims to formulate and use a sacrifice gap to design product lines that better accomplish the two tenets of mass customization. To accomplish these goals, the following assumptions are used:
1. Respondents exhibit compensatory decision making processes
the price increase of the preferred feature. This is in contrast to non-compensatory decision models where a positive evaluation of one attribute does not compensate for a negative evaluation of another attribute [76]. A different respondent may not be willing to purchase a car without automatic transmission regardless of price. Further investigation of compensatory versus non-compensatory models is a research challenge that requires further exploration; the effect of decision process modeling becomes more and more important in design as marketing methods become increasingly incorporated in engineering design.
2. Customers who choose to customize a product are optimizers, not satisficers
This work assumes that a customer seeking mass customized products is an optimizer rather than a satisficer. An optimizer is an individual who attempts to maximize their overall utility by considering both features and price in their decision. Essentially, they believe that a “best” option exists and seek to find it. A satisficer, on the other hand, seeks to purchase the cheapest product that meets a certain user-defined threshold. Note that this may not be the optimal product in terms of overall utility. Satisficers believe that multiple products are sufficient, and are less willing to seek a “best” option.
threshold [74]. Mass customization refers to the existence of a custom product which is unique to the individual, meets their needs in a way that maximizes perceived value, and is proactively specified by said customer. Since a satisficer would not be interested in maximizing value or contributing additional resources to creating such a product, one can assume that individuals interested in mass customized products are optimizers. This assumption is consistent with the utility maximization principle which provides the basis for derivation of Random Utility Models used to quantify consumer preference data in this thesis.
3. The firm is able to produce and distribute mass customized products using the price structure defined defined price structure
4. The market is static at the time the product line is designed
5. The company has defined a subset of attributes that they can feasibly customize, and these attributes are included in the conjoint survey
6. The part-worths of attribute levels are linear additive and their sum yields the overall product utility
Conjoint analysis often assumes a linear additive part-worth utility model [11]. Although it is possible to add non-linear interaction terms, this work does not explore the effect of non-linearities and therefore neglects adding them to the model.
7. Interpolating between part-worth values for continuous attribute levels is done in a linear manner
function. Further, the price part-worths are constrained to be decreasing (that is a lower price is always preferred to a higher price).
The following section provides the motivation for the approach used to investigate the two research questions from Chapter 1.
3.2.
MOTIVATION FOR APPROACH
The information presented in Chapter 2 highlights the generic need for better integration of customer preferences into engineering design so product line design can be pushed toward goods that better provide the customer “exactly what they want” at “prices consistent with mass production.” The conclusions of a literature review conducted by Ferguson et al. (2010) support this notion, and hypothesize that the need for better mapping of information from marketing to engineering will lead to a multi-objective problem composed of competing consumer and firm value propositions; minimization of sacrifice gap being the former and minimization of production cost being the latter [23]. Ferguson et al. (2011) begin to address this hypothesis by examining challenges associated with developing the customer value metric of sacrifice gap [77]. Specifically, they investigate the complexities associated with applying marketing methods of consumer preference modeling to mass customization engineering design problems for mass customization.
of product attributes included in the survey (e.g. no display screen and ability to play video), and viability of text-only surveys when attributes are spatial in nature (e.g. diagonal screen size).
Using utility part-worths calculated in fitting the HB model, Ferguson et al. (2011) examine preference tendencies to determine each respondent’s “ideal product.” An ideal product is defined as the combination of non-price attribute levels that yields the highest cumulative utility. The cumulative price-excluded utility is referred to as the Price Excluded Product Utility in this work. Once each respondent’s ideal product and corresponding utility are determined, this work calculates the maximum price each respondent would pay for this product [77].
respondent’s maximum allowable price can be used as a constraint in the multi-objective optimization problem described above [77].
Upon performing this calculation, Ferguson et al. (2011) derived the histogram found in Figure 3.1 below.
Figure 3.1: Histogram of Maximum Allowable Product Price [77]
grossly inaccurate results because the decision maker’s choice behavior is unknown and can differ drastically from trends in the known region (where the model is defined by price points included in the survey).
The conclusion of this work identifies several areas of improvement for future work to address. These issues include:
Improvements in survey creation and execution
Deeper understanding of how utility curves are related to consumer psychology
How compensatory decision making is captured in conjoint surveys and the potential use of adaptive conjoint or partial profile conjoint methods
Whether use of linear additive attribute part-worths provide accuracy sufficient for mass customization applications
Uncertainty in respondent preference modeling
Behavior of unique ideal product count with respect to increasing number of respondents [77]
3.3.
MARKET SCENARIO INTRODUCTION
The hypothetical market scenario begins with a firm, Company X, mass producing a single MP3 player configuration; this configuration is referred to as the base product. Their competitors collectively produce three products; a low-price, mid-price, and high-price option. In addition to outside product competition, Company X’s internal product also competes against a consumer’s ‘walk away’ option (the ‘None’ part-worth utility from conjoint analysis). The internal product(s) are those produced and sold by Company X; when only the base product is produced there is only 1 internal product. The base product, three competing products, and ‘None’ option define the alternatives in the “mass production market”.
This scenario places Company X at the beginning of the design phase for a subsequent generation of products; this generation of product will be part of the “customization market”. The new generation will give consumers two options: purchase the base product at the same price as before or customize an mp3 player at a price premium. The competing products are assumed static in this market scenario. This means that in the customization market the customer will have the option of pursing a customized product in addition to all of the alternatives present in the mass production market; the prices and, as a result, utilities of these mass production market alternatives are unchanged in the customization market.
market alternatives. In the customization scenario the internal products are all possible custom MP3 player configurations in addition to the base product.
If a customer chooses to purchase a customized MP3 player, they will choose the group of available feature levels that provide them the greatest net utility; this optimization includes consideration of both feature and price utilities. This product is called their optimal product (given a particular choice set of level options). Note that some feature adjustments increase the price of the product, while others create a net price reduction in accordance with which levels are chosen. The price of this optimal product will include the incremental price of all features present on the product as well as a customization tax penalty. This customization tax serves to account for the added financial burden to the firm of offering customization options. Details pertaining to the magnitude and application of this customization tax are included in subsequent sections.
According to literature, the inclusion of customization options should increase Company X’s differentiation with respect to competing firms and increase customer loyalty [18], [19]. Sacrifice gap is used to help determine and assess the configuration of potential next generation MP3 player product lines (which feature levels are available as customization options).
Figure 3.2: Research Question Investigation Flow Chart
Section 3.4 describes how the discrete choice survey is developed and executed using Sawtooth SSI Web, and how the resultant consumer choice data is modeled using a hierarchical Baysian approach conducted using Sawtooth Software CBC/HB. General procedures as well as a detailed account of its application to the hypothetical market scenario are given. Once the consumer preference data is acquired and modeled, Section 3.5 describes how it is used to quantify sacrifice gap on an individual and market-level. Then, Section 3.6 describes the general process used to model alternatives in the market in terms of the HB part-worths; this is also applied to the hypothetical market scenario. Finally, Section 3.7 puts forth the general procedure used in this work to incorporate sacrifice gap into product design as an objective function.
3.4.
SURVEY EXECUTION AND HB MODELING
The first step in the proposed approach is the development and execution of a discrete choice survey to determine customer attribute preferences for the product in question. This section summarizes general guidelines for creating discrete choice surveys and demonstrates
Survey Execution and
HB Modeling
Sacrifice Gap Formulation
Modeling Market Alternatives
Leveraging Sacrifice Gap in
how these are applied to the hypothetical market scenario. This section is highlighted on the flow chart given as Figure 3.3 below.
Figure 3.3: Section 3.4 Investigation Process Flow Chart
3.4.1.
GENERAL GUIDELINES
The following section describes a general procedure for developing and executing a discrete choice survey in Sawtooth SSI Web and mathematically modeling the consumer choice data with HB using Sawtooth Software CBC/HB.
3.4.1.1.
SURVEY DEVELOPMENT AND EXECUTION
Discrete choice survey questions give respondents several product profiles to choose from rather than asking for a direct ranking. Repetition of these questions, or choice tasks, provides the data necessary to measure the perceived values of specific product attributes [78]. For ease of construction and administration, this approach uses an academic license of Sawtooth SSI Web software to create and administer the survey [79]. For optimal survey
Survey Execution and
HB Modeling
Sacrifice Gap Formulation
Modeling Market Alternatives
Leveraging Sacrifice Gap in
effectiveness, the following questions were investigated to determine general guidelines and strategies
Q: How many attributes and how many attribute levels are appropriate?
A: Although the Sawtooth License permits up to 10 attributes and up to 15 levels per attribute, Johnson and Orme (2003) suggest keeping the survey as simple as possible
[80].
Q: How should survey creation be configured in Sawtooth (balanced overlap, random, complete enumeration)
A: The SSI Web Manual suggests using the ‘balanced overlap’ approach as it is a middle ground between random designs and complete enumeration [81].
Q: How many questions should each respondent be asked?
A: In general, Johnson and Orme (1996) found that respondents can be asked up to 20 questions without degradation of response quality because, within that range, there is no evidence of increasing random error in the model [82].
Q: How many respondents are needed to create an accurate model?
A: Johnson, the author of Sawtooth Software’s CBC System, recommends the following rule of thumb for determining requisite number of respondents (Equation 3.1):
(3.1)
Where n is the number of respondents, t is the number of tasks, a is the number of alternatives per task (not including ‘None’), and c is the largest number of levels for any one attribute [11].
Q: Should a ‘None’ option be included?
If a respondent does not like any of the products displayed they may pick the ‘None’ option, this choice simulates the ‘walk away’ situation in a real world purchase case. Johnson and Orme (2003) suggest including the ‘None’ option because it makes choice tasks more realistic, and improves the quality of data [80].
1. Determine which components best describe the product to the consumer and provide engineering guidelines sufficient for product design. Translate these components to attributes featured in the conjoint survey
Step 1 embodies one of the key challenges associated with integrating consumer preferences into engineering design. Discrete choice analysis data can only provide preference data for attributes featured on the survey. These attributes, therefore, must describe the product in a manner that is understood and digested by the consumer and
provide design and performance guidelines to the engineer. The difficulty in identifying and mapping functional components to consumer identifiable attributes differs from product to product.
2. Determine appropriate number of levels for each attribute
Binary attributes such as Wifi/No Wifi on an e-reader or navigation/no navigation on a vehicle are either present or absent in the product configuration. However, other attributes such as storage capacity on the e-reader or exterior color on the vehicle present a greater challenge. For storage space, one must consider the range of sizes to present on the survey and how to distribute the discrete levels within this range. For exterior color, one may consider the number of hues to list as options, the finish (matte, metallic, etc.), and whether to present a custom color or custom graphic options.
following levels for an attribute titled “Photo/Video Playback”: 1. Photo Playback Only, 2. Video Playback Only, 3. Photo and Video Playback, 4. No Photo or Video Playback. This is in contrast to presenting two different attributes “Photo Playback” and “Video Playback” each with “on” or “off” levels.
At the end of step 2, the requisite attributes and levels used to describe customizable features of the product have been established. Table 3.1 shows a generic representation of the resulting attribute-level matrix. This product is described in terms of 5 attributes that have varying numbers of levels. Note that attributes 1 and 4 are binary, and could be merged into one attribute with 4 levels as discussed above.
Table 3.1: Generic Attribute and Level Matrix
Attributes
Levels Attribute 1 Attribute 2 Attribute 3 Attribute 4 Attribute 5
1 1.1 2.1 3.1 4.1 5.1
2 1.2 2.2 3.2 4.2 5.2
3 2.3 3.3 5.3
4 3.4 5.4
5 3.5
3. Design survey in Sawtooth Software
![Figure 3.1: Histogram of Maximum Allowable Product Price [77]](https://thumb-us.123doks.com/thumbv2/123dok_us/1663095.1208839/59.612.191.477.209.417/figure-histogram-maximum-allowable-product-price.webp)