Transactions of the 17th International Conference on Structural Mechanics in Reactor Technology (SMiRT 17) Prague, Czech Republic, August 17 –22, 2003
Paper # K03-5
Quantification of the effects of low magnitude near field earthquakes
Christophe PEDRON (1), Pierre SOLLOGOUB (1) , Sylvain GOUBET (2) , Emmanuel VIALLET (2)
(1) EMSI Laboratory, DEN/DM2S/SEMT, CEA Saclay, F-91 191 Gif-sur-Yvette, France
(2) EDF SEPTEN, 12-14 avenue Antoine Dutriévoz, F 69 628 Villeurbanne Cédex, France
ABSTRACT
The objective of this study is, on one hand, to determine the characteristics (PGA, PGV, duration, …) of near field low magnitude earthquakes (in comparison with further field higher magnitude earthquakes) and, on the other hand, to analyze the effects of such earthquakes on RC-structures.
An important statistical study is performed using a large ground motion database of nearly one thousand records characterized by their local magnitude M and focal distance R. In a first step, (M, R) attenuation laws are established for several classical ground motion parameters, that shows the differences between near field low magnitude earthquakes and further field higher magnitude earthquakes. In a second step, after calculation of different nonlinear RC-structures to the same ground motion database, (M, R) attenuation laws are established for achieved ductility in RC-structures characterized by different design level.
By the way, correlations of damage caused to structures with ground motion parameters, and effects of near field low magnitude earthquakes (compared with further field high magnitude earthquakes), are shown.
INTRODUCTION
This study began in 1998 when the Safety Nuclear French Authority decided to revise in the French Fundamental Safety Rule (called RFS 2001-01) intended for the determination of ground motion for nuclear facility design. According to RFS 2001-01, the design spectrum is calculated by a correlation law in the form:
log10 PSA(f) = a(f)M + b(f)R – log10R + c(f) (1)
where M and R are respectively local magnitude and focal distance and PSA is pseudo-acceleration for frequency f. For a given nuclear site, M and R are determined from historical seismicity. a(f), b(f) and c(f) are correlation coefficients using a Strong Motion DataBase (SMDB) [1].
In the same time of discussions concerning the new French RFS, Electricité de France (EDF, France) and Commissariat à l'Energie Atomique (CEA, France) decided a research program in two steps, using the same SMDB:
1st step : to establish (M, R) attenuation laws for several classical ground motion parameters;
2nd step: after calculation of the response of different RC-structures to SMDB, to establish (M, R) attenuation
laws for damage factors, in particular ductility
in order to characterize SMDB and their effects on RC-structures, with a particular attention to low magnitude near field earthquakes in comparison with higher magnitude further field earthquakes.
CONSTITUTION OF STRONG MOTION DATABASE
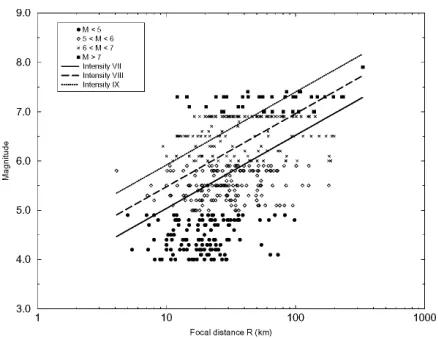
RFS 2001-01 SMDB, established by several European scientific organisms [1], is made of 965 horizontal accelerograms recorded in Europe and USA. Each accelerogram is characterized by local magnitude M, focal distance R and soil characteristics. In this study, we decided not to take into account this last characteristic. This database is rather poor in low magnitude near field earthquakes (only 2% of records are such M<5 and R<10 km). That's why we decided in this study to complete it with 26 near field accelerograms such as R < 12 km collected on a Web site [2]. Figure 1 shows the extended SMDB (991 records) in a (R, M) diagram. Isointensity curves are plotted using Levret's law (1994) [3]:
Figure 1 : composition of extended SMDB
1ST STEP : CHARACTERIZATION OF STRONG MOTION DATABASE
1) Introduction
In order to characterize SMDB, and in order to be consistent with RFS 2001-01 formulation, we decided to determine correlation laws for classical Strong Motion Parameters (SMP), using extended SMDB, in the following form:
log10 SMP = αM + βR + γ log10R + δ (+/− σ). (3)
where σ is the standard deviation. The Strong Motion Parameters concerned are classical:
- A (maximal acceleration or peak ground acceleration),
- V (maximal velocity or peak ground velocity),
- A/V ratio,
- F (mid-frequency), using definition of random process,
- dF/F, dispersion around mid-frequency, using definition of random process,
- T (Trifunac's definition for duration [4]),
- CAV (Cumulative Absolute Velocity) equal to
∫
γ(t)dt where γ(t) is an accelerogram,- Ia (Arias Intensity) equal to
∫
t dtg ()
2
2
γ π
.
2) Regression method for calculating correlation coefficients
The methodology to obtain α, β, γ, δ and σ in equation (3) consists in a classical one step minimization of the following function :
2 10
10 ( log ))
(log − α +β +γ +δ
=
∑
ii
i i
i M R R
SMP
F (4)
which means :
0 = ∂ ∂ = ∂ ∂ = ∂ ∂ = ∂ ∂ δ γ β α F F F
F . (5)
3) Main results
In table 1 are given calculated α, γ, δ and σ coefficients. Because we found βR is negligible, β is taken to 0. Figures 2 to 3 give examples of application of regression laws in two cases, M = 5.5 and M = 6.5 respectively for V and A/V.
SMP α γ δ σ
A (cm/s2) 0.295 -0.985 1.575 0.309
V (m/s) 0.432 -0.945 -2.468 0.340
A/V (s-1) -0.137 -0.041 2.043 0.197
F (Hz) -0.048 -0.125 1.134 0.159
dF/F 0.007 -0.106 -0.523 0.076
T (s) 0.164 0.324 -0.483 0.204
CAV (m/s) 0.324 -0.308 -1.058 0.230
Ia (m/s) 0.495 -0.912 -2.517 0.424
Table 1 : correlation coefficients of equation (3)
Figure 2 : regression curves for V Figure 3: regression curves for A/V
The conclusions of this 1st step are the following: low magnitude near field earthquakes seem to be characterized by:
- high acceleration : A = 0.23 g for M = 5.5 and R = 7 km,
- significant velocity: V = 0.12 m/s for M = 5.5 and R = 7 km,
- rather high mid-frequency : F = 6 Hz for M = 5.5 and R = 7 km,
- short duration: T < 5 s for M > 5.5 and R < 7 km,
- significant Arias Intensity: Ia = 0.3 m/s for M = 5.5 and R = 7 km.
Nevertheless, there is a large dispersion around mid-curves (σ is important for all SMP, see table 1) and correlation laws may not be valid for M < 5 and R < 7 km because of the very few records in extended SMDB in this domain.
2nd STEP: EFFECTS OF SMDB ON RC-STRUCTURES
1) Introduction
To analyze the effects of all the accelerograms in extended SMDB on RC-structures, the following methodology was adopted:
- calculation of the nonlinear response of concrete structures to extended SMDB,
- determination of correlation laws for calculated ductility in structures in the form of equation (3), in order to be consistent again with RFS 2001-01 formulation,
2) RC constitutive law and design level
In our case, concrete structures are supposed to be a one degree of freedom (DoF) oscillator governed by bilinear Takeda's constitutive law that takes into account stiffness degradation, and characterized by a tangential stiffness equal to 1% of elastic stiffness and 5% damping ratio. 3 frequencies are arbitrary chosen for RC-building: fb = 2, 5 and 8 Hz.
Concerning the elastic yield XY of the constitutive law, it is defined with 5% NRC design spectrum respectively and
arbitrarily scaled to 0.025 g, 0.05 g, 0.1 g and 0.2 g. So, for each fb frequency, 4 design levels (or 4 elastic yield XY =
PSA/(2π fb)2) are selected (Figure 4).
PSA
fb f
Figure 4 : determination of elastic yield
3) Principle of calculation
Figure 5: principle of calculation
As shown in Figure 5, for each signal in extended SMDB, the maximal displacement Xmax of the nonlinear oscillator is
calculated by a time-history scheme. Ductility µ is defined by Xmax/XY ratio. For each signal, 12 nonlinear responses are
calculated (3 building frequencies fb X 4 elastic yield XY). These operations are repeated for all the signals in extended
SMDB. At the end, we determine correlation law for ductility (isoductility mid-curves) in the form:
log10µ(fb, XY) = α(fb, XY) M + β(fb, XY) R + γ(fb, XY) log10R + µ(fb, XY) (+/-σ(fb, XY)) (6)
4) First application: comparison of isoductility with isointensity
It can be interesting for design to compare isoductility curves with isointensity curves. In other terms, is isoductility nearly equivalent to isointensity?
0,2 g 0,1 g
0,05 g 0,025 g
991 strong motions in SMDB characterized by M and R
Nonlinear one DoF oscillator (Takeda's constitutive law) characterized by fb and
XY
We can find an answer to this question by considering two RC-buildings designed to 0.1 g NRC spectrum : the first one is 2 Hz frequency, the second one is 5 Hz (it can be an application to French nuclear power plants whose most main buildings are below 5 Hz). For these two cases, the obtained correlation laws for ductility, in application to equation (6), are:
log10 µ = 0.4585 M – 0.0006 R – 0.9703 log10 R – 1.6500 (+/- σ = 0.4033) when fb = 2 Hz,
log10 µ = 0.4252 M + 0.0002 R – 1.2620 log10 R – 0.7588 (+/- σ = 0.4361) when fb = 5 Hz. (7)
As for the first step, an important dispersion around mid-curve is observed: taking into account the standard deviation
σ = 0.4 in equation (7) is equivalent to amplify µ by 10σ = 2.5.
To compare isoductility mid-curves with isointensity mid-curves, we consider Levret's law (equation 2) and Mohammadioun's one (1985, [5]):
M = 0.55 IMM + 2.20 log10R – 1.14 (8)
The results are given in Figure 6 (fb = 2 Hz) and Figure 7 (fb = 5 Hz) where are plotted isointensity mid-curves I=VII
and I=VIII according to equations (2) and (8), and isoductility mid-curves µ=1.5 and µ=3.0 according to equation (7).
Figure 6 (fb=2 Hz) : Figure 7 (fb=5 Hz) :
comparison of isointensity with isoductility comparison of isointensity with isoductility
Figures 6 and 7 show it seem to exist an equivalence between isointensity and isoductility, at least for 2Hz and 5 Hz buildings designed to 0.1 g NRC spectrum. Nevertheless, this conclusion must be moderated: isointensity correlation laws in equations (2) and (8) were established with different ground motion databases, and different than extended SMDB used in this study. Using the same database would be of course more rigorous.
5) Second application: comparison of the effects of near field earthquake with further field one
In this application, the objective is to understand why near field earthquake can be less damaging than further field higher magnitude earthquake despite higher peak ground acceleration.
We consider a 5 Hz building designed to 0.1 g NRC spectrum. In application to equation (7), an earthquake characterized by M=5.5 and R=7 km gives the same mid-ductility µ=3.2 than a further and higher magnitude earthquake characterized by M=6.5 and R=15.3 km.
Figure 8: example of isoductility spectra for a 5 Hz building designed to 0.1 g NRC spectrum
In fact, because of plasticity, the linear frequency fb = 5 Hz shifts in an "equivalent frequency" feq we can evaluate using
Sozen and Shibata's approximation [6]:
µ
b eq
f
f = =
2 , 3
5 =2,8 Hz.
For this equivalent frequency, the far field earthquake (M=6.5; R=15.3 km) gives higher pseudo-accelerations than the near field one (M=5.5; R=7 km).
So, near field earthquake can cause the same damage (or same ductility) than a further and higher magnitude one despite higher peak ground acceleration and higher pseudo-acceleration around linear frequency.
One can observe that the result should be slightly different in the case of the 2 Hz building design to 0.1g NRC
spectrum (a (M=6.4; R=7km) earthquake should lead to the same ductility µ=3.2 than a (M=7; R=15km) earthquake).
However, one can observe finally that, according to these results, buildings designed to 0.1g NRC spectrum (which is a rather moderate design level) should withstand high magnitude – low distance earthquake due to ductility of the structure (µ=3 remains below the ultimate behavior).
6) Third application: correlation of damage and with Strong Motion Parameters
In the first step, several Strong Motion Parameters mid-curves were calculated. In the second step, we calculated ductility in different buildings submitted to extended SMDB.
In this application, we look for possible correlations of ductility with Strong Motion Parameters. The adopted methodology is simple: for all SMP, for the 3 buildings (2, 5 and 8 Hz) and for the 4 design levels (NRC spectrum scaled to 0.025, 0.05, 0.1 and 0.2 g), we plot SMP on X-axis and ductility on Y-axis in order to identify correlations. In the case of 5 Hz building designed to 0.1 g NRC spectrum, correlations of ductility µ = Xmax/XY with maximal
acceleration A seems to appear (Figure 9). We've got the same tendency if SMP is maximal velocity (Figure 10).
Figure 9 : µ versus A Figure 10 : µ versus V
Figure 11 : µ versus duration T Figure 12 : µ versus A/V ratio
In conclusion of this last application, we finally found correlations of ductility µ with:
- maximal acceleration A,
- maximal velocity V,
- Cumulative Absolute Velocity CAV,
- Arias intensity Ia,
whatever the building frequency and the design spectrum.
On the other hand, no correlation is observed with:
- duration T,
- mid-frequency F,
- dispersion around mid-frequency dF/F,
- A/V ratio.
whatever the building frequency and the design spectrum.
In conclusion of the 2nd step, we found some equivalence between isointensity mid-curves and isodamage (isoductility)
mid-curves, at least for frequency building below to 5 Hz. Moreover, some correlations of damage Strong Motion Parameters were observed. Lastly, we gave some explications why near field earthquake can be less damaging than further and higher magnitude one, despite higher pseudo-acceleration.
As for the 1st step, there is a large dispersion around mid-curves (standard deviation in (M,R) correlation laws is
important) and correlation laws may not be valid for M < 5 and R < 7 km because of the very few records in extended SMDB in this domain.
GENERAL CONCLUSION
A statistical study was done using a large strong motion database to characterize seismic motions (and in particular near field low magnitude one) and their effects on RC-structures in the context of the new French Safety Rule RFS 2001-01 intended for the determination of ground motion for nuclear facility design. All the recorded accelerograms of the database are characterized by local magnitude M and hypocentral distance R.
On one hand, (M, R) correlation laws are established for several and classical Strong Motion Parameters (like peak ground acceleration, or duration for example). The calculated mid-curves show near field low magnitude earthquakes are characterized by high peak ground acceleration, significant peak ground velocity, rather high mid-frequency, short duration and significant Arias intensity.
On the other hand, (M, R) correlation laws are established for ductility calculated in RC-structures (different frequencies and design levels) submitted to the same large strong motion database. First, some equivalence between isointensity mid-curves and isodamage (isoductility) mid-curves, at least for frequency building below to 5 Hz, were found. Moreover, some strong motion parameters like peak ground acceleration, peak ground velocity, cumulative absolute velocity and Arias intensity seem to be reliable indicators to predict damage, whatever the building frequency and the design level. Lastly, explications are given why near field earthquake can be less damaging than further and higher magnitude one, despite higher pseudo-acceleration at frequency building: because of plasticity, the building frequency shifts to a lower frequency such as pseudo-acceleration is lower for near field one. It can also be observed that, according to these results, buildings designed to 0.1g NRC spectrum (which is a rather moderate design level), should withstand high magnitude – low distance earthquake due to ductility of the structure.
Nevertheless, there is a large dispersion around mid-curves (standard deviation in (M,R) correlation laws is important) and correlation laws may not be valid for M < 5 and R < 7 km because of the very few records in database used for this study.
REFERENCES
[1] European Strong-Motion Database (CD-Rom). Imperial College (London, UK), Ente Nazionale per l'Energia
Ellettrica (Roma, Italy), Ente per le Nuove Tecnologie, l'Energia e l'Ambiente (Roma, Italy), Institut de Protection et de Sûreté Nucléaire (Fontenay-aux-Roses, France). European Commission, Directorate General XII, Science, Research and Development, Environment and Climate Program, 2000.
[2] http://smdb.crustal.ucsb.edu
[3] A. Levret, J. C. Backe and M. Cushing:" Atlas of Macroseismic Maps for French Earthquakes with their Principal Characteristics". Natural Hazards 10, pp. 19-46, Klumer Academic Publishers, 1994.
[4] M. D. Trifunac and A. G. Brady: "A Study on Duration of Strong Earthquake Ground Motion". Bulletin of the seismological Society of America, Vol. 65, n°3, pp. 581-626, June 1975.
[5] Génie Parasismique, sous la direction de Victor Davidovici, Presses de l'Ecole Nationale des Ponts et Chaussées, 1985, France.